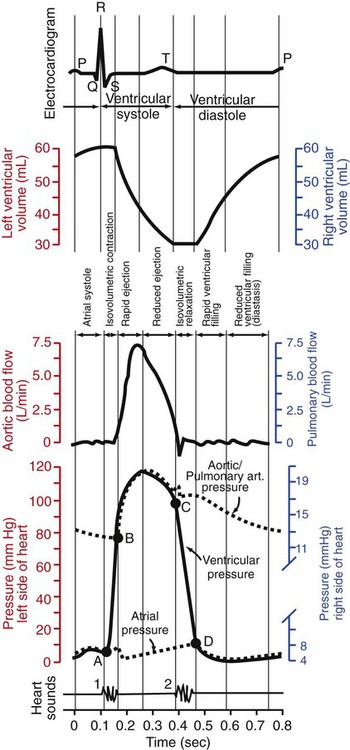
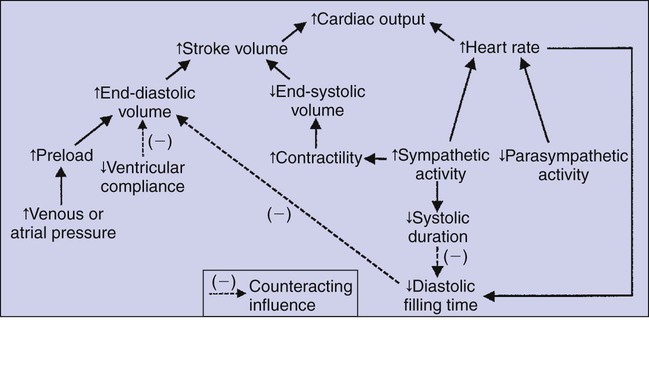
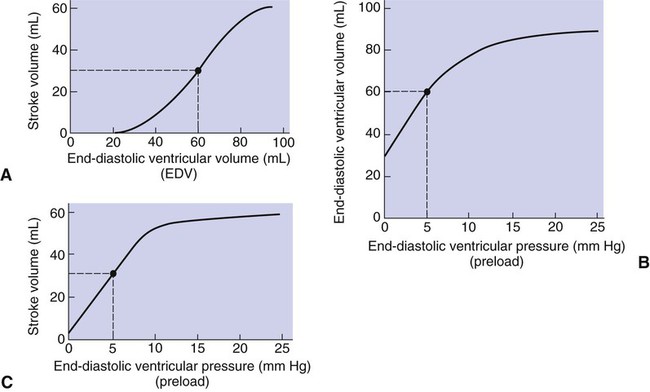
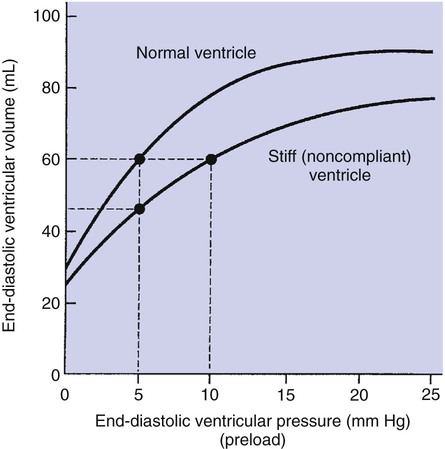
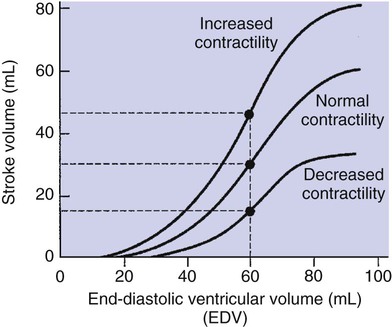
1. Each heartbeat consists of ventricular systole and ventricular diastole. 2. Cardiac output equals heart rate multiplied by stroke volume. 3. Increases in end-diastolic ventricular volume cause increases in stroke volume. 4. End-diastolic ventricular volume is determined by ventricular preload, ventricular compliance, and diastolic filling time. 5. Increases in ventricular contractility cause decreases in ventricular end-systolic volume. 6. Increasing the heart rate does not increase cardiac output substantially unless stroke volume is maintained. 7. Murmurs are abnormal heart sounds caused by turbulent flow through cardiac defects. 8. Some cardiac defects increase the heart’s workload, which causes cardiac hypertrophy. 9. The pathophysiological consequences of cardiac defects are direct results of the abnormal pressures, volumes, and workloads created in the cardiac chambers. Figure 21-1 shows the events of a single cardiac cycle. A normal electrocardiogram (ECG) tracing is presented at the top of the figure. Atrial contraction is initiated by atrial depolarization, which is indicated by the P wave. Ventricular contraction is initiated by ventricular depolarization, which is indicated by the QRS complex. The period of ventricular contraction is called ventricular systole. Blood is ejected from the ventricles during ventricular systole. Each systole is followed by ventricular diastole, during which the ventricles relax and refill with blood before the next ventricular systole. Note that ventricular diastole corresponds to the period between a T wave and the subsequent QRS complex, when ventricular cells are at resting membrane potential. The ventricles do not empty completely during systole. As shown in the graph of ventricular volume (see Figure 21-1, second from top), each ventricle of a large dog contains about 60 mL of blood at the end of diastole. This is called end-diastolic volume. During systole, about 30 mL of this blood is ejected from each ventricle, but 30 mL remains. This is called end-systolic volume. The volume of blood ejected from one ventricle in one beat is called stroke volume, expressed as follows: In the example depicted in Figure 21-1, ejection fraction is 50%. Values between 50% and 65% are typical for resting dogs. As shown in Figure 21-1, left ventricular pressure is low at the beginning of ventricular systole, but the powerful contraction of the ventricular muscle causes the ventricular pressure to increase rapidly. The increase in left ventricular pressure causes a momentary backflow of blood from the left ventricle to the left atrium, which closes the left atrioventricular (AV) valve (the mitral valve). Blood is not immediately ejected from the left ventricle into the aorta at the beginning of systole, because the aortic valve remains closed until the left ventricular pressure exceeds the aortic pressure. Therefore, ventricular volume remains unchanged during this first phase of systole, which is aptly named isovolumetric contraction. When left ventricular pressure does fall below left atrial pressure, the mitral valve is pushed open, as blood begins to flow from the atrium into the ventricle. First, there is a period of rapid ventricular filling, which is followed by a phase of reduced ventricular filling (diastasis). Diastasis persists until the sinoatrial node cells initiate an atrial action potential and atrial contraction (atrial systole). In a resting dog, as depicted in Figure 21-1, ventricular volume is nearly at its end-diastolic level even before atrial systole. Typically, 80% to 90% of ventricular filling occurs before atrial systole. Atrial systole simply “tops up” the almost-full ventricles. An important clinical consequence of this fact is that the ventricles in a resting animal can pump a nearly normal stroke volume even in the absence of properly timed atrial contractions (e.g., during atrial fibrillation). During exercise, however, atrial contractions make a relatively greater contribution to ventricular filling because the rapid heart rate in exercise leaves a shorter time for diastolic filling. Therefore, animals with atrial fibrillation typically exhibit exercise intolerance. Ventricular filling also becomes more dependent on atrial systole in patients with certain valve defects, such as narrowing of the mitral valve (mitral stenosis). The preceding six paragraphs discussed pressure changes in the left atrium, left ventricle, and aorta. However, all the events of the cardiac cycle also take place on the right side of the heart. Therefore, all the statements made about the left side of the heart also hold true for the right side of the heart; simply substitute “pulmonary artery” for “aorta,” “pulmonic valve” for “aortic valve,” and “tricuspid valve” for “mitral valve.” As indicated in Figure 21-1, the ventricular volumes are similar for the left and right sides, and so are the blood flow rates. The pressures, however, differ greatly on the two sides. Systolic (peak) pressure in the right ventricle and pulmonary artery is only about 20 mm Hg, whereas systolic pressure on the left side of the heart reaches 120 mm Hg. This explains why there are different scales on the pressure axes in Figure 21-1 for the left and right sides of the heart. The timing of the two major heart sounds is also shown in Figure 21-1 (bottom). The first heart sound (S1) is associated with the closure of the AV valves (the mitral and tricuspid valves). The actual closure of the valves does not make this sound; the valve leaflets are so light and thin that their closing would be almost silent. However, there is a momentary backflow of blood from the ventricles to the atria at the beginning of ventricular systole. When this backflow of blood is brought to a sudden stop against the closing valves, brief vibrations are created in the blood and in the cardiac walls. These vibrations create the heart sound. All the events diagrammed in Figure 21-1 occur during each heartbeat, and each heartbeat results in the ejection of one stroke volume of blood into the pulmonary artery and aorta. The number of heartbeats per minute is called the heart rate. Therefore, cardiac output (the total volume of blood pumped by each ventricle in 1 minute) is expressed as follows: This relationship emphasizes that cardiac output can be increased only if stroke volume increases, heart rate increases, or both increase. Therefore, to understand how the body controls cardiac output, you must understand how the body controls stroke volume and heart rate. Figure 21-2 summarizes the factors that affect stroke volume and heart rate. These factors are described in detail in the following three sections. Stroke volume equals end-diastolic volume minus end-systolic volume. Therefore, as shown in Figure 21-2, stroke volume can be increased only by increasing end-diastolic volume (i.e., filling the ventricles fuller during diastole) or by decreasing end-systolic volume (i.e., emptying the ventricles more completely during systole), or both. The effect of increasing end-diastolic ventricular volume (EDV) on stroke volume is plotted in Figure 21-3, A. The detailed physiological mechanisms underlying this relationship are complex. Basically, however, greater ventricular filling during diastole places the ventricular muscle fibers in a more favorable geometry for the ejection of blood during the next systole. Also, stretching the ventricular muscle fibers during diastole causes a greater amount of calcium (Ca2+) to be released from the sarcoplasmic reticulum during the subsequent systolic contraction, and this enhances the force of contraction. Resting conditions in a normal animal are somewhere around the middle of this ventricular function curve. Therefore, increases or decreases from normal ventricular end-diastolic volume result in approximately proportional increases or decreases in stroke volume. Ventricular preload is the pressure within a ventricle during diastolic filling. Because ventricular pressure changes throughout filling (see Figure 21-1), the value of ventricular pressure at the end of diastole is usually accepted as a singular measure of preload. Normal values of preload (end-diastolic ventricular pressure) are about 5 mm Hg for the left ventricle and 3 mm Hg for the right ventricle. In a normal heart, ventricular pressure at the end of diastole is essentially equal to atrial pressure because the AV valves are open widely during late diastole. Also, because there are no valves between the veins and the atria, the atrial pressure is almost identical to the pressure within the nearby veins. Thus, pulmonary venous pressure, left atrial pressure, and left ventricular end-diastolic pressure are all essentially equivalent measures of left ventricular preload. Similarly, right ventricular end-diastolic pressure, right atrial pressure, and vena caval pressure are all essentially equivalent measures of right ventricular preload. In the clinic, right ventricular preload is measured by introducing a catheter into a peripheral vein (e.g., the jugular vein) and advancing it into the cranial vena cava (precava) or right atrium. Such a catheter is called a central venous catheter, and the pressure measured at its tip is called central venous pressure. Left ventricular preload is more difficult to measure clinically because there is no easy way to place a catheter tip into the left atrium or pulmonary veins. Figure 21-3, B, shows that increases in preload are associated with increases in end-diastolic ventricular volume. The graph depicts a left ventricle that has a natural volume of 30 mL in a relaxed, nonpressurized state (i.e., when the preload equals 0 mm Hg). Increases in preload distend and fill the ventricle. A preload of 5 mm Hg brings about the normal left ventricular end-diastolic volume of 60 mL. However, ventricular tissue reaches its elastic limit when the ventricular volume approaches 90 mL. Further increases in the preload do not cause much additional ventricular filling. Increases in ventricular preload cause increases in end-diastolic volume (see Figure 21-3, B), and increases in end-diastolic volume cause increases in stroke volume (see Figure 21-3, A). Therefore, it follows that increases in preload cause increases in stroke volume (see Figure 21-3, C). Each of these relationships reaches an upper limit. Several factors are involved, but the main one (already mentioned) is that the ventricular walls become stretched to their elastic limit at high levels of end-diastolic ventricular volume. In a resting dog the normal values of ventricular preload, end-diastolic volume, and stroke volume are about midway between their minimum and maximum values (see Figure 21-3). Therefore a decrease below normal in preload will cause a decrease in both end-diastolic ventricular volume and stroke volume. This happens, for example, in response to hemorrhage (see Chapter 26). The sequence just described has a potential for developing into a vicious circle, with runaway increases in stroke volume. Other control mechanisms prevent this from happening, as discussed in Chapter 25. The point here is that the Starling mechanism keeps the stroke volumes of the left and right ventricles balanced. If this equality were not maintained (and one ventricle pumped more blood than the other for several minutes), a large part of the body’s blood volume would accumulate either in the lungs or in the systemic circulation. Ventricular compliance therefore corresponds to the slope of a ventricular volume versus pressure curve, such as the one shown in Figure 21-3, B. This figure illustrates that a normal ventricle is quite compliant over the range of ventricular volumes up to and including the normal end-diastolic ventricular volume. Within this range, small changes in preload result in substantial changes in end-diastolic ventricular volume. At preloads higher than about 10 mm Hg, however, the ventricle becomes less compliant (stiffer). Inelastic connective tissue in the ventricular walls prevents increases in ventricular volume above about 90 mL. Myocardial ischemia, certain cardiac diseases, or mere advancing age can cause the ventricular walls to become stiff and noncompliant even at normal preloads. Figure 21-4 shows a comparison of volume versus pressure curves for a normal ventricle and for a noncompliant ventricle. In the noncompliant ventricle, there is a smaller increase in ventricular volume for any given increase in ventricular preload. As a consequence, a larger-than-normal preload is needed to obtain a normal end-diastolic ventricular volume and a normal stroke volume. An elevated preload necessitates elevated atrial and venous pressure, which leads to edema (detailed in Chapters 23 and 26). Thus, stiffening of the left ventricle leads to elevated pressure in pulmonary veins and pulmonary edema; stiffening of the right ventricle leads to elevated pressure in the systemic veins and systemic edema. Figure 21-2 (left side) provides a useful summary of the preceding discussion. End-diastolic ventricular volume is determined by ventricular preload, ventricular compliance, and diastolic filling time. An elevated preload increases ventricular filling. Decreased ventricular compliance or decreased diastolic filling time can limit ventricular filling. Contractility refers to the pumping ability of a ventricle. With increased contractility, there is a more complete emptying of the ventricle during systole and therefore a decreased end-systolic volume (see Figure 21-2, middle). An increase in contractility brings about an increase in stroke volume without requiring an increase in end-diastolic volume. Figure 21-5 shows graphically that increased contractility brings about an increased stroke volume for any given end-diastolic volume. Sympathetic nerve activity increases ventricular contractility through the action of the neurotransmitter norepinephrine, which activates β-adrenergic receptors on ventricular muscle cells. As discussed in Chapter 19, activation of β-adrenergic receptors leads to an increased influx of extracellular Ca2+ into cardiac cells during an action potential (and to several other effects); the overall result is that cardiac contractions are stronger, quicker to develop, and shorter. Epinephrine and norepinephrine released from the adrenal medulla and circulating in the blood can likewise activate β-adrenergic receptors and increase contractility, as can β-adrenergic agonist drugs (e.g., epinephrine, isoproterenol). The cardiac glycosides (e.g., digitalis) are another class of drugs that increases cardiac contractility, again by increasing the cytosolic Ca2+ concentration during an action potential. If cardiac contractility becomes depressed, there is less-than-normal ventricular emptying during systole. End-systolic volume increases, and stroke volume decreases, as shown in Figure 21-5. A decrease in sympathetic activity causes a decrease in cardiac contractility, as do β-adrenergic antagonist drugs, which block the β-adrenergic receptors on cardiac muscle cells. Propranolol and atenolol are the β-adrenergic antagonists used most often to decrease cardiac contractility. As with β-adrenergic antagonists, calcium channel–blocking drugs also decrease cardiac contractility by making less Ca2+ available for the activation of the contractile proteins. Barbiturates, opioids, and some general anesthetics depress cardiac contractility as well; this must be kept in mind, particularly when administering such drugs to a patient who may already have compromised cardiac function. A decrease in cardiac contractility causes a decrease in stroke volume and therefore cardiac output. Consequently, the patient’s blood pressure may fall to dangerously low levels.
The Heart as a Pump
Each Heartbeat Consists of Ventricular Systole and Ventricular Diastole


Cardiac Output Equals Heart Rate Multiplied by Stroke Volume

Increases in End-Diastolic Ventricular Volume Cause Increases in Stroke Volume
End-Diastolic Ventricular Volume Is Determined By Ventricular Preload, Ventricular Compliance, and Diastolic Filling Time

Increases in Ventricular Contractility Cause Decreases in Ventricular End-Systolic Volume
![]()
Stay updated, free articles. Join our Telegram channel

Full access? Get Clinical Tree


