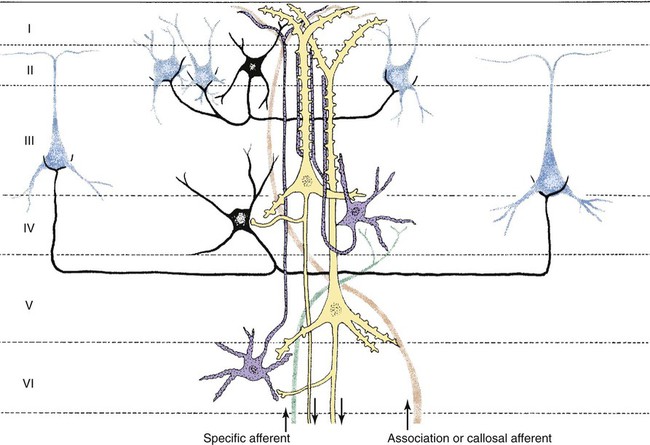
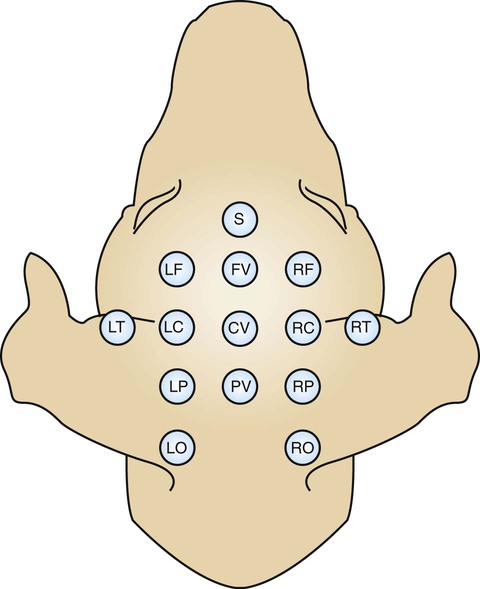
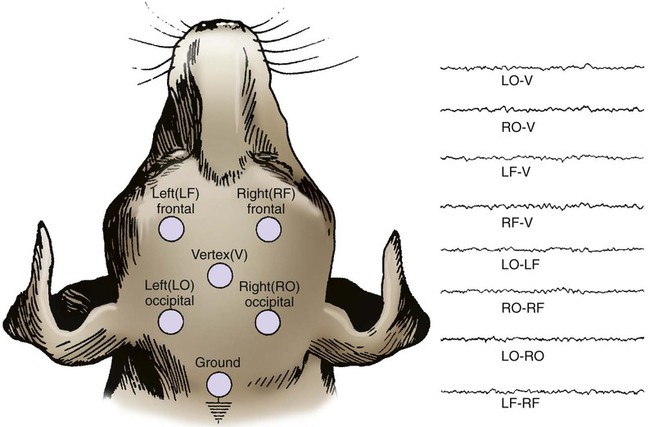
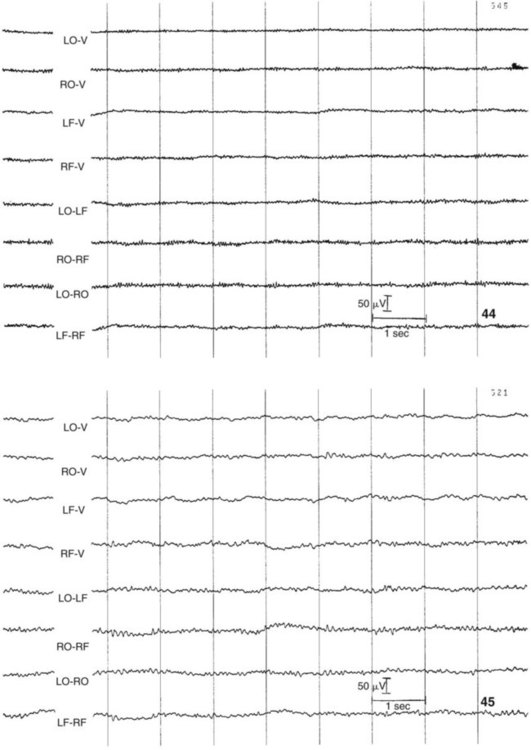
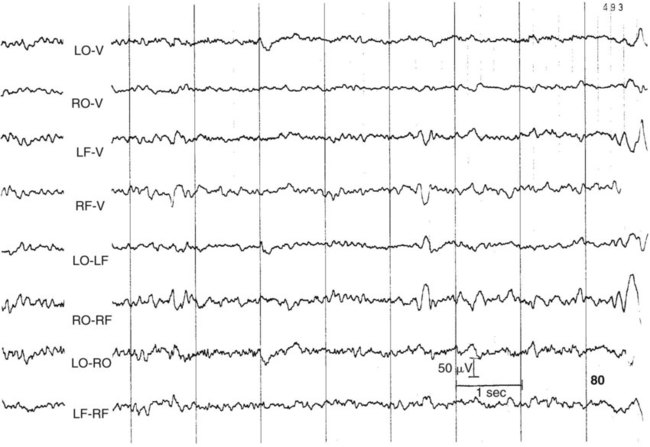
1. All areas of the cerebral cortex share common histological features. 2. The electroencephalogram is a common clinical tool. 3. The collective behavior of cortical neurons can be studied noninvasively through the use of macroelectrodes on the scalp. 4. Stimulation of sensory pathways can be recorded as evoked potentials. Underlying these procedures is a theory called volume conduction. This theory describes the spread of ionic currents within the extracellular fluid from a group of neurons or muscle cells to more distant points in the body, such as the skin. These ionic currents can be measured from the skin. Their waveforms are characteristic of the tissues from which they arise. The best-known electrophysiological recording is the electrocardiogram from heart muscle (see Chapter 20). The electromyogram from skeletal muscle (see Chapter 6) and electroretinogram (see Chapter 14) are other examples. Different regions of the cerebral cortex have different functions. For example, the motor cortices (see Chapter 10) project to the brainstem and spinal cord to initiate skilled, learned, conscious movement. The occipital cortex processes visual information received from the retina of the eye (see Chapter 14). The temporal cortex processes similar information from the ear (see Chapter 17). Even though different cortical regions have different functions, they have an underlying histological similarity. Therefore, cortical synaptic processing of information shares common features across regions, but differences in the origin of input signals and the destination of output signals contribute significantly to functional differences among regions. However, cerebral cortical cells can also work collectively over vast regions of the brain in such normal states as sleep and wakefulness and in such disease states as coma and seizures. The cerebral cortex contains several different cell types, but most belong to two major classes: pyramidal cells and stellate cells (Figure 16-1). These cells are arranged in six layers (I-VI). The pyramidal cells, so named because their cell bodies are pyramid shaped, have dendrites projecting up toward the pial surface of the cortex, usually reaching and branching within layer I. These cells also have basal dendrites that extend horizontally from the cell body. Pyramidal cells are projection neurons, with their axons leaving their cortical region of origin and projecting to other parts of the central nervous system (CNS) or to a different region of cerebral cortex. Pyramidal cells are generally excitatory at their axon’s synapse. Stellate cells, so named because most have a starlike appearance, are local-circuit interneurons within the cortex and can be either excitatory or inhibitory. The majority of subcortical information arrives at the cortex through a massive input from the thalamic nuclei, most of which is targeted to layer IV. Input from some portions of the thalamus, as well as from other regions of the cerebral cortex, have a more diffuse termination across cortical layers. Information arriving from cortical afferents is processed by local cortical circuitry, and pyramidal cells then carry the processed information to other CNS regions. As with other regions of the brain, the cerebral cortex contains many more glial cells than neurons. Three types of glial cells are present in the cortex: astrocytes, oligodendrocytes, and microglia. They do not develop action potentials, but as noted in Chapter 3, they may indirectly monitor neuronal electrical activity and modulate the effectiveness of neural communication. Glia also take up excess potassium ions, neurotransmitter, and toxins from the extracellular space and play a role in immune function. In addition, they help guide the course of developing neurons, play a role in synapse formation, and stabilize the position of neurons, thus the origin of the term glia (“glue”). It has been known since the 1930s that a fluctuating electrical voltage reflecting brain activity could be recorded from macroelectrodes on the scalp (Figure 16-2). Such a recording is known as an electroencephalogram (EEG). The frequency of the waveform recorded varies inversely with its amplitude. Both frequency and amplitude change with changes in levels of arousal (Figure 16-3). An alert animal has a fairly high-frequency, fairly low-amplitude EEG, whereas a more relaxed animal has a slower-frequency, higher-amplitude EEG. A sleeping animal usually begins sleep by exhibiting a slow-wave, high-amplitude EEG. Paradoxically, there are periods of high-frequency, low-amplitude EEG during the sleep cycle. Four frequency ranges have been given names: alpha (8-13 Hz), beta (13-30 Hz), delta (0.5-4 Hz), and theta (4-7 Hz).
The Electroencephalogram and Sensory-Evoked Potentials
All Areas of the Cerebral Cortex Share Common Histological Features
The Electroencephalogram Is a Common Clinical Tool
< div class='tao-gold-member'>
![]()
Stay updated, free articles. Join our Telegram channel

Full access? Get Clinical Tree


The Electroencephalogram and Sensory-Evoked Potentials
Only gold members can continue reading. Log In or Register to continue
