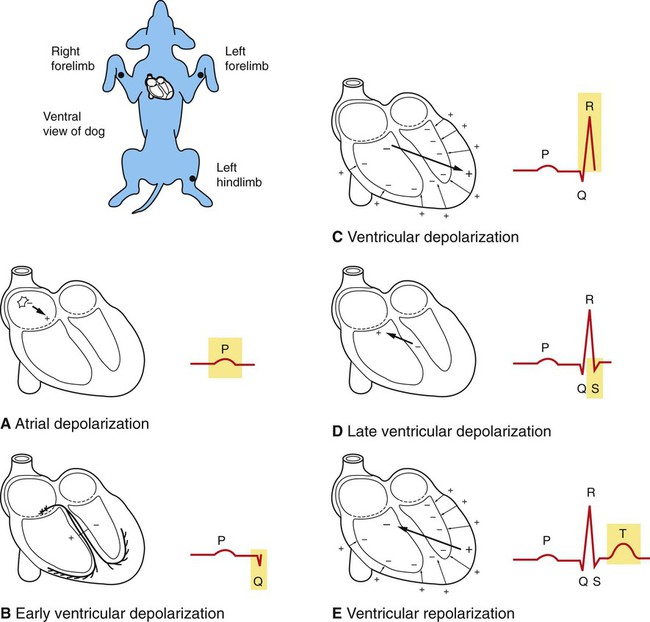
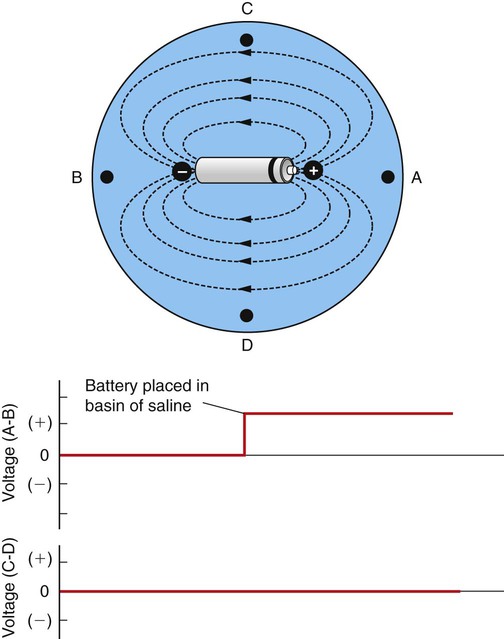
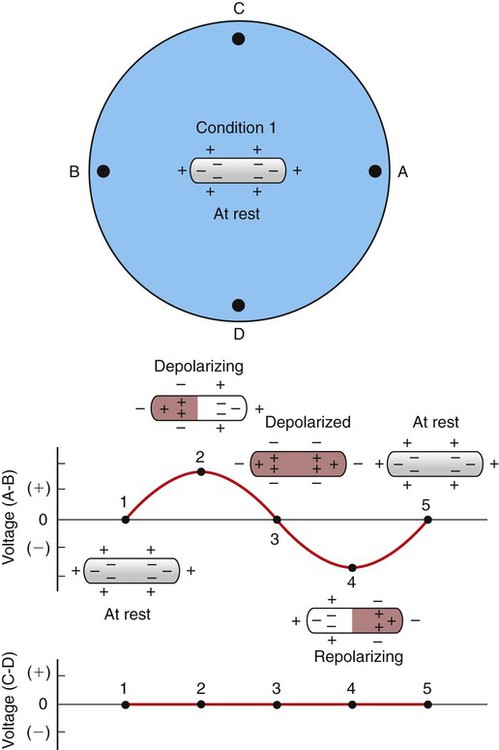
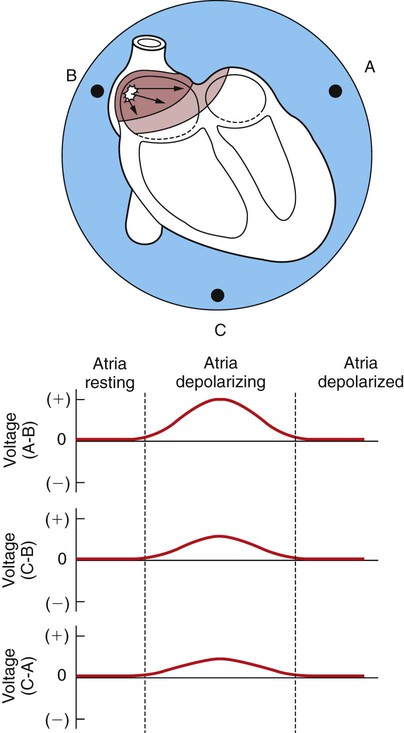
1. An electrocardiogram is simply a graph, made by a voltmeter that is equipped to plot voltage as a function of time. 2. Atrial depolarization, ventricular depolarization, and ventricular repolarization cause characteristic voltage deflections in the electrocardiogram. 3. The electrocardiogram reveals the timing of electrical events in the heart. 4. Six standardized electrocardiographic leads are used in veterinary medicine. 5. Abnormal voltages in the electrocardiogram are indicative of cardiac structural or electrical abnormalities. 6. Electrical dysfunctions in the heart cause abnormal patterns of electrocardiogram waves. 7. In large animals there is considerable variability in the polarity and size of the electrocardiogram waves. An intuitive understanding of the ECG begins with the concept of an electrical dipole in a conductive medium (Figure 20-1). A dipole is a pair of electrical charges (a positive charge and a negative charge) separated by a distance. A common flashlight battery is a good example of a dipole. A battery has an excess of positive charges at one end (the “+” end) and an excess of negative charges at its other end (the “−” end), and the two ends are separated by a distance. If this dipole is placed in a conductive medium (e.g., a bowl containing a solution of sodium chloride in water), ionic currents will flow through the solution. Positive ions (Na+) in the solution flow toward the negative end of the dipole, and negative ions (Cl−) flow toward the positive end. The flow of ions creates voltage differences within the salt solution. These voltage differences can be detected by placing the electrodes of a simple voltmeter at the perimeter of the salt solution. In Figure 20-1 an electrode placed at point A is closer (more exposed) to the positive end of the dipole, and an electrode at point B is closer (more exposed) to the negative end of the dipole. Therefore the voltage at point A will be positive in comparison with the voltage at point B. The voltmeter would detect a positive voltage difference between point A and point B. Using V as an abbreviation for voltage, we would summarize this condition by saying, “VA−B is positive.” Points C and D are equally near (equally exposed to) the positive and negative ends of the dipole, so no voltage difference would exist between electrodes placed at points C and D. We would say, “VC−D is zero.” In Figure 20-2 the battery in the NaCl solution has been replaced with an elongated strip of cardiac muscle. Again, a voltmeter is set up to detect any voltage differences that are created at point A compared with point B, and at point C compared with point D. The voltage differences (A−B and C−D) are plotted for five different conditions. In condition 1, all the cells in the strip of cardiac muscle are at a resting membrane potential; each cell is charged negatively on its inside and positively on its outside. Because cardiac cells are electrically interconnected by gap junctions, the strip of cardiac muscle behaves electrically as if it were one large cell (a functional syncytium). From the outside, the strip of cells looks like one large cell that is symmetrically charged positively around its perimeter. Therefore, no dipole exists. There would be no voltage difference between point A and point B (i.e., VA−B would be zero). There would also be no voltage difference between point C and point D (i.e., VC−D would also be zero). In condition 2, a pacemaker cell at the left end of the muscle strip has depolarized to threshold level and formed an action potential. The action potential is propagating from cell to cell, through the muscle strip, from left to right. In other words, the cells at the left end of the strip are depolarized and are at the plateau of their action potential, whereas the cells at the right end of the strip are still at a resting membrane potential. Under this condition, the outside of each depolarized cell is charged negatively, whereas the outside of each resting cell is still charged positively. The strip of muscle has created an electrical dipole, positive at its right end and negative at its left end. Therefore a positive voltage would exist at point A compared with point B. Note, however, that the voltage at point C compared with point D would still be zero, because neither of these points is closer to the positive end of the dipole. The graphs in Figure 20-2 summarize condition 2 by showing that VA−B is positive at this time, and VC−D is zero. Note that if the depolarization (in condition 2) had been spreading from right to left in the muscle strip (instead of from left to right), the voltage at point A compared with point B (VA−B) would have been negative during depolarization. Likewise, if the repolarization (in condition 4) had been spreading from right to left in the muscle strip, VA−B would have been positive during repolarization. Table 20-1 summarizes these relationships. TABLE 20-1 Sign (Polarity) of Voltages Created at Point A Compared with Point B (VA−B)* *When a strip of muscle within a conductive medium is depolarizing or repolarizing. The arrangement of muscle and electrodes is depicted in Figure 20-2. Figure 20-3 takes the intuitive model of the ECG one step further by picturing the entire heart (rather than a strip of cardiac muscle) in the bowl of saline. The graphs below the drawing show the voltage differences that would be detected by electrodes at the perimeter of the basin during atrial depolarization. When the cells in the sinoatrial (SA) node depolarize to threshold level, they initiate an action potential that propagates from cell to cell outward from the SA node. As indicated by the arrows in the top diagram of Figure 20-3, the action potential propagates (spreads) simultaneously downward in the right atrium and leftward (across the right atrium and into the left atrium). At the moment depicted in Figure 20-3 (top), the right atrial cells near the SA node are at the plateau of their action potential (i.e., negatively charged on their outside), whereas the cells in the left atrium and the cells in the inferior part of the right atrium are still at rest (i.e., positively charged on their outside). Therefore the depolarizing atria create an electrical dipole with its positive end angled downward and toward the left atrium. This dipole of atrial depolarization creates a voltage that is positive at point A compared with point B. Similarly, a voltage is created at point C that is positive compared with point B. Atrial depolarization also creates a positive voltage at point C compared to point A, although the reason for this is admittedly not evident from the two-dimensional view of the atria depicted in Figure 20-3. The voltage differences created during atrial depolarization are summarized by the graphs in Figure 20-3. The graphs also show that, once the atria are completely depolarized (with every atrial cell at the plateau of its action potential), the voltage differences between all points return to zero. In Figure 20-4 the heart is pictured in its normal position in the thorax of a dog. The extracellular fluids of the body contain NaCl (and other salts) in solution, so the body can be imagined as a substitute for the bowl of saline shown in the previous figures. The positions of the left forelimb, right forelimb, and left hind limb in Figure 20-4 correspond with points A, B, and C in Figure 20-3. Figure 20-4, A, shows that, while atrial depolarization is in progress at the beginning of a heartbeat, there would be a positive voltage in the left forelimb compared with the right forelimb. This is simply a repetition of the idea illustrated in Figure 20-3, the left forelimb being equivalent to point A and the right forelimb equivalent to point B. The next voltage differences that are detectable at the body surface are those associated with the depolarization of the ventricles. The first part of ventricular depolarization usually involves a depolarization that spreads from left to right (i.e., dog’s left to dog’s right) across the interventricular septum, as shown in Figure 20-4, B. This first phase of ventricular depolarization usually causes a small voltage difference (Q wave) between the left forelimb and the right forelimb, with the left forelimb being slightly negative compared with the right. The next event in ventricular depolarization usually causes a large, positive voltage (R wave) at the left forelimb compared with the right, as depicted in Figure 20-4, C. To understand why this R wave is large and positive, recall that during ventricular depolarization, the left and right bundle branches conduct the spreading action potential to the ventricular apex. From there, Purkinje fibers carry the action potential rapidly up the inside walls of both ventricles. From there, the depolarization spreads from cell to cell, outward through the walls of both ventricles, as pictured by the small arrows in Figure 20-4, C. This outward-spreading action potential creates dipoles in each region of the ventricular wall. Therefore, each small arrow in Figure 20-4, C, can be considered a dipole, with its positive end pointing toward the outside wall of the ventricle (because the inside surfaces of each ventricle depolarize before the outside surface). The net electrical effect of depolarizations spreading outward through the walls of both ventricles is a large electrical dipole pointed diagonally downward (caudad) and toward the dog’s left. This net dipole is depicted by the bold arrow in Figure 20-4, C. The net dipole points toward the left for two reasons. First, the cardiac axis is tilted toward the left (i.e., the normal orientation of the heart is with the ventricular apex angled toward the left wall of the thorax). Second, the left ventricle is much more massive than the right ventricle, so the dipoles created by depolarizations spreading outward in the massive wall of the left ventricle dominate electrically over the dipoles created by depolarizations spreading outward in the thinner wall of the right ventricle. The net result is a large, positive voltage (R wave) at the left forelimb compared with the right. The R wave is the predominant feature of a normal ECG. Abnormalities in the magnitude or polarity of the R wave have great diagnostic significance, as explained later. As the depolarizations finish spreading outward through the walls of both ventricles, the voltage in the left forelimb compared with the right forelimb returns to zero and then often becomes slightly negative for a few milliseconds (as pictured in Figure 20-4, D). The physical basis of this small, negative S wave is obscure. After the S wave, the voltage in the left forelimb compared with the right forelimb returns to zero and stays there for a time, because all the cells throughout both ventricles are uniformly at the plateau of their action potential; no dipole exists. Figure 20-4, E, shows that repolarization of the ventricular muscle causes a voltage deflection in the ECG called the T wave. Whereas the wave of depolarization spreads outward through the walls of both ventricles, the pattern of repolarization is not as predictable. Figure 20-4, E, illustrates one common pattern, in which the repolarization spreads inward through the walls of both ventricles; that is, the outside surface of the ventricles was the last ventricular tissue to depolarize but the first to repolarize. The inward-going repolarization creates dipoles, as depicted by the small arrows in Figure 20-4, E, with their negative end pointed toward the inside surface of both ventricles. The net dipole during this repolarization has its negative end pointed upward (craniad) and toward the dog’s right, as depicted by the bold arrow in Figure 20-4, E. This net dipole creates a positive voltage in the left forelimb compared with the right forelimb (T wave). The net dipole in Figure 20-4, E, points toward the dog’s right, simply because the left ventricular wall is so much more massive than the right ventricular wall. That is, the repolarization proceeding from outside to inside in the massive walls of the left ventricle creates larger voltages (stronger dipoles) than the repolarization proceeding from outside to inside in the thinner walls of the right ventricle.
The Electrocardiogram
An Electrocardiogram Is Simply a Graph, Made By a Voltmeter That Is Equipped to Plot Voltage as a Function of Time
Depolarization
Repolarization
Approaching A
+
−
Going away from A
−
+
Atrial Depolarization, Ventricular Depolarization, and Ventricular Repolarization Cause Characteristic Voltage Deflections in the Electrocardiogram
![]()
Stay updated, free articles. Join our Telegram channel

Full access? Get Clinical Tree


