Fig. 1.
VM tumor cells express extensive brain invasion. The VM-M2 and VM-M3 tumors are diffusely invasive into the neural parenchyma showing multiple tumor foci in the hippocampal region of the brain well in advance of the main tumor mass. The VM-M2 tumor cells invade through the hippocampal CA2 region and overlying cerebral cortex and the VM-M3 tumor cells invade as streams through the cerebral cortex (arrowhead). Despite having independent origins, the invasive properties of the VM-M2 and VM-M3 cells are similar (18). In contrast to the invasive VM-M2 and the VM-M3 tumors, the VM-NM1 tumor is noninvasive and forms a sharp boundary between the main tumor mass and the neural parenchyma. No tumor foci are seen in advance of the main tumor mass. Also, no perivascular pseudorosettes occur in brains containing the NM1 tumor (18). T tumor, CA1-3 (hippocampal regions). Reprinted with permission from (18).
We transduced VM-M3 cells with a lentivirus vector containing the firefly luciferase gene under control of the cytomegalovirus promoter (VM-M3/Fluc) (18). The lentivirus construct was obtained as a gift from Miguel Sena-Esteves, U. Massachusetts Medical School. We used the luciferase labeled VM-M3 tumor and monitored tumor growth noninvasively over time (Fig. 2). The bioluminescent signal could be evaluated both qualitatively and quantitatively during tumor progression (Fig. 2a, b).
Fig. 2.
Growth of the VM-M3/Fluc tumor with bioluminescence imaging. (a) VM-M3/Fluc tumor fragments were implanted as we previously described (41). Cranial images were taken over a period of 15 days (representative mouse shown). (b) Bioluminescence from the whole mouse was quantified and plotted on a linear scale. All values are expressed as the mean of 6 independent samples ± SEM. Bioluminescence, above the lower limit of the imaging system (approximately 1 × 10 3 photons/s), could be detected as early as day 6. Reprinted with permission from (41).
To quantitate the level of tumor invasion, we removed the brains at the end of the study and imaged ex vivo (41). We sectioned the brains through the midline and imaged each brain half separately. As shown in Fig. 3a, bioluminescence was detected in both the ipsilateral and the contralateral hemispheres. The level of invasion into the contralateral hemisphere was also measured. In addition, histology was used to confirm the presence of invading tumor cells in both the ipsilateral and contralateral hemispheres (Fig. 3b). We also were able to quantitatively and qualitatively analyze distal spread of VM-M3/Fluc cells to the brain stem and cerebellum (Fig. 4). Viewed collectively, these findings indicate that the VM-M3/Fluc is an excellent in vivo brain invasion assay.
Fig. 3.
VM-M3 in vivo brain invasion assay. Small tissue fragments from the VM-M3/Fluc cells, containing an established microenvironment, were implanted into the right cerebral hemisphere of adult VM mice (3 months) according to our standard procedures (41, 58). Whole brains were removed 17 days post implantation and were dissected into ipsilateral and contralateral cerebral hemispheres. (a) Each hemisphere was imaged for bioluminescence (photons/s) ex vivo. Brain tissue was imaged with the Xenogen IVIS system. Data acquisition and analysis was performed with Living Image®software (Xenogen). Bioluminescence from each brain half was quantified and plotted on a log scale. Bioluminescence in the contralateral cerebral hemisphere is indicative of tumor spread. (b) Histological analysis was used to confirm the presence of invasive tumor cells in the contralateral hemisphere. The tumor cells spread to the contralateral hemisphere using the corpus callosum and pial membranes. Invasive tumor cells (arrows) are shown in the neural parenchyma of the ipsilateral and the contralateral hemispheres. Similar results are obtained if cultured VM-M3 cells are implanted instead of tissue fragments, but time to invasion is more for cells than for fragments (41).
Fig. 4.
Quantitative and qualitative analysis of distal spread of VM-M3/Fluc cells to the brain stem and cerebellum. Removed brains were sectioned through the midline and were further dissected into cerebellum and brain stem. (a) Bioluminescence was quantified and plotted on a log scale. All values are expressed as the mean ± SEM of 10 independent samples. (b) Histological analysis (H&E) was used to validate the presence of tumor cells as described (41). Top panel images are shown at ×50. The scale bar represents 250 μm. The black boxes from the top panel images are shown in higher power in the bottom panel. Bottom panel images are shown at ×200. Arrows identify subpial tumor cell spread in the cerebellum and tumor cell invasion in the brain stem. The dashed line demarcates the ipsilateral from the contralateral side of brain stem (41).
6 The VM-M3 GBM Cells Invade the Brain Using Secondary Structures of Scherer
We found that the VM-M3 brain tumor cells migrated through the CNS using the Secondary Structures of Scherer (Fig. 5). Besides H&E staining, we showed that the VM-M3 cells invading through the Scherer structures also express the Ki-67 marker of proliferation (41). To our knowledge, the VM-M3 cells are the only mouse GBM cells that invade the CNS using the Secondary Structures of Scherer.
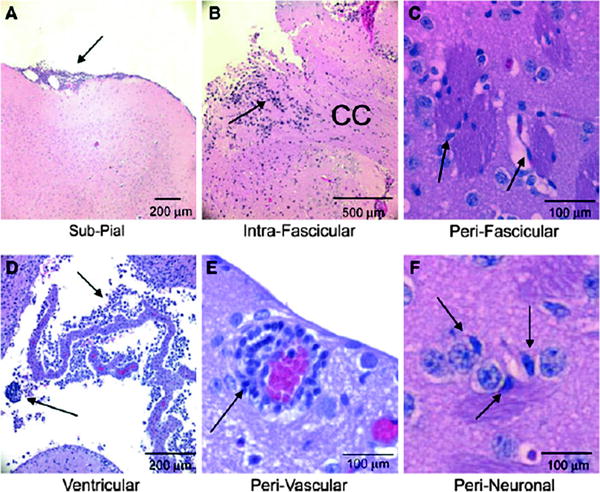
Fig. 5.
Migratory routes of the VM-M3/Fluc brain tumor cells. VM-M3/Fluc tumor fragments or cells were implanted as described. Histological analysis (H&E) was used to validate the presence of tumor cells (41). The VM-M3/Fluc tumor cells are shown invading using the Secondary Structures of Scherer including the pial surface (arrow, a), within the corpus callosum (CC, arrow, b), along myelinated axons crossing through the striatum (arrow, c), through the ventricular system (arrows, d), around the blood vessels (arrow, e), and around neurons (arrow, f). Images are shown at ×100 (a), ×50 (b), ×400 (c), ×200 (d), and ×400 (e, f). Arrows identify regions containing tumor cells. Reprinted with permission from (41).
7 The VM GBM Cells Show Systemic and Brain Metastasis When Implanted Subcutaneously
Human GBM cells can show systemic metastasis if the cells gain access to extracranial sites (discussed above). We found that the VM-M2 and VM-M3 cells were highly metastatic if the cells were inoculated subcutaneously in the flank of the syngeneic VM mouse host (18). The primary metastatic sites were lung, liver, kidney, spleen, and brain (Fig. 6). We also found that the VM-M2 and VM-M3 cells metastasized to bone marrow. Diffuse bone marrow metastasis has been reported in some GBM patients (59, 60). The VM-M2 and VM-M3 brain tumors are the only rodent models that manifest systemic metastatic behavior seen in human GBM. We suggest that diffuse brain invasion involving Scherer’s secondary structures and systemic metastasis can be used identify those brain tumor models that best represent the true nature of human GBM.
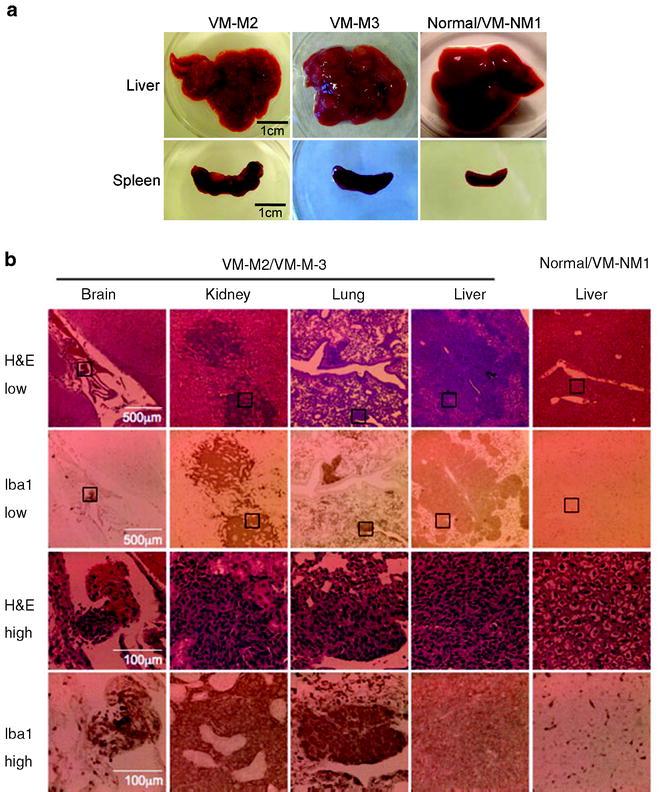
Fig. 6.
VM-M2 and VM-M3 tumors show systemic metastasis. Appearance of gross lesions (a), and micrometastatic lesions (b) from mice bearing VM tumors. H&E and Iba-1 staining (microglial marker) revealed numerous micrometastatic lesions in the kidney, lung, brain meninges, and liver in mice bearing the VM-M3 tumor (b). The black boxes in the lower power images (×100) in the top 2 rows are shown at higher power (×400) in the bottom 2 rows. The distribution, morphology, and staining of the micrometastatic lesions in mice bearing the VM-M3 appeared the same as that of the mice bearing the VM-M2 tumor (not shown). At least three independent mice were analyzed for each tumor. Reprinted with permission from (18).
8 Calorie Restriction Reduces Brain Invasion of VM-M3 GBM Cells
Calorie restriction (CR) involves under feeding and has long been known to inhibit tumor growth (61, 62). CR lowers body weight and blood glucose levels while elevating circulating levels of ketone bodies (β-hydroxybutyrate and acetoacetate) (62, 63). Brain tumor cells are unable to metabolize ketone bodies for energy under low glucose and glutamine conditions (8, 64–66). CR targets angiogenesis, inflammation, and signaling through the IGF-1, PI3K, AKT, Hif-1a pathways (47, 62, 67, 68). Hence, CR targets tumor growth through multiple signaling pathways.
We also showed that CR inhibits invasion of the VM-M3 glioblastoma. As seen in Fig. 7, CR reduced the growth and local invasion of the VM-M3 primary tumor. Compared to the diffuse, ill-defined border of the VM-M3 tumor observed in the unrestricted control mice, the tumor grown in the CR mice appeared denser with a more defined border, indicative of reduced invasion. In addition to inhibiting local invasion, CR also reduced the distal invasion of tumor cells from the implanted ipsilateral cerebral hemisphere into the contralateral hemisphere (Fig. 8).
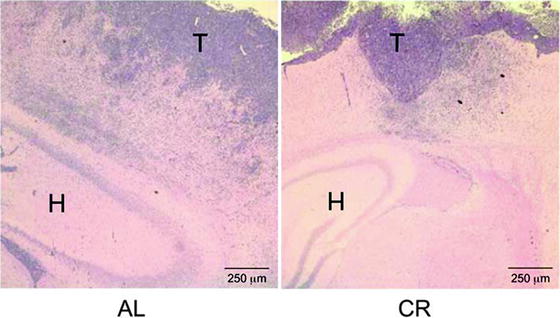
Fig. 7.
Calorie restriction reduces diffuse brain invasion of VM-M3 GBM cells. VM-M3/Fluc tumor fragments were implanted into the cerebral cortex, were fixed, and then stained with hematoxylin and eosin (H & E) as described (69). Images are shown at 50× (T tumor, H Hippocampus). Tumor cell invasion through the neural parenchyma (dark blue cells) is less in the CR-fed mice than in the ad libitum AL-fed mice. The border between tumor tissue and normal brain tissue is more sharply defined in the CR-fed mice than in the AL-fed mice. The results show that CR reduces VM-M3/Fluc tumor cell invasion. Reprinted with permission from ASN Neuro (69).
Fig. 8.
Influence of CR on bioluminescence in the contralateral hemisphere. VM-M3/Fluc tumor fragments were implanted as described (69). Each hemisphere was imaged for bioluminescence ex vivo as described (69). The bioluminescence from each hemisphere was added together to obtain a total bioluminescence value (photons/s) for each brain. Data for the contralateral hemisphere was then expressed as the percentage of the total brain photons/s. Values represent the means ± SEM for 9–10 mice per group. Representative bioluminescence images are shown. The asterisk indicates that the CR values differ significantly from the AL control group at P < 0.05 using the two-tailed Student’s t test. The results show that CR reduces interhemispheric invasion. Reprinted with permission from (69).
While invading tumor cells were identified in all regions of the contralateral hemisphere of the control ad libitum-fed (AL) mice, only subpial invasion was found in the contralateral hemisphere of the CR group (Fig. 9). These findings indicate that CR blocks VM-M3 invasion through Scherer’s secondary structures (69).
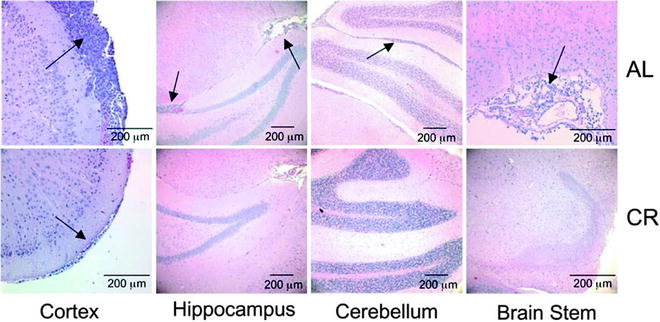
Fig. 9.
CR inhibits VM-M3 tumor cell invasion to the contralateral hemisphere. VM-M3/Fluc tumor fragments were implanted into the right cerebral hemisphere as described (69). Histological analysis (H&E) was used to validate the presence of tumor cells under AL (top) and CR (bottom) in cerebral cortex (200×), hippocampus (100×), cerebellum (100×), and brain stem (200×) of the contralateral hemisphere. Arrows indicate the presence of tumor cells. At least three samples were examined per group. Reprinted with permission from ASN Neuro (69).
We also found that the total percentage of Ki-67-stained VM-M3 cells within the primary tumor and the total number of blood vessels was also significantly lower in the CR-treated mice than in the mice fed AL, indicating that CR is also anti-proliferative and anti-angiogenic in this invasive tumor model (8, 69). These findings clearly indicate that calorie restriction alone can inhibit proliferation, as well as both local and distal invasion of the VM-M3 mouse GBM. We would also expect similar findings using restricted ketogenic diets. Indeed, previous studies showed that ketogenic diets, which lower glucose and elevate ketones, inhibit growth and invasion in children and an adult with malignant brain cancer including GBM (70, 71). Hence, the VM-M3 mouse GBM model can be a powerful preclinical tool for assessing translational benefit of new GBM therapies.
9 Conclusions
A new model of GBM is described in the VM mouse strain. The VM-M3 GBM model shows CNS growth patterns similar to those described in invasive malignant brain cancers. Like human GBM, the VM-M3 cells showed systemic metastasis when grown outside the brain. The model will be useful for preclinical evaluation of therapies that can target distal tumor cell invasion in the CNS.
Acknowledgments
This work was supported in part from NIH grants (HD-39722, NS- 1080 55195, and CA-102135), a grant from the American Institute of Cancer 1081 Research, and the Boston College Expense Fund.
References
1.
2.
Huysentruyt LC, Akgoc Z, Seyfried TN (2011) Hypothesis: are neoplastic macrophages/microglia present in glioblastoma multiforme? ASN Neuro. doi:10.1042/AN20110011
3.
Krex D, Klink B, Hartmann C, von Deimling A, Pietsch T, Simon M, Sabel M, Steinbach JP, Heese O, Reifenberger G, Weller M, Schackert G (2007) Long-term survival with glioblastoma multiforme. Brain 130:2596–2606PubMedCrossRef
Stay updated, free articles. Join our Telegram channel

Full access? Get Clinical Tree


