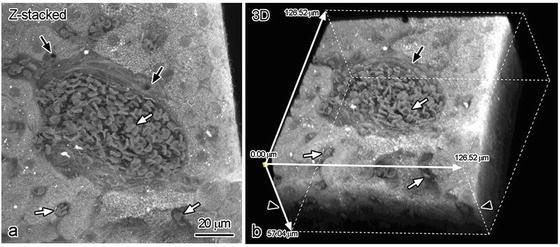
Fig. 6.1
Three-dimensional reconstruction of triple-fluorescence images obtained by confocal laser scanning microscopy with PAS staining (red), immunostaining for immunoglobulin kappa light chain (green), and TO-PR-O3 (blue) in fasting mouse livers. X/Z plane (white line b in a) was digitally cut for 3D-reconstructed image (b), and their X/Z plane view is shown in (c). (d): Higher magnified view of the boxed area in (a). (e): Two-dimensional (Z-stacked of 29 serial optical sections) view of the boxed area in (a). Black arrows: hepatic sinusoids , white arrows: bile canaliculi . Bar: 20 μm
6.3 3D Reconstruction Images of PAS Staining in 100 μm Paraffin Slices
It has known that the antibodies for immunostaining are able to penetrate into tissue sections around 10 μm because of their molecular sizes. To the contrary, dyes used for usual PAS staining and hematoxylin–eosin (HE) staining easily penetrate into deep areas of tissues. Therefore, we further tried to perform 3D reconstruction of 100 μm paraffin slices stained with PAS under the CLSM (Fig. 6.2). To obtain thicker paraffin slices, paraffin-embedded specimens were cut at 100 μm thickness using a cryostat machine at around −10 °C and mounted on MAS-coated glass slides. Such a low temperature enabled us to make thicker paraffin slices than usual. The 100-μm-thick slices could be treated by usual deparaffinization and dehydration . The 3D reconstruction was performed on 186 serial optical sections of fasting mouse liver tissues at intervals of 0.896 μm. Because each optical section overlaps the adjacent sections with half of its thickness, the total thickness was 81.4 μm (Fig. 6.2d, e). In mouse livers under the fasting condition, we identified a strongly PAS-positive hepatocyte near the portal vein (arrowheads in Fig. 6.2a, d, e) and some PAS-negative ones (arrows in Fig. 6.2a, d, e). In contrast, the intensity of erythrocyte autofluorescence was much weaker than that of PAS staining (P in Fig. 6.2), and the portal veins were hardly detected at areas of more than 20 μm in depth (P in Fig. 6.2b). Some PAS-stained hepatocytes were still detectable at areas of more than 30 μm in depth (Fig. 6.2c). By optically cutting X/Y/Z planes (Fig. 6.2e), interconnecting sinusoidal networks (white arrowheads in Fig. 6.2e) were detected in the 3D-reconstructed digital images.
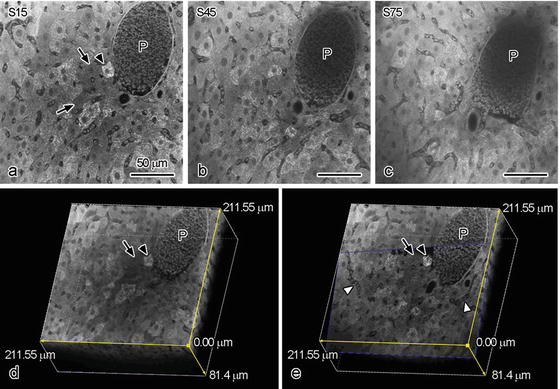
Fig. 6.2
Serial optical sections of the fasted mouse livers (a–c) and three-dimensional reconstruction of a 100 μm slice stained with PAS obtained by confocal laser scanning microscopy (CLSM) (d, e). With CLSM, serial 186 optical sections are obtained: the 15th (a: 6.16 μm in depth), 45th (b: 19.36 μm in depth), and 75th (c: 32.56 μm in depth) optical sections are shown as typical examples. (c): The X/Z planes were shown the three-dimensionally reconstructed images. (e): Optically cutting oblique digital plane. Bars: 50 μm
6.4 3D Reconstruction Images of Eosin Staining in 100-μm Paraffin Slices
Eosin dye commonly used for HE staining has been already known to emit yellow-red fluorescence signals [11, 12]. Under the CLSM, it is detectable by fluorescence wavelengths at 645–745 nm and excitation wavelength at 633 nm. The eosin dye stains cytoplasm, which enables us to obtain better construction of bile ducts and erythrocytes . 3D reconstruction was performed on 125 serial optical sections at intervals of 0.932 μm. Because each digital sectional image overlaps the adjacent sections with half of its thickness, the total thickness was 57.04 μm. By digital accumulation of Z-series optical sections (Fig. 6.3a), interlobular bile ducts were clearly detected (arrows in Fig. 6.3a). In a portal vein and sinusoids , erythrocytes were found to be shaped like biconcave disks (white arrows in Fig. 6.3a, b). The CLSM enabled us to demonstrate functional liver structures in vivo with eosin staining alone within 25 μm in depth from the cut tissue surface (arrowheads in Fig. 6.3b) by X/Z planes in the reconstructed images. Thus, it became possible to visualize 3D structure images of IVCT-prepared tissues of living mouse liver s with CLSM.