Fig. 15.1
Morphological features of mouse lungs. (a, c) Macroscopic images of normal mouse lungs under experimental expiration (Ex) and inspiration (In). (b, d) Light microscopic images with HE staining of the right cranial lobes. White arrows, alveolar septum. Double black arrowheads, alveolar capillaries filled with variously shaped erythrocytes . Asterisk, a cranial lobe of the right lung. H, heart; Bars, 500 μm in (a, c), 25 μm in (b, d)
15.3 Visualization of Blood Supply on Paraffin Sections
To visualize blood flow on paraffin sections, IVCT was immediately performed at 1 s (Fig. 15.2) after starting the continuous injection of QDs. Morphological findings with HE staining at 1 s show well-preserved lung tissue areas with little ice-crystal formation at a light microscopic level (Fig. 15.2a), and serial sections were also used for the QD analyses (Fig. 15.2b). To confirm microscopic structures without any staining in a fluorescence microscope, autofluorescence image s with UV excitation were very useful for normal lung tissues, as shown in blue in Fig. 15.2b. At the same time, another red fluorescent signal of QDs was clearly detected in some blood vessel s under the same UV excitation condition. Two types of large blood vessel s were discriminated with the QD red signal. Some large blood vessels filled with the red signal of QDs were alternately situated among other large blood vessels without QDs (Fig. 15.2b, c). The blood vessels with the red signal demonstrated lung arterioles in bronchiolar connective tissues because some QDs were considered to initially flow into arterioles from the right ventricle (Ar in Fig. 15.2b, c). In addition, other QDs were localized in parts of alveolar capillaries connected to arterioles (white arrows in Fig. 15.2a, b), indicating that these QD images show an instant cessation of blood flow from arterioles to venules via alveolar capillaries. Figure 15.2c traces all locations of arterioles and venules in a lung tissue section. Thus, blood flow directions and distributions of blood vessels, such as arterioles and venules, were widely traced. In three-dimensional network structures of alveolar capillaries using these specimens, alveolar capillaries intricately connected with each other, naturally flowing erythrocyte s , and segmented leukocytes were detected inside blood vessels, as shown in our original article [13].
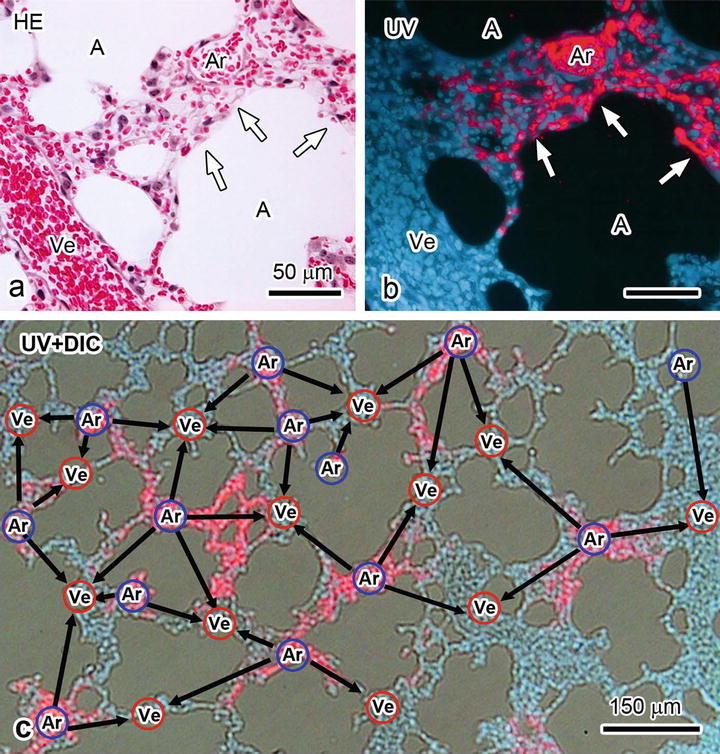
Fig. 15.2
Light micrographs of mouse lung tissues at 1 s after the QD injection , which are imaged by HE staining (HE; a), fluorescence with ultraviolet light (UV; b), and blood vessel arrangement, are depicted on the images that are merged with differential interference contrast image (UV + DIC; c). White arrows, alveolar capillaries filled with red fluorescent signals by QDs. Blue circle with Ar, arterioles . Red circle with Ve, venules . Black arrows, blood flow s traced from an arteriole to some venules via alveolar capillaries. A, air space. Bars, 150 μm in (c) and 50 μm in (a, b)
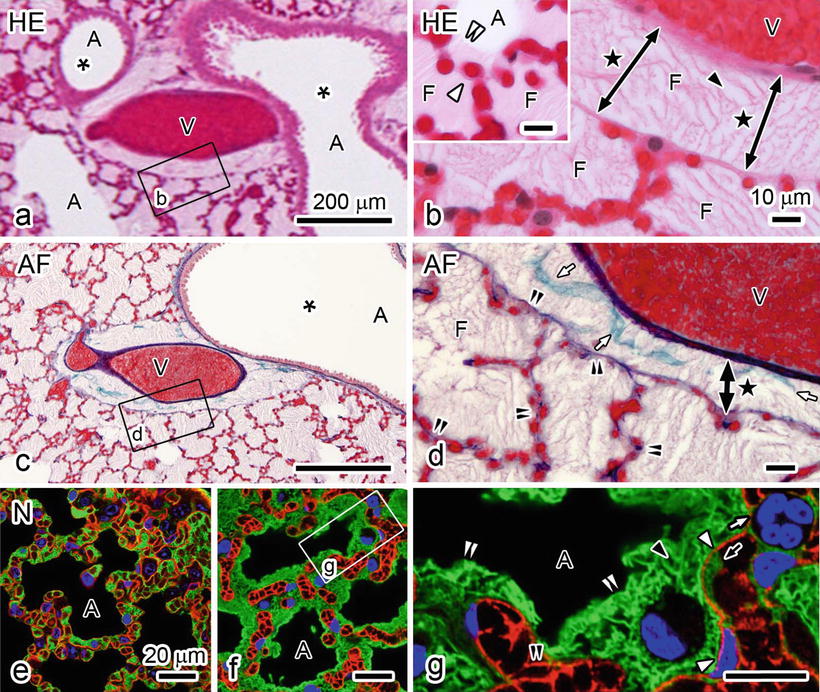
15.4 Visualization of Pulmonary Edema on Paraffin Sections
Morphological imaging of pulmonary edema was evaluated using IVCT for mouse lungs of the acute pulmonary hypertension model (Fig. 15.3). At 7 min after clipping an ascending aorta, varicosis due to blood congestion was visible at the lung surface by the naked eye, and respiratory movement of the lung was gradually decreased. By HE staining of the pulmonary hypertension lung tissues (Fig. 15.3a, b), erythrocytes were seen to be packed in all blood vessel s . Some luminal spaces, enclosed by alveolar septum including blood capillaries , were filled with slightly eosinophilic substances, which were supposedly serous exudate leaking from alveolar capillaries into alveolar spaces (Fig. 15.3a, b). Both eosin-positive and eosin-negative areas were seen in terminal bronchiole s (asterisk in Fig. 15.3a), alveolar ducts, or alveolar spaces of some areas (Fig. 15.3a, inset in b), and their border was clearly detected (double white arrowheads in inset in Fig. 15.3b). Because the freezing condition of lung tissues became worse in a distant area far from the frozen tissue surface than that in the area near visceral pleura, some ice crystal s were found, especially in eosin-positive substances (black arrowhead in Fig. 15.3b), which probably reflected the leaked fluid from blood vessels. In comparison with the leaked fluid (F in Fig. 15.3b), tiny ice crystals were seen in good freezing area (inset in Fig. 15.3b). In connective tissues near terminal bronchioles, the exudate was seen to separate tunica adventitia from large blood vessel s (double-headed arrows with black stars in Fig. 15.3b, d). Some collagen fibers were detected as green color with AF staining, which were discretely separated by exudate near terminal bronchioles (white arrows in Fig. 15.3d). To the contrary, elastic fiber s were stained as purple color with AF staining in alveolar septum, which were still continuing at light microscopic level (double arrowheads in Fig. 15.3d), indicating elasticity of alveolar septum under pulmonary edema condition. To confirm whether the slightly eosinophilic substances with HE staining in the alveolar lumen (Fig. 15.3a, b) were serous exudate leaked out through blood vessels, two different types of lungs under normal circulation (Fig. 15.3e) or acute pulmonary hypertension (Fig. 15.3f, g) condition were compared by immunostaining for aquaporin-1 (AQP-1 ) and albumin . AQP-1 was already reported to be expressed and localized along cell membranes of endothelial cell s in pulmonary blood vessels and erythrocytes [14–16]. In normal mouse lung tissues (Fig. 15.3e), bright contours of blood vessels were detected owing to strong immunostaining of AQP-1 along endothelial cells (red in Fig. 15.3e). In contrast, albumin immunostaining was mainly detected in blood vessels and slightly at interstitium of alveolar septum under normal blood circulation conditions (green in Fig. 15.3e). By the AQP-1 immunostaining, flowing erythrocyte membranes were slightly immunostained to contour their shapes (Fig. 15.3e), in addition to the endothelial cells. In mouse lung tissues with acute pulmonary hypertension (Fig. 15.3f, g), AQP-1 was also immunolocalized along cell membranes of endothelial cells and erythrocytes packed in alveolar capillaries (red in Fig. 15.3g). In contrast, immunostaining of albumin was clearly detected in the interstitial matrix outside the alveolar capillaries (green in Fig. 15.3g), but it was hardly detected in the alveolar capillaries because of much less space among tightly packed erythrocytes. Thus, because the leaked substances in alveolar lumens and interstitial matrices outside blood vessels consisted of much albumin, the slightly eosinophilic substances by HE staining, as shown in Fig. 15.3a, b, were determined to be mostly serous exudate derived from blood vessels under the experimental pulmonary edema.