Therapeutic Nutritional, Fluid, and Electrolyte Replacements
Learning Objectives
After studying this chapter, you should be able to
1. Define terms related to fluid, electrolyte, and selected therapeutic nutritional preparations.
2. Describe the distribution of water in the body.
3. Describe the composition of body and therapeutic fluids.
4. Define osmotic pressure and tonicity as they apply to fluids.
5. Discuss the basic principles of fluid therapy.
6. Describe fluid equipment and its use.
7. Categorize and provide examples of the fluids used in fluid therapy.
8. List and describe selected fluid additives.
9. List and describe selected oral electrolyte preparations.
10. List and describe selected parenteral vitamin–mineral products.
Key Terms
Buffer
Colloid
Dissociation
Electrolyte
Empirical
Hyperkalemia
Hypernatremia
Hypokalemia
Hyponatremia
Hypovolemia
Metabolic acidosis
Metabolic alkalosis
Oncotic pressure
Osmotic pressure
Solute
Total nutrient admixture
Transcellular fluid
Turgor
Introduction
Veterinary technicians often have an important role in fluid, electrolyte, and therapeutic nutritional therapy for patients. They administer parenteral or oral fluid or nutritional products and monitor patients’ responses under the direction of a veterinarian. Because the use of these products can be critically important to the outcome of a case, technicians should have a thorough knowledge of the products and their use.
Anatomy, Physiology, and Chemistry
Distribution of Body Water and Electrolytes
Measurements of total body water (TBW) have shown that water represents 50% to 70% of the total body weight in adult animals; 60% is often used as the average figure. As much as 80% of a neonatal animal’s body weight may be water, which is a factor that makes fluid loss in young animals potentially very serious. An increase in body fat decreases the amount of TBW and makes it important to estimate fluid needs on the basis of lean body mass to avoid overhydration.
TBW is distributed in several compartments within the body (Figure 15-1). Sixty percent of TBW is found within cells and is called intracellular fluid (ICF). ICF makes up 40% of total body weight. The other 40% of TBW is found outside the cells and is called extracellular fluid (ECF). ECF accounts for 20% of total body weight.
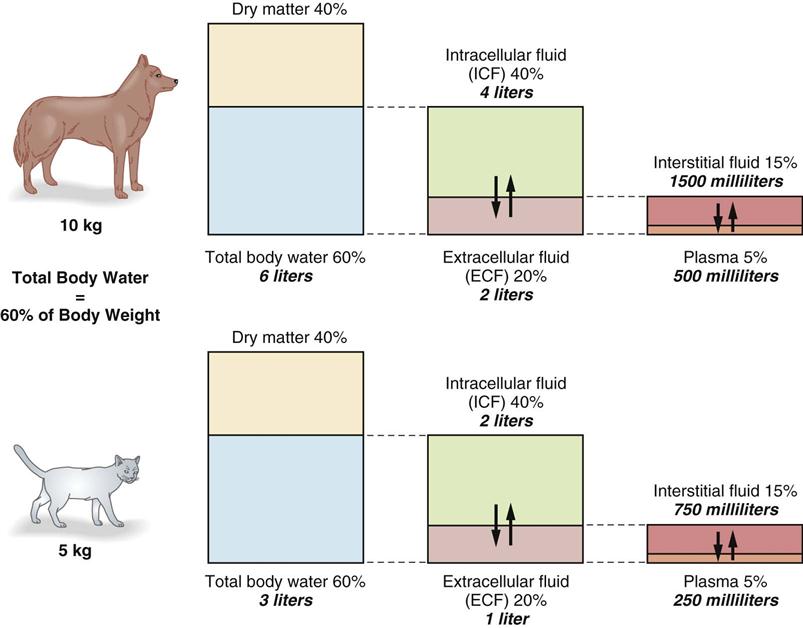
ECF (discounting the relatively small transcellular fluid component) distributes itself between the interstitial fluid (15% of body weight) and the intravascular fluid or plasma (5% of body weight). The intravascular fluid volume is estimated at 90 mL/kg for dogs and 45 mL/kg for cats.
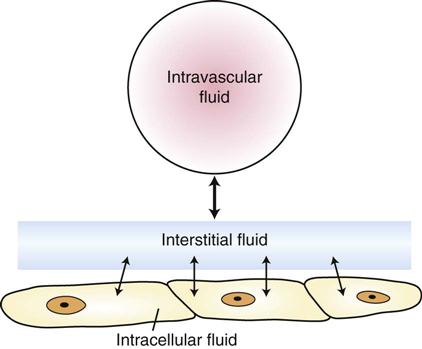
Body fluid compartments should be thought of as volumes of fluid and electrolytes in dynamic equilibrium, with fluids and electrolytes moving back and forth across semipermeable cell membranes. Changes in the quantity of fluid or electrolytes in one compartment usually result in changes in these quantities in other compartments. Fluids administered intravenously to an animal first enter the intravascular space of the ECF, move into the interstitial space, and then enter the ICF (Figure 15-2). In most cases, loss of fluid occurs first from the ECF and then from other compartments.
Composition of Body and Therapeutic Fluids
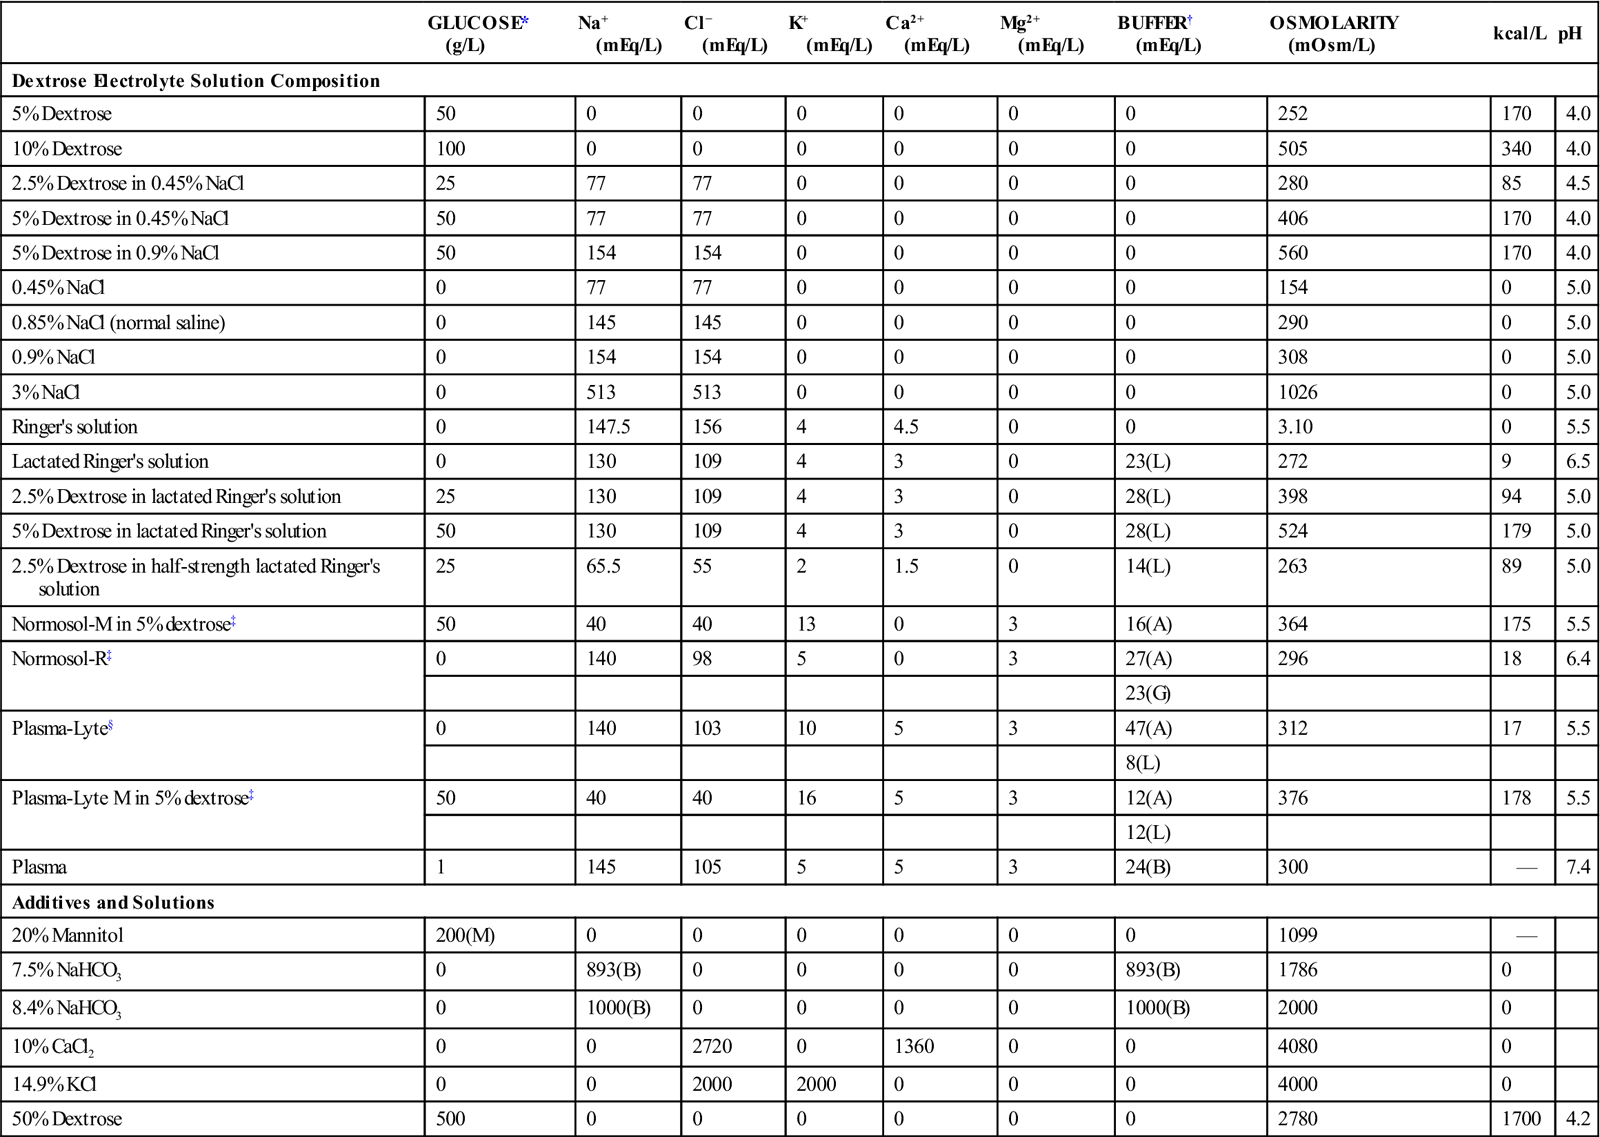
Body water contains an array of solutes that vary in quantity from compartment to compartment. A solute is a substance that dissolves in a solvent; this solvent is usually water in biologic systems. The molecules of substances called electrolytes break down (dissociate) into charged particles called ions. Electrolytes are positively charged (cations) or negatively charged (anions). The number of cations always equals the number of anions in healthy animals (Table 15-1). In the ECF, the most abundant cation is sodium, and the most abundant anions are chloride and bicarbonate. In the ICF, the major cations are potassium and magnesium, and the major anions are phosphates and proteins. Therapeutic fluids are described as balanced if they resemble ECF in composition and unbalanced if they do not. Lactated Ringer’s solution (LRS) is an example of a balanced solution, and saline is an example of an unbalanced solution. Table 15-2 lists the composition of some of the solutions used in fluid therapy.
TABLE 15-1
Composition of Plasma, Interstitial Fluid, and Intracellular Fluid
| ION | PLASMA (mEq/L) | INTERSTITIAL FLUID (mEq/L) | INTRACELLULAR FLUID (mEq/L) |
| Cations | |||
| Na+ | 142 | 145.1 | 12.0 |
| K+ | 4.3 | 4.4 | 140 |
| Ca2+ | 2.5 | 2.4 | 4.0 |
| Mg2+ | 1.1 | 1.1 | 34 |
| Total | 149.9 | 153.0 | 190 |
| Anions | |||
| Cl− | 104 | 117.4 | 4 |
| HCO3− | 24 | 27.1 | 12 |
| H2PO4 | 2 | 2.3 | 40 |
| Protein | 14 | none | 50 |
| Other | 5.9 | 6.2 | 84 |
| Total | 149.9 | 153.0 | 190 |
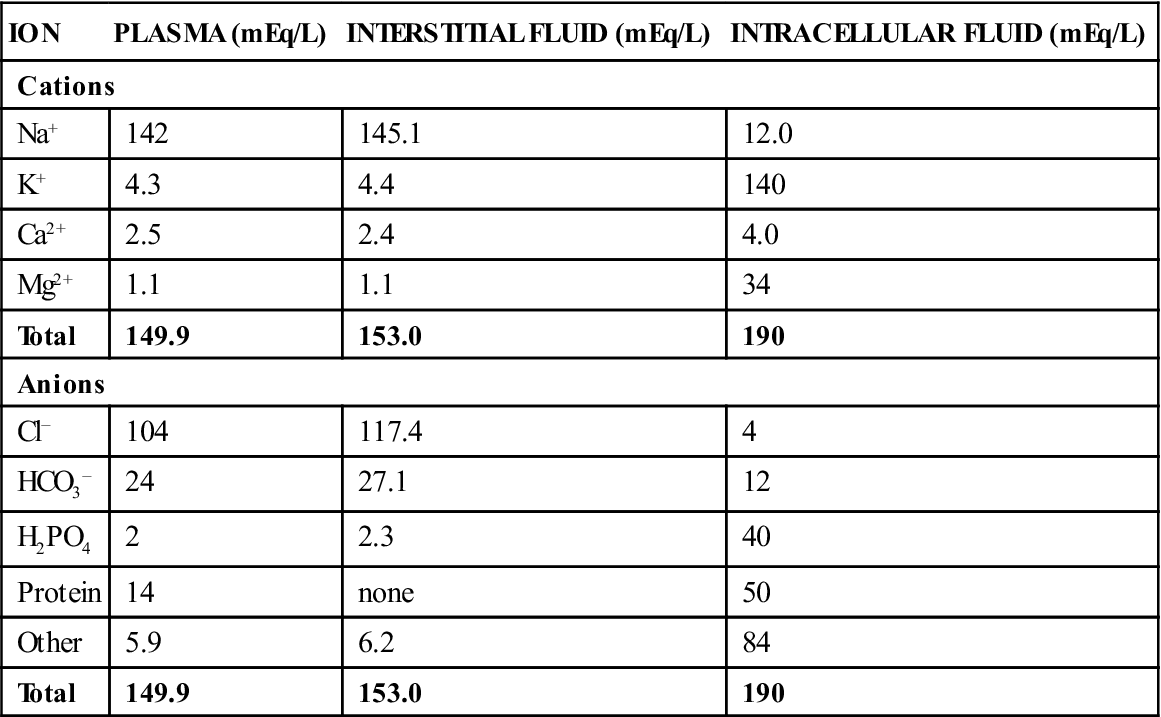
TABLE 15-2
Composition of Solutions Used in Fluid Therapy
| GLUCOSE* (g/L) | Na+ (mEq/L) | Cl− (mEq/L) | K+ (mEq/L) | Ca2+ (mEq/L) | Mg2+ (mEq/L) | BUFFER† (mEq/L) | OSMOLARITY (mOsm/L) | kcal/L | pH | |
| Dextrose Electrolyte Solution Composition | ||||||||||
| 5% Dextrose | 50 | 0 | 0 | 0 | 0 | 0 | 0 | 252 | 170 | 4.0 |
| 10% Dextrose | 100 | 0 | 0 | 0 | 0 | 0 | 0 | 505 | 340 | 4.0 |
| 2.5% Dextrose in 0.45% NaCl | 25 | 77 | 77 | 0 | 0 | 0 | 0 | 280 | 85 | 4.5 |
| 5% Dextrose in 0.45% NaCl | 50 | 77 | 77 | 0 | 0 | 0 | 0 | 406 | 170 | 4.0 |
| 5% Dextrose in 0.9% NaCl | 50 | 154 | 154 | 0 | 0 | 0 | 0 | 560 | 170 | 4.0 |
| 0.45% NaCl | 0 | 77 | 77 | 0 | 0 | 0 | 0 | 154 | 0 | 5.0 |
| 0.85% NaCl (normal saline) | 0 | 145 | 145 | 0 | 0 | 0 | 0 | 290 | 0 | 5.0 |
| 0.9% NaCl | 0 | 154 | 154 | 0 | 0 | 0 | 0 | 308 | 0 | 5.0 |
| 3% NaCl | 0 | 513 | 513 | 0 | 0 | 0 | 0 | 1026 | 0 | 5.0 |
| Ringer’s solution | 0 | 147.5 | 156 | 4 | 4.5 | 0 | 0 | 3.10 | 0 | 5.5 |
| Lactated Ringer’s solution | 0 | 130 | 109 | 4 | 3 | 0 | 23(L) | 272 | 9 | 6.5 |
| 2.5% Dextrose in lactated Ringer’s solution | 25 | 130 | 109 | 4 | 3 | 0 | 28(L) | 398 | 94 | 5.0 |
| 5% Dextrose in lactated Ringer’s solution | 50 | 130 | 109 | 4 | 3 | 0 | 28(L) | 524 | 179 | 5.0 |
| 2.5% Dextrose in half-strength lactated Ringer’s solution | 25 | 65.5 | 55 | 2 | 1.5 | 0 | 14(L) | 263 | 89 | 5.0 |
| Normosol-M in 5% dextrose‡ | 50 | 40 | 40 | 13 | 0 | 3 | 16(A) | 364 | 175 | 5.5 |
| Normosol-R‡ | 0 | 140 | 98 | 5 | 0 | 3 | 27(A) | 296 | 18 | 6.4 |
| 23(G) | ||||||||||
| Plasma-Lyte§ | 0 | 140 | 103 | 10 | 5 | 3 | 47(A) | 312 | 17 | 5.5 |
| 8(L) | ||||||||||
| Plasma-Lyte M in 5% dextrose‡ | 50 | 40 | 40 | 16 | 5 | 3 | 12(A) | 376 | 178 | 5.5 |
| 12(L) | ||||||||||
| Plasma | 1 | 145 | 105 | 5 | 5 | 3 | 24(B) | 300 | — | 7.4 |
| Additives and Solutions | ||||||||||
| 20% Mannitol | 200(M) | 0 | 0 | 0 | 0 | 0 | 0 | 1099 | — | |
| 7.5% NaHCO3 | 0 | 893(B) | 0 | 0 | 0 | 0 | 893(B) | 1786 | 0 | |
| 8.4% NaHCO3 | 0 | 1000(B) | 0 | 0 | 0 | 0 | 1000(B) | 2000 | 0 | |
| 10% CaCl2 | 0 | 0 | 2720 | 0 | 1360 | 0 | 0 | 4080 | 0 | |
| 14.9% KCl | 0 | 0 | 2000 | 2000 | 0 | 0 | 0 | 4000 | 0 | |
| 50% Dextrose | 500 | 0 | 0 | 0 | 0 | 0 | 0 | 2780 | 1700 | 4.2 |
*All glucose, with one exception: M, mannitol.
†Buffers used: A, acetate; B, bicarbonate; G, gluconate; L, lactate.
From Chew DJ, DiBartola SP: Saunders manual of small animal nephrology and urology, Philadelphia, 1986, WB Saunders Co.
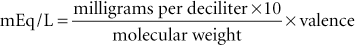
It is important for technicians to have a basic understanding of the way in which solute particles such as electrolytes are quantified in fluids. One of the oldest ways of measuring solute concentration is by describing the weight of the solute per 100 mL of solution (g%). A 0.9% sodium chloride (NaCl) solution (saline) would contain 0.9 g/100 mL or 900 mg/100 mL. Other clinically significant ways of describing the quantity of solute particles include the use of concepts of (1) the milliequivalent, (2) osmolality, (3) osmolarity, and (4) tonicity.
The milliequivalent is the unit of measurement that is used to express the concentration of electrolytes, such as sodium, potassium, and calcium, in solutions. The concentration of these substances is usually expressed as milliequivalents per liter (mEq/L) in fluids and milliequivalents per milliliter in supplements. The milliequivalent describes the tendency of a particle to combine with another particle and is defined as 1 : 1000 of an equivalent. An equivalent weight is defined as the weight in grams of an element that will combine with 1 g of hydrogen ion. For all practical purposes, the equivalent weight of a compound is equal to the gram molecular weight of the substance divided by the total positive valence of the material in question (Blankenship et al., 1976). For example, the equivalent weight of NaCl is 58.5/1 = 58.5, and 1 L of fluid containing 58.5 g of NaCl contains 1 equivalent weight or 1000 mEq of NaCl. The equivalent weight of sulfuric acid (H2SO4) is 98.1/2 = 49; therefore, 49 g of H2SO4 in 1 L of fluid contains 1 equivalent or 1000 mEq. The following formulas allow determination of milliequivalents of solute in a solution when the concentration in grams or milligrams is known:
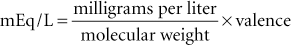
or
Osmotic Pressure and Tonicity of Fluids
Body fluid compartments usually are separated by a semipermeable (cell) membrane that permits the passage of water and some solutes. Solutes that can cross the membrane tend to move from an area of higher to an area of lower concentration by the process called diffusion and continue toward equilibrium. Solutes that cannot cross the cell membrane tend to attract water toward them. This movement of water across a cell membrane is called osmosis, and the ability of particles to attract water is called osmotic pressure.
Osmolality is a determination of the osmotic pressure of a solution on the basis of the relative number of solute particles in 1 kg of the solution. The greater the number of particles, the greater the pressure generated. The unit of measurement of osmolality is the osmol (osm), and 1 osm of any substance is equal to 1 g molecular weight divided by the number of particles formed by the dissociation of that substance. A substance that dissociates into two particles in solutions creates twice as much osmotic pressure as one that does not dissociate. Because the quantities being measured are very small in biologic systems, the milliosmole (mOsm) is used when fluids are described. One kilogram of a solution containing 29.25 g (58.5/2 particles) of NaCl would generate 1 osm/kg, or 1000 mOsm/kg of osmotic pressure.
Osmolarity refers to the number of particles per liter of solvent rather than per kilogram of solvent, as with osmolality. Very little difference is observed, however, between osmolality and osmolarity of animal fluids, and the terms frequently are used interchangeably. A 1-L solution that contains a full gram molecular weight (58.5 g) of NaCl would generate 2 osm, or 2000 mOsm/L, of osmotic pressure.
Not all solutes contribute to osmotic activity (exert a “pull” on water molecules). Those particles that are capable of generating pressure are called effective osmoles, and those that are not are called ineffective osmoles. Sodium and glucose provide most of the effective osmoles in commercial fluid preparations. The total effective osmolarity/osmolality of a solution is called tonicity. The osmolality of dog and cat serum is approximately 300 mOsm/L. Commercial fluids with an osmolality of 300 mOsm/L are isotonic (e.g., Ringer’s solution). Those with an osmolality greater than 300 mOsm/L are hypertonic (e.g., 10% dextrose), and those with an osmolality less than 300 mOsm/L are hypotonic (e.g., 0.45% saline).
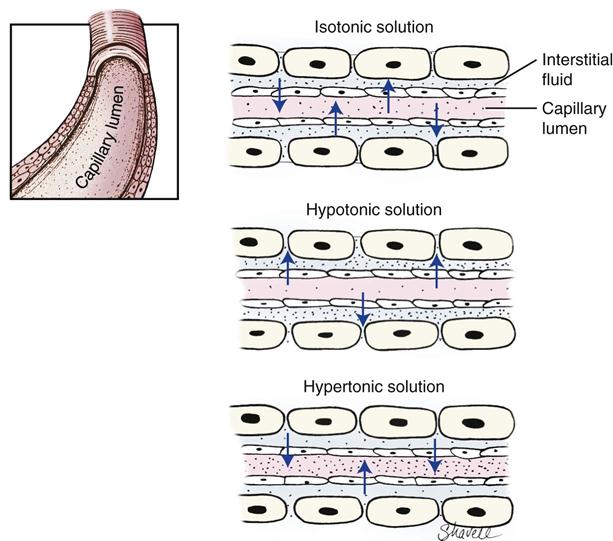
An illustration of the importance of the osmolality of fluids is as follows: if a higher concentration of sodium exists than in the interstitial space, then water would be drawn from the intracellular space into the interstitial space. Once in the interstitial space, fluid would move between the intravascular space and the interstitial space to maintain balance between these two compartments. Flow into and out of the intravascular space occurs at the capillary level, whose membranes are permeable to small particles like sodium and glucose but are generally impermeable to large molecules like colloids and plasma proteins. A large amount of solute within the intravascular space will create high osmotic/oncotic pressure and cause water to be retained within or drawn into the vasculature. Another factor influencing the movement of fluids between compartments is the fluid hydrostatic pressure within the compartment. When the hydrostatic pressure of the fluid exceeds the osmotic/oncotic pressure (pull) of the solute, fluid leaves the compartment. Figure 15-3 illustrates the potential movement of water into and out of the vasculature based on the osmolality of the vascular fluid.
Because most therapeutic fluids are composed of solute concentrations similar to that found in body fluids, osmotic destruction of red blood cells by the fluids is avoided.
Principles of Fluid Therapy
Fluid therapy is a critical but somewhat inexact component of veterinary medical care. It is critical because it is often lifesaving, but it is inexact because its application revolves around estimating the amount of fluid loss and, consequently, the amount of fluid that must be replaced. Fortunately, if the heart and kidneys and the processes that sense and control fluid balance are functioning normally, many errors of estimation are compensated for automatically.
Indications for Fluid Therapy
A basic factor in the decision to administer fluids is the animal’s hydration status. Hydration status is determined by evaluation of the patient’s history, physical examination status, and the results of basic laboratory tests. If it is determined that the animal has lost more water than it has taken in, it is said to be in a state of dehydration, and fluids must be administered to compensate. In addition, fluids often are administered to maintain normal hydration status in animals that are losing excessive fluid quantities, for the purpose of replacing electrolytes and nutrients in animals that are not eating properly, correcting hypovolemia, correcting acid–base and electrolyte imbalances, and maintaining an open intravenous line for administering medications.
Fluid Balance
In healthy animals, the intake of fluid and electrolytes is adjusted to offset losses that occur. Sources of water intake include (1) water that is drunk, (2) water that is ingested in food, and (3) water that results from the metabolism of food (metabolic water). Normal routes of water loss include (1) urine, (2) fecal water, (3) sweat (horses), and (4) respiration. Respiratory loss potentially can be important in dogs because of panting, and sweating can be important in horses. Fluid losses are frequently characterized as sensible—those that can be measured easily (e.g., urine), and insensible—those that cannot be measured easily (e.g., fecal and respiratory losses).
 Technician Notes
Insensible losses can be estimated at one third of maintenance requirements.
Decreased fluid intake often accompanies anorexia, and increased fluid loss occurs in disease states that cause polyuria, vomiting, and diarrhea. Third-space shifts or sequestrations of body water occasionally may cause quantities to be taken from circulation as they are trapped in body cavities or lost through skin lesions (e.g., intestinal obstruction, body cavity effusions, or hemorrhages). Extensive burns, which are uncommon in veterinary medicine, also can cause extensive fluid loss.
History, Physical Examination, and Laboratory Findings
A patient’s history provides important information about the route and extent of water intake and loss. Knowing the route of loss can aid a clinician in determining the type of fluid to use to correct dehydration and electrolyte imbalances. For example, acute vomiting leads to loss of potassium and chloride ions, whereas acute diarrhea causes primarily a potassium loss. Table 15-3 illustrates the selection of crystalloid fluids to treat some common disease conditions.
TABLE 15-3
Fluid and Electrolyte Disorders and Fluids Used in Their Correction
| SERUM | ||||||
| CONDITION | Na+ | Cl− | K+ | HCO3 | VOLUME | FLUID OF CHOICE |
| Diarrhea | D | D | D | D | D | Lactated Ringer’s + KCl, Normosol-R |
| Pyloric obstruction | D | D | D | I | D | 0.9% NaCl |
| Dehydration | I | I | N | N/D | D | Lactated Ringer’s, 0.9% NaCl, 5% dextrose, Normosol-R |
| Congestive heart failure | N/D | N/D | N | N | I | 0.45% NaCl + 2.5% dextrose, 5% dextrose |
| End-stage liver disease | N/I | N/I | D | D | I | 0.45% NaCl + 2.5% dextrose + KCl |
| Acute renal failure | ||||||
| Oliguria | I | I | I | D | I | 0.9% NaCl |
| Polyuria | D | D | N/D | D | D | Lactated Ringer’s + KCl, Normosol-R |
| Chronic renal failure | N/D | N/D | N | D | N/D | Lactated Ringer’s solution, 0.9% NaCl |
| Adrenocortical insufficiency | D | D | I | N/D | D | 0.9% NaCl |
| Diabetic ketoacidosis | D | D | N/D | D | D | 0.9% NaCl (±KCl) |
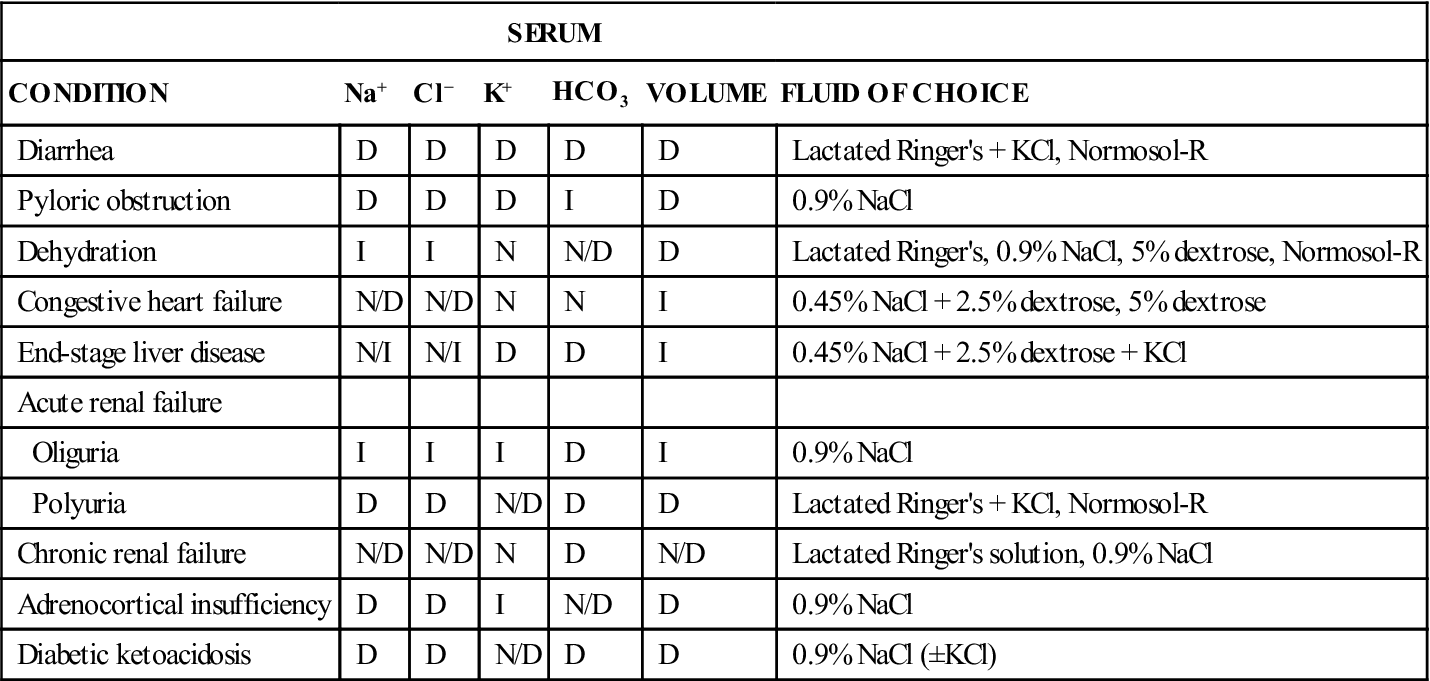
D, Decreased; I, increased; N, normal.
From Battaglia AM: Small animal emergency and critical care for veterinary technicians, St Louis, 2007, Elsevier.
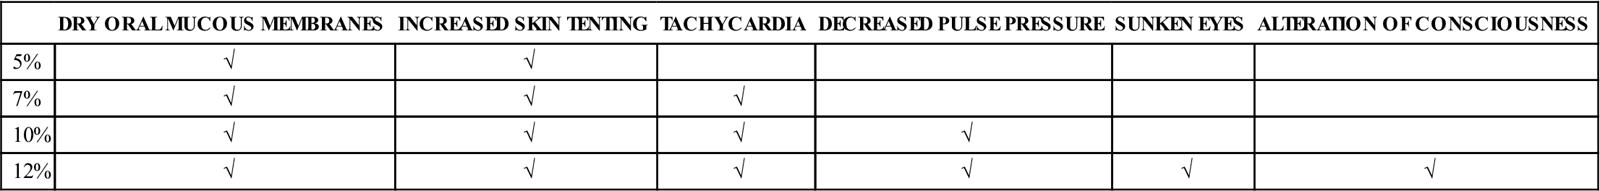
The physical examination provides important information about the extent of fluid loss. The skin turgor test, along with other physical findings (see Table 15-4), is used to determine the percentage of body weight that has been lost via fluid (percent dehydration). The skin turgor test is performed by pinching up a fold of skin over the thoracic or lumbar area and then determining how long it takes to return to a normal position. If the neck area is used in small animals, the extra skin may cause misleading results. The point of the shoulder should be used in horses because the skin of the neck area can again be misleading. The longer the skin takes to return to normal, the greater the degree of dehydration. Animals with little body fat may appear to be more dehydrated than they really are (slow return to normal skin position) because of low body fat levels, whereas obese animals may appear to be well-hydrated when they are not because increased fat increases skin elasticity. Dehydrated animals may exhibit dry mucous membranes as well as increased skin tenting.
TABLE 15-4
| DRY ORAL MUCOUS MEMBRANES | INCREASED SKIN TENTING | TACHYCARDIA | DECREASED PULSE PRESSURE | SUNKEN EYES | ALTERATION OF CONSCIOUSNESS | |
| 5% | √ | √ | ||||
| 7% | √ | √ | √ | |||
| 10% | √ | √ | √ | √ | ||
| 12% | √ | √ | √ | √ | √ | √ |
It is important to differentiate between dehydration and hypovolemia when assessing physical findings. Hypovolemia refers to what is occurring in the vascular system, whereas dehydration refers to changes in the intracellular and interstitial system. Because proper organ perfusion and function depend on adequate perfusion by the vascular system, correction of hypovolemia is often more urgent than treating mild to moderate dehydration. Signs used to detect hypovolemia are based on perfusion and include pale mucous membrane color, increased capillary refill time, hypotension, tachycardia, weak peripheral pulses, cool peripheral extremities, and hypothermia.
Because most of the evaluations mentioned earlier are subjective, simple laboratory tests may be performed to aid in assessing hydration status. These tests include packed cell volume (PCV), total plasma protein (TPP), and urine specific gravity determination. Dehydration generally results in an increase in PCV, TPP, and urine specific gravity. Because anemia can make a dehydrated patient appear to be normally hydrated, PCV always should be evaluated with TPP. Plasma lactate levels may be elevated in cases with poor tissue perfusion. Technicians should consult more advanced references for interpretation of laboratory findings related to hydration status and hypovolemia.
Determining the Amount of Fluid to Administer
Three values that are calculated to determine the volume of fluid to administer are (1) the hydration deficit, (2) the maintenance requirement, and (3) the contemporary (ongoing) losses.
The hydration deficit, which is the amount of fluid that must be replaced to bring the animal back to a normal hydration status, is calculated by multiplying the percentage of dehydration by the patient’s normal body weight. The percentage of dehydration is estimated from the history, physical examination, and laboratory findings. For example, if a 10-kg beagle is determined to be 5% dehydrated, the hydration deficit is calculated as follows:

Stay updated, free articles. Join our Telegram channel

Full access? Get Clinical Tree


