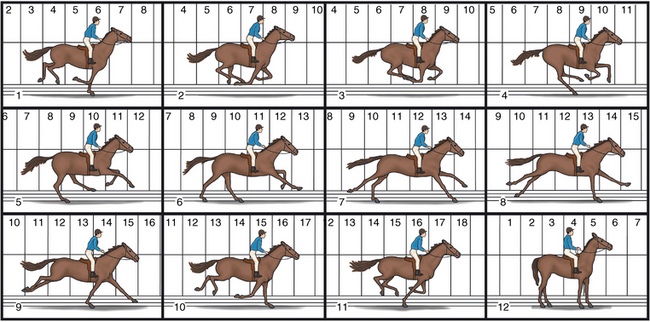
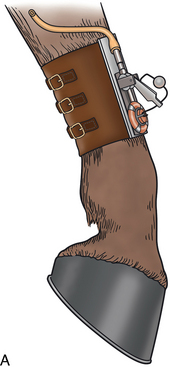
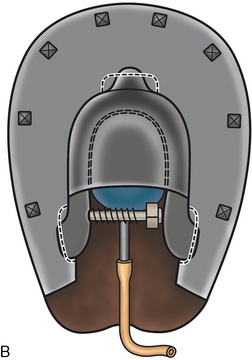
CHAPTER 16 Historically, the equine locomotor system has had demands placed on it for military, agricultural, and transport purposes. This required a robust and functional, but not necessarily refined, musculoskeletal system. In more recent times, the emergence of the horse as a competing athlete in a diverse range of equine sports and leisure pursuits has placed different and often higher demands on the equine locomotor system. This has stimulated more scientific research into equine gait and biomechanics. There is enormous wastage in racing and equestrian sports because of lameness (Jeffcott et al., 1982; Kobluk, 1998; Rossdale et al., 1985), which can be primarily attributed to orthopedic conditions resulting from repetitive stress injuries, spontaneous soft tissue injury (ligamentous, muscular, or tendinous), or blunt trauma. Blunt trauma is mostly related to unpredictable circumstance; however, repetitive stress and spontaneous musculoskeletal injuries could be avoided. Evidence-based research that is able to objectively define normal locomotion, improve diagnosis or recognition of locomotor deficiencies, or identify predisposing factors for injury is important for injury prevention or at least in the prevention of deterioration in certain conditions. Ultimately, the development of appropriate sports-specific training programs based on such research will facilitate reduced wastage and consequent economic losses associated with lameness and result in improved equine welfare. The reasons equine gait analysis is undertaken are multifold, including the following: 1. To systematically investigate, characterize, assess, and quantify normal gait patterns enabling numeric comparisons between different populations 2. To identify typical features of specific gait abnormalities 3. To understand potential mechanisms of injury consequent to various work demands and conformational traits 4. To predict performance and soundness 6. To evaluate neurologic conditions with or without lameness 7. To design and evaluate medical, surgical, training, shoeing, and rehabilitation interventions Proximally in the forelimb, the forelimb–scapula complex and thorax are joined by an extensive composite of connective tissues (synsarcosis) rather than by a bony articulation (the clavicle is absent, and the coracoid process is fused to the scapula); the scapula has orientated to a lateral–vertical position because of a flattening of the thorax in a mediolateral direction; and the glenoid articulation is consequently redirected to face cranioventrally rather than laterally. This limits possible range of shoulder motion by its approximation with the trunk. The humerus, in turn, has rotated medially, thus drawing the forearm into pronation and leaving the radius dominant in forearm weightbearing. In sum, these bony changes have enabled greater weightbearing ability and efficient economy in locomotion in the forelimb by raising the center of gravity of the trunk and providing a more mechanically stable vertical limb alignment (Payne et al., 2004). The structural arrangement of forelimb locomotive muscles has altered to accommodate the changed demands of altered body format, as has the ability of horses to move limbs in response to visual and vestibular sensory information in a changing environment. Proximally, postural muscles with interspersed elastic lamellae have developed, providing a secure muscular sling that suspends the trunk between the forelimbs, locomotive stability while allowing vertical and horizontal excursion of the thorax in relation to the limb, and absorption of vertical shock and horizontal propulsive forces (Kainer, 2002). Distal musculature has moved more proximally, reducing the forelimb moment of inertia. The brachium has remained relatively short and muscular, providing proximal stability, while the antebrachium and distal arm have replaced muscle mass (weight) with tendons and ligaments to minimize locomotive demand. Similar muscle migration has occurred in the hind limb, resulting in a similar functional anatomy of the distal limbs fore to hind. The lack of muscular protection and the weightbearing demands on the distal limb leave a system of bone, tendon, and ligament with a huge burden of duty and a narrow safety margin for tissue failure. Musculoskeletal resilience and efficiency of responses in the dynamic mechanical environment of locomotion are variable according to component tissue type and age (Smith and Goodship, 2008). It is, therefore, not surprising that distal limb injuries account for the most common musculoskeletal injuries associated with the racing and training of Thoroughbreds worldwide (Ely et al., 2009); and the skeletal system is associated with a high incidence of other equestrian sporting injuries. These injuries include degenerative joint disease, tendon or ligament lesions, muscle lesions, and bony fracture. Equine locomotion is a complex integration of linear and rotational movement patterns that are created by a combination of internal and external forces acting on the horse’s body. Internal forces are attributable to the inherent qualities of the musculoskeletal system such as tendon extensibility, bone strain, and muscle strength, which are mostly only researchable by invasive measures (for more detail see Chapter 13). External forces are consequent to the environment, with the forces created by hoof strike and weightbearing (ground reaction force) allowing noninvasive measurement. External and internal forces are not independent of each other; therefore, many factors or combinations of factors can potentially predispose athletic horses to injury or poor performance. These factors include genetic makeup, biomechanical conformation, experience, age, sex, training regimes, activity-specific work demands, environmental working conditions such as hoof–ground interaction, saddle fitting, and shoeing. Equine movement patterns can be examined as a whole body effect or by the individual contribution of specific body parts (Clayton, 2004). Biomechanical analysis provides an evidence-based platform to study these elements through the application of mechanical laws to living structures; therefore, describing and measuring motion, the forces causing movement, or both in live animals. This quantitative information can help to provide a better scientific understanding of equine locomotion, anatomy, and physiology and may also assist in validating or disproving previously subjective assessments. Prior to describing the measuring systems available today, a definition of terms, units, and measurable variables will be outlined in an attempt to standardize current nomenclature and methodology. Gait can be analyzed scientifically through a single stride cycle. Single stride can be defined as the basic repeated unit of movement of an individual limb in a full cycle of limb motion and is measured from one footfall of a limb to the next footfall (Leleu et al., 2005). At any particular gait, this is a consistent, rhythmic, automatic repeating pattern for an individual horse. This linear measurement is representative of the distance moved by the center of mass during a single stride. The stride consists of the two following interactive phases: (1) the stance phase, which is measured from hoof landing to toe-off when the hoof is in contact with the ground; and (2) the swing phase, which is measured from toe-off to hoof landing when the hoof has no contact with the ground and is lifted and brought forward (protracted) in preparation for weightbearing (Figure 16-1). The stance phase has arbitrarily and simply been divided into a restraint phase, or deceleration phase, following heel strike, and a propulsive phase, with breakover and toe-off, mid-stance position bisecting these phases. Breakover begins at heel lift during the terminal part of the stance phase and ends at toe-lift. The mid-stance position in the forelimb is when the metacarpus is in a vertical position and in the hind limb when the hoof is directly under the hip. Measurement of these parameters in either geometric or force-related studies allow the terms in Table 16-1 to be calculated. TABLE 16–1 Definition of Terms and Units of Measure in Equine Gait Analysis 1. Transverse–horizontal, mediolateral, or yaw 2. Longitudinal–horizontal, craniocaudal, or roll 3. Vertical or pitch (Figure 16-2) Standardizing velocity is of utmost importance, as both kinematic and kinetic parameters have been demonstrated to be directly velocity dependent (Khumsap et al., 2001; Khumsap et al., 2002; Robilliard et al., 2007).When kinematic and kinetic data are synchronized with morphometric data (mass, center of mass, and mass moment of inertia of body segments) and mathematical formulas, more detailed gait analysis such as net joint moments, joint power profiles, and changes in center of mass position can be performed (see inverse dynamic analysis below). Statistical analysis of these data may or may not allow significant statistical conclusions to be drawn; however, trends toward or away from a biologically significant effect may be revealed. Biomechanical studies using these techniques can help in analysis of the characteristics of normal gait in multiple planes; detection of subtle gait asymmetries and compensatory changes, which has practical application for lameness evaluation; and assistance in performance assessment and quantification of the efficacy of intervention therapies and regimes. Inverse dynamic analysis is a mathematical technique based on a biomechanical model of the limb as a linked series of rigid segments without friction or translation. Using this technique, interactions between the segments during the stance are summarized as net joint forces and net joint moments, which enables noninvasive in vivo evaluation of the net internal forces of peripheral joints and tendons at any time interval during this gait phase. A quasi-static equilibrium between internal and external forces and the moments acting on the joint is assumed, and inertial parameters are often disregarded as being negligible during the stance. Comparison of sequential time frame points enable the calculation of the work done (net torque) and power generated and absorbed about each joint. The application of this technique to the swing phase gives joint moments representing the net effect of muscular forces acting on segmental inertial properties to produce angular and linear acceleration of body segments against gravity (Lanovaz and Clayton, 2001). The design of the rigid segment model necessitates a simplification of musculoskeletal mechanics, thus limiting the extent of data interpretation. Friction and joint structure integrity are not considered; semirigid segments of the body cannot be accurately analyzed because of force attenuation ability (e.g., trunk); muscles crossing more than one joint (very common in horses) are not well represented; joint moment data are a summary representation of mechanical effort; and movement in most models is restricted to a two-dimensional movement in the sagittal plane limiting force analysis to the flexor or extensor muscle groups acting on the joints. Isolation of individual muscle activity and characterization of the co-contraction of agonistic–antagonistic muscles cannot be determined as muscle action is represented as a net moment. Inverse dynamics analysis is also particularly sensitive to input data, so any inaccuracy will have important ramifications for resulting joint moment data. Kinematic analysis of the horse in motion allows quantification of the components of equine gait which can be visually or subjectively assessed. Martens et al. (2008) confirmed that kinematic analysis is more detailed and reliable than visual appraisal, even with viewing of slow-motion cinematography. Videography and optoelectronic systems used for kinematic analysis can evaluate temporal (timing) variables such as stance times, swing times, duty factors; linear (distance) variables; and angular measurements, thus describing trajectories of body segments and joint angles in space over time. These data also allow the relationship between time and displacement (velocity and acceleration or deceleration) to be calculated. With appropriate software, this is a particularly valuable way to measure equine spinal mechanics, as vertebral access is difficult and joint movement amplitudes are small, which limits visual appraisal. Imaging can be either two-dimensional or three-dimensional, depending on the number of cameras and the orientation of camera angles. Data interpretation and comparison are dependent on the precise definition of the parameters measured and in the expression of statistical terms. Two-dimensional imaging is easily performed; however, data analysis is limited, and errors will be introduced if significant primary and coupled movements are not captured by the camera lens angle. While motion at the distal limb is primarily restricted to flexion or extension in the sagittal plane, the small movement components of rotation, circumduction, translation, or shearing, which may be relevant to locomotion or lameness studies, are not discernible in two dimensions. Furthermore, body parts may move temporarily out of camera view, and marker tracts may cross each other. Three-dimensional studies overcome these failings to a certain degree but are more complex in operation and analysis, and the setup expense limits its use to only a few specialty practices and academic institutions. Data presentation of kinematic gait analysis can be done by using spreadsheets, graphics, or stick figures (Clayton and Schamhardt, 2001). The most commonly employed plotting formats use trajectory versus time, which allows the comparison of different kinematic features occurring simultaneously or the comparison of simultaneous kinematic, kinetic, and biophysical data. A skin marker system will potentially introduce error to experimental design, as some landmarks are difficult to repeatedly and precisely identify because of the depth of overlying musculature or fat and the specificity of a small marker placement on a large bony landmark. Inadequate preparation of the marker site (e.g., not eliminating hair interference) may also introduce artefacts. More importantly, the task-dependent movement of overlying skin or soft tissue relative to the underlying bone, which occurs with positional change, will introduce error. Skin movement relative to bone is more apparent proximally than distally (Weller et al., 2006). Two-dimensional mathematical correction algorithms to adjust for skin displacement have been developed on Dutch Warmbloods at the walk and trot (van Weeren et al., 1992). The corrections are for a limited number of body segments and are only applicable to horses with comparable conformation, gait style, and velocity. A preliminary three-dimensional method for skin displacement correction at the equine radius has been designed; however, further studies are needed to extend the application to the entire forelimb and hindlimb, which would allow more sensitive kinematic gait analysis (Sha et al., 2004). The late 1800s saw the beginning of the quest to scientifically analyze equine locomotion. Muybridge (1899) is cited comprehensively in the literature as being the pioneer of kinematic movement analysis in horses, which involves the use of photographic stills to record relative stance durations during gait (Figure 16-3). The use of serial photography required the horse to move through the field of view of 24 cameras triggered in succession. Serial still photography only captures one instant of time per frame and records three-dimensional movement in two dimensions, so total movement analysis is not possible. Marey (1873) improved on this work by developing chronophotography, which captured several different images on one photographic plate; however, accurate kinematic measurements were difficult because of image overlap. High-speed cinematography, videography, and optoelectric systems evolved from these original concepts. Cinematography was used extensively in the past and employed a fine resolution (10 to 500 frames per second) and a wide range of shutter and camera speeds. The process was expensive and labor intensive in methodology and analysis (e.g., manual digitizing of coordinates, cumbersome mainframe computers). Currently, videography, combined with commercial software packages and optoelectric systems, is most often used for kinematic equine gait analysis. These systems all require calibration; automatic digitization of raw data, manual digitization of raw data, or both; integration of the calibration and digitized information (transformation) so that image coordinates can be correctly scaled to size; and smoothing to reduce the electric noise of digitalization caused by random fluctuation of electrical currents (usually performed using a low-pass filter, although piecewise quintic splines and Fourier series reconstruction may be used). This allows real-time data capture and analysis (Clayton and Schamhardt, 2001). FIGURE 16-3 Photographs of the fast gallop after Muybridge. (From Goubaux A, Barrier G: The exterior of the horse (Harger SJJ, editor), ed 2, 1892, Lippincott, Philadelphia p 487.) Videography: Videography can be in either analog or digital format. The hardware and software are comparatively inexpensive, easy to operate, and portable; and data collection is immediately available for analysis. Care must be exercised to prevent errors caused by skin marker placement and skin displacement as discussed previously. Additionally, the camera must be accurately orientated perpendicular to the segments of interest, and lighting conditions are critical for clarity of footage. Although videographic data collection can be performed outdoors in sunlight, some digital videographic systems allow manual identification of markers, which may be useful even in less-than-optimal lighting environments. The disadvantages of analog recordings are the likelihood of the VHS (video home system) recording medium degrading over time, unless loaded onto a computer, and the processing or digitizing of the video being time consuming. Options in digital processing include online or postprocessing autodigitizing of data collected which reduces time cost. Optoelectric systems: Optoelectric systems based on the emission or detection of infrared light are the most effective collection systems for kinematic data. Current infrared based systems, used in conjunction with reflective markers or LEDs, have high framing rates and high resolutions, enabling the capture of whole body movement even as precisely as measuring the deformation of the hoof wall during stance (Thomason and Peterson, 2008). Multicamera setups can localize markers to within 0.6 mm in a predefined three-dimensional volume, allowing relative positions of markers to be determined using output coordinates (Pfau et al., 2005). The frame-by-frame representation of the changing marker position can be presented as computer-generated stick figures or graphs of joint position plotted against time. The major pitfall in using optoelectric systems is that aberrant markers may result from the sensitivity of the system to the infrared spectrum of daylight or any other reflective surface within the experimental area. Low-pass filtering to minimize marker trajectory noise may cause temporal shifts in key parameters of raw signals, thus distorting or dampening mean phase and magnitude values in the resulting data (Molloy et al., 2008). Kinetic analysis is the study of the mass distribution and dimensions of forces acting on the horse during the stance and motion, which are indiscernible to human sensory perception (Weishaupt, 2008). This movement analysis is concerned with the effect of forces on such factors as inertial properties, acceleration, energetics, and work. The main aims of analyzing force production during locomotion are to explain the influences of force on movement (sound or lame); maximal performance; the metabolic cost of locomotion; the possible triggers for gait transition; and the safety margins of musculoskeletal structures during high-speed motion indicating predisposition to injury. Marey (1873) is credited throughout the literature as being the pioneer of equine kinetic analysis. Using pneumatic principles, Marey developed various pressure sensor devices that were attached under the hoof and around the distal limb, measuring and recording pressure changes in cannon bone during hoof–ground contact at various gaits (Figure 16-4). Collaboration with other scientists produced a pneumatic force plate, which was used to measure force in the vertical axis. The same principle is used today, although modern technology allows much more detailed measurements of force and pressure at the hoof–ground interface to be recorded and analyzed. A variety of electronic force sensors have been used in walk, trot, canter, jumping, and lameness studies, and these will be summarized below. FIGURE 16-4 Pneumatic bracelet (A) and foot bulb (B) used by Marey (1873). (From Goubaux A, and Barrier G: The exterior of the horse (Harger SJJ, editor), ed 2, 1892, Lippincott, Philadelphia p 175.) Force plates: The force plate provides a dynamic, noninvasive, quantitative assessment of the amplitude and orientation of ground contact forces transmitted through one limb during the stance phase. This assessment represents the sum of trunk and limb forces generated by and resulting from the stance and also reflects the acceleration of the body mass of the horse. The orientation of these forces is measured by deflection of sensing elements (strain gauges or piezoelectric quartz crystals) in the three orthogonal components of the ground reaction forces (GRF): (1) vertical, (2) longitudinal, and (3) transverse (Figure 16-5). Vertical GRF is of the greatest magnitude; it most directly measures limb specific weightbearing and sensitivity in grading lameness (Weishaupt, 2008) and so is the most commonly used measurement in force plate studies. Craniocaudal GRF quantitates forces affecting forward progression—braking (deceleration) and propulsion (acceleration). Mediolateral GRF has the smallest amplitude, so few studies have used this variable. After recorded data are analyzed in all three parameters, peak forces, total impulses (total forces integrated over time), and average force or impulse can be determined, which helps describe the rate and pattern of limb loading and unloading. These data are often expressed in a force-versus-time curve, which can be mathematically broken-down into sine and cosine components, allowing convenient and reliable graphic curves to be studied. It is important to evaluate the shape of the force profiles in addition to peak values, as mild or transient differences that are meaningful may be identified. In addition, the force plate can identify the coordinates of the point of application of force, enabling measurement of the moment value, vertical torque, center of pressure, and coefficient of friction at this point (McLaughlin et al., 1996). The sampling frequency and time of data recording can be altered, depending on force plate sensitivity. Although more minute changes in gait will be recorded with more sensitive settings, voluminous amounts of data will necessitate a large computer memory for storing and processing the information. Other possible restrictions of using force plates in equine studies are the initial expense of the force plate, the requisite mounting of the plate in a purpose-built runway in a laboratory situation, the difficulty in standardizing movement velocity, the limitations of high-speed data collection with a stride length greater than 5 meters (m) and the necessity for accurate foot placement on the plate (isolated foot strike centered on the plate) during gait (Witte et al., 2004). This requires repeated trials (five trials are recommended as a minimum), is time consuming, and also creates volumes of data requiring processing. Also, a single force plate can only record the forces through one limb at a time and load distribution generally sampled through at least two concurrent hoof–ground contacts. Increasing the size of the force plate or embedding a force plate in a high-speed treadmill will reduce these problems (see treadmill evaluation).
The biomechanics of equine locomotion
Biomechanical adaptations in equine anatomy
Locomotion analysis
Definition of biomechanical parameters
Descriptive Terminology
Definition and Units of Measurement of Stride Variables
Stride duration (SD)
SD is the time for one complete gait cycle or the time between any two identical events of a cycle (second [s]). SD decreases with velocity and is associated with a shortened stance phase.
Stride frequency (SF)
SF is the number of strides per unit of time (s). SF is equal to the inverse of stride duration (Leleu et al., 2005), is limited by protraction time and increases nonlinearly with velocity.
Stride length (SL)
SL is the linear distance a hoof travels (meter [m]) during a stride cycle and is deduced from the relationship of velocity and stride frequency (Leleu et al., 2005). SL increases linearly with velocity.
Duty factor
Fraction of the stride when the limb maintains contact with the ground (%), mostly reducing with velocity.
Protraction time/swing phase
Fraction of the stride when the limb is moving forward and free from ground contact.
Advanced placement
Fraction of the stride that elapses between ground placement of specified limbs.
Overtracking
Distance between the hindlimb and forelimb hoof strike; it is positive if the hindlimb lands in front of the forelimb.
Systems for biomechanical measurement of parameters
Inverse dynamic analysis
Kinematic analysis
Systems used for kinematic analysis of gait
Kinetic analysis
Systems used to measure kinetic analysis of gait
![]()
Stay updated, free articles. Join our Telegram channel

Full access? Get Clinical Tree


The biomechanics of equine locomotion

Only gold members can continue reading. Log In or Register to continue
