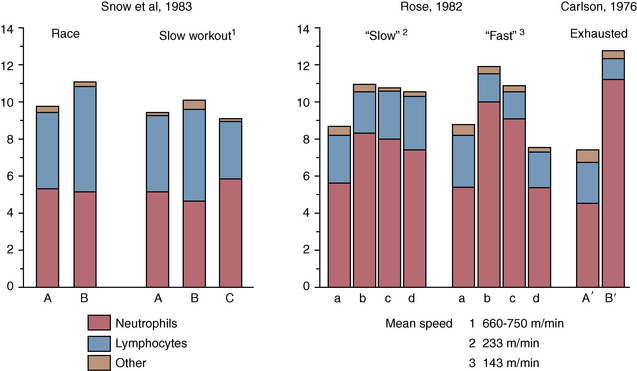
CHAPTER 5 The precision of measurements of Hb, HCT, erythrocyte counts, and leukocyte counts has been found to be ±5% in 36 duplicate measurements. Thus, in the normal ranges for each of these measurements when sequential sampling is performed, changes would have to be greater than 0.02 L/L (2%) for HCT, 7.5 gram per liter (g/L; 0.75 gram per deciliter [g/dL]) for Hb, 0.5 × 10⁹/L (500/μL [microliter]) for leukocyte counts, and 0.5 × l012/liter (0.5 × 10⁶/μl) for erythrocyte counts before the changes could be regarded as clinically significant. In addition to the precision related to the measuring equipment, daily variation in the RBC indices in individual horses must be taken into account. Persson (1975a) reported up to a 30% variation in the resting Hb values of three Standardbred trotters that had daily blood samples collected for 7 days. From these findings, it is clear that some caution is required when interpreting erythrocyte indices, particularly from a single blood sample. Repeated measurements may permit greater confidence in the findings. Plasma and serum biochemical measurements are generally performed using autoanalyzers, and the accuracy of such equipment is generally ±5%. Measurement of electrolytes is generally performed using ion-selective electrodes in autoanalyzers rather than flame photometry, used previously. Carlson (1989) has noted that because ion-selective electrodes measure the electrolyte concentration in the water component of plasma or serum, values are 6% to 7% higher than those of electrolytes measured by flame photometry. Flame photometry measures electrolyte concentrations in millimoles per liter (mmol/L) of plasma or serum, where the water content is 93% to 94%. RBCs containing Hb play a vital role in the pathway transporting oxygen from the lungs to the muscles and tissues that are used in performance (Weibel et al., 1991). The correlation between Similarly in horses, a relationship has been found between RBC volume, training, and performance. RBC volume increased with the horse’s age and training and also was correlated with racing performance in normally performing horses (Persson 1968; 1983a). An Australian study indicated that Thoroughbred horses with RBC indices falling by more than 1 standard deviation (SD) below the mean did not win races at city race courses (Stewart and Steel, 1975). More recent work has shown that administering low-dose erythropoietin three times a week for 3 weeks to horses resulted in significant increases in packed cell volume (PCV; resting and peak), Hb, and RBC volume, as well as a resultant increase in As a result, the main focus of the hemogram of a racehorse is the RBC count, Hb concentration, and PCV or HCT. However, these data have notoriously failed to detect differences in fitness or performance at rest because of low reproducibility and variations associated with other factors, including degree of excitement, time since last exercise, feeding status, and transport (Snow, 1983). Of particular importance is the fact that routinely measured values of PCV or HCT, Hb, and RBC number may not reflect the true RBC volume. This is principally attributed to the uneven distribution of RBCs in the circulatory system, with varying degrees of splenic storage (Persson, 1983a). Although the normal range for an individual horse may be quite narrow, normal values for a breed fall into a broad range (Table 5-1). The normal ranges for adult Thoroughbred and Standardbred horses in training are given in Table 5-2. Most of the hematologic values for the different breeds are similar. However, as groups, the RBC indices from Standardbred pacers and Endurance horses are lower than those for Thoroughbred racehorses. This may, in part, be due to differences in plasma volumes, since plasma volume expansion may occur during training in Standardbred and Endurance horses because of the extensive submaximal training that is included in their work schedules. TABLE 5–1 Normal Hematologic Values (Mean or Mean ± SD) Reported for Adult Horses at Rest From Rose RJ, Allen RJ: Hematologic responses to exercise and training. Vet Clin North Am Equine Pract 1:465, 1985. TABLE 5–2 Published Ranges for Resting Hematological Variables in Racehorses Virtually all mature athletic horses that do not have clinical abnormalities will have hemogram values within the ranges reported in Table 5-2. Some veterinarians advocate regular collection of blood samples every 1 to 2 weeks from horses in training. This may be helpful in the diagnosis of subclinical abnormalities because individual normal values will fall within a much narrower range compared with values for the breed. Thus, an HCT value of 0.34 L/L may be of clinical significance in a horse that normally has values between 0.38 and 0.42 L/L, whereas no clinical significance could be attributed to an isolated blood sample with an HCT value of 0.34 L/L. However, it is tempting for clinicians who cannot find any other abnormalities to falsely ascribe the cause of poor performance to minor deviations from breed means. Several studies in Thoroughbred racehorses have failed to demonstrate any relationship between HCT values prior to racing and subsequent racing performance (Laufenstein-Duffy, 1971; Revington 1983). Carlson and colleagues (1983) demonstrated that horses presented with anemia (2 SD below the mean) were most likely to have intercurrent disease rather than primary anemia. Therefore, if the RBC indices are low and there is no history of blood loss, low-grade infectious or inflammatory disease should be suspected rather than a primary disorder in RBC production. Although there is some variation in the resting RBC indices, samples collected after fast exercise or epinephrine administration show little variation on repeated sampling (Persson, 1975a). During exercise, under the influence of catecholamines, contraction of the spleen and release of erythrocytes occur, increasing PCV by as much as 20 L/L to 25 L/L (Snow et al., 1983a) (see Table 5-2). Because of the wide variations of normal resting PCV, maximal HCT may be a more reliable indicator of true RBC volume in horses (Persson, 1983a). However, it should be noted that part of this increase is from fluids shifts, with 15% increase in plasma protein recorded following racing (Snow et al., 1983a). Further, there may be up to a 10% individual horse variation in plasma volume (Persson, 1983a). These variations in plasma volume may significantly affect maximal HCT and its ability to represent RBC volume in horses. The horse’s demeanor and degree of excitement can have a significant effect on the resting hemogram because of the release of catecholamines causing splenic contraction and mobilization of erythrocytes. Increases of PCV between 6 L/L and 13 L/L have been reported in horses before exercise after simply being walked to the racecourse (Revington, 1983; Snow et al., 1983a). In one study of Thoroughbred horses, the animals were classified as either placid, timid (forceful jugular pulse and elevated heart rate), apprehensive (horse pulled back during blood collection), or excited (resisted blood collection and moved about). Although only the excited horses had increases in the erythrocyte and leukocyte counts when compared with the placid group (Stewart et al., 1977), we have noted small increases in RBC indices when horses show only slight degrees of apprehension. The critical factor appears to be the time required to collect the blood sample, since Persson and colleagues (1973) found that erythrocytes were mobilized from the spleen 30 to 60 seconds after the intravenous injection of epinephrine in a study using 15Cr-labeled erythrocytes. Thus, it would seem that slight temperament changes will have little influence on the hemogram, provided blood samples are collected within 30 seconds of entering a box stall. However, it is important to note that in one study of Endurance horses, in which samples were collected every 2 weeks throughout 12 weeks of training, a group of five horses that were considered apprehensive during blood collection had HCTs that were 21% higher than in six quiet horses (Rose and Hodgson, 1982). Thus, care must be taken when interpreting changes in erythrocytes and leukocytes, particularly when values are higher than normal. It also should be anticipated that very placid horses may have values for RBC indices that are lower than mean values for the breed. When hay is fed, there may be substantial increases in HCT and plasma total protein, probably associated with substantial salivary fluid production (Kerr and Snow, 1982). HCT and total protein remain elevated for several hours. In a study in which a multiple regimen (feeding every 4 hours) was used, HCT and total protein remained constant, whereas a single large meal resulted in substantial fluid shifts out of the extracellular space (Clarke et al., 1988). In combination with the fluid shifts after the single feed, increases were found in plasma sodium and decreases in plasma potassium for several hours after feeding. Thus, blood sampling should be avoided for at least 3 hours after feeding, particularly when a large feed is given or when there is access to substantial amounts of hay. The RBC pool is under the direct influence of catecholamine concentrations, so exercise has a variable effect on RBC indices, depending on the speed and duration of the exercise bout. Horses have large splenic reserves of up to 50% of the RBC volume that is able to greatly influence the exercising blood volume (Persson and Lyndin, 1973). The splenic capacity for RBC storage and subsequent release during exercise is related to the type of horse; draught horses having much lower relative splenic weights than Thoroughbred horses (Kline et al., 1991). Splenic capacity also appears to alter in response to increasing age, since several studies in trotters have found that postexercise HCT and total circulating Hb increase progressively from 1 to 3 years of age (Persson, 1967; 1975b; 1983b). There is a linear increase in HCT with increasing exercise intensity, up to exercise intensities approaching three-quarter pace (90% to 100% The increase in oxygen transport capacity associated with the erythrocyte release during exercise is one of the important factors in the horse’s high aerobic capacity. However, an upper point must be reached where the improved oxygen-carrying capacity is offset by an increase in blood viscosity, probably accounting for the dramatic reduction in performance in horses with RBC hypervolemia (Persson, 1968). Studies in splenectomized horses have shown a considerable reduction in exercise capacity (Persson and Bergsten, 1975; Persson and Lyndin, 1973). Because of the reduced cardiac output in splenectomized horses, Persson and Bergsten (1975) proposed that the spleen acts as a cardiovascular reserve to maintain ventricular filling at high heart rates. There has been a long association of RBC hypervolemia and poor performance in Swedish Standardbred trotters, with higher-than-normal RBC volumes found in horses that performed poorly (Persson, 1968). Horses diagnosed with RBC hypervolemia had lower earnings and increased race times in the year of diagnosis compared with their previous performance, although, interestingly, many had been superior athletes prior to diagnosis (Persson and Österberg, 1999). Despite the association between RBC hypervolemia and overtraining in Swedish Standardbred trotters, this association has not been repeated in horses elsewhere. In Standardbred horses overtrained in a treadmill study in Australia, there was actually a significant reduction in measured RBC volume and maximal PCV in the overtrained horses compared with the controls (Golland et al., 2003). In these overtrained horses, the reduction in RBC volume was only weakly reflected as small but not significant decreases in PCV, RBC number, and Hb compared with controls (Tyler-McGowan et al., 1999). In another study of overtraining in Standardbred horses in New Zealand, there was decrease in maximal PCV in overtrained horses, but no change in RBC volume (Hamlin et al., 2002). Changes may occur in the erythrocytes themselves, there being small decreases in mean corpuscular volume and increases in mean corpuscular Hb and mean corpuscular Hb concentration. Elevations in serum Hb and bilirubin, associated increases in erythrocyte fragility, and the presence of abnormal erythrocytes (echinocytes) have all been reported in the postrace recovery period (Poso et al., 1983). Their presence may be related to both the release of senescent erythrocytes from the splenic pool and the high pressures and turbulence associated with intense exercise (Carlson, 1987). However, evidence suggests that increased fragility of RBCs is associated with decreased blood pH and increased temperature with more intense exercise or exercise stress (Hanzawa et al., 1999). Despite the presence of abnormal erythrocytes, their role in performance has not been established. The leucogram is also frequently monitored in racehorses, particular total and differential leucocyte cell count, the latter referring principally to the neutrophil:lymphocyte ratio. Although it has not been linked to performance or fitness, changes in the leucogram may be indicative of subclincial disease or stress. The detection of these potentially performance-limiting problems is clearly of interest to the racehorse trainer. However, resting leucocyte counts only represent the circulating pool of leucocytes. Approximately 50% of the total neutrophils are sequestered in the spleen and capillary beds and are referred to as the marginated or marginal pool. Marginated neutrophils can be mobilized under certain conditions, including excitement, exercise, stress, transport, and exogenous corticosteroid or catecholamine administration, causing alteration to the leucogram (Carlson, 1987; Snow, 1983). The normal ranges for the Thoroughbred are given in Table 5-3. TABLE 5–3 Values for the Resting Hemogram in Normal Adult Thoroughbred Horses Excitement and intense exercise (effect of catecholamines) In man and most other animal species, exercise results in physiologic leucocytosis associated with a mobilization of marginated neutrophils to the circulating pool and moderate to marked neutrophilia (Carlson, 1987; Snow, 1983). In the horse, the mobilization of leucocytes from excitement and exercise is masked by the concomitant increase in erythrocytes and blood volume as a result of splenic contraction. Immediately following intense exercise or as a result of prerace excitement, there may be no change in total leucocyte count or only a moderate leucocytosis (Revington, 1983; Snow, 1983; Snow et al., 1983a). However, both prerace excitement and intense exercise (racing or training gallops) have been shown to result in a reduced neutrophil:lymphocyte ratio as relatively more lymphocytes than neutrophils are released into the circulation from the spleen. This altered ratio takes up to 6 hours to return to baseline values (Revington, 1983; Snow et al., 1983a). Allen and Powell (1983) reported that in Thoroughbreds after morning exercise, blood samples collected at 4:00 p.m. had higher leukocyte numbers as well as a higher proportion of neutrophils than samples collected in the morning prior to exercise. Lower-intensity exercise produces a different change in leucogram with a marked leucocytosis due to neutrophilia, lymphopenia, and eosinopenia (Rose and Allen, 1985). The total leukocyte count increases by 10% to 30%, depending on the intensity and duration of exercise, but the extent of the increase is not as dramatic as for the erythrocyte indices. This is a result of the effects of cortisol associated with exercise, which is correlated with increases in the neutrophil:lymphocyte ratio (Wong et al., 1992). Elevated plasma cortisol concentration results in decreased marginated neutrophils, an increased neutrophil output from bone marrow, and decreased lymphocytes and eosinophils (Snow, 1983). Although the degree of leucocytosis may not vary, there is greater neutrophilia and lymphopenia with increased stress, for example, increased speed or signs of exhaustion that may last for more than 24 hours in prolonged endurance exercise (Rose, 1982). Under conditions of severe stress, such as is found in exhausted Endurance horses, there is not only a greater degree of neutrophilia but also the appearance of band-form neutrophils (Rose, 1982) (see Figure 5-1). The effects of moderate exercise in a typical racehorse program have been shown to have similar effects, albeit of shorter duration. Trotting exercise for 15 minutes on an inclined treadmill was associated with an increase in total leucocyte count and neutrophils with a decrease in lymphocytes. However, values had returned to normal by 1 hour after exercise (Rose et al., 1983a). Some veterinarians at the racetrack regard an increase in neutrophil:lymphocyte ratio as an indicator of overtraining or “training off.” Although such changes often appear to provide an indication of “stress,” reflecting increased plasma cortisol (Rossdale et al., 1982), care must be taken in interpreting these changes because a number of factors such as exercise and time of collection can affect the results. Eosinopenia has been reported in overtrained horses without systemic illness but not in a control group (Tyler-McGowan et al., 1999). This suggests that eosinophils may be a more sensitive indicator of training stress than neutrophils or lymphocytes. In the above study on overtraining, there was a small, gradual increase in the neutrophil:lymphocyte ratio during the 32-week training period for both overtrained and control horses (Tyler-McGowan et al., 1999). However, this was possibly associated with prolonged activity of the cortisol response to exercise as shown by Rose (1982), as horses in this study were trained intensively 6 days a week. Decreases in neutrophil counts may be an indication of systemic or respiratory disease. More prolonged or purulent inflammatory conditions may result in the opposite effect with neutrophilic leucocytosis (Carlson, 1987). In studies in Hong Kong, horses with equine herpesvirus type 1 infections had monocyte counts higher than 0.5 × 10⁹/L, together with higher neutrophil and lower lymphocyte counts than normal, during the first 1 to 2 days (Mason et al., 1989; 1990). Within the first 4 to 5 days, the neutrophil count decreased and the lymphocytes increased, whereas the monocytes continued to remain elevated. The other notable finding was an increase in plasma viscosity, which, together with changes in monocyte numbers, persisted for several months in some horses following infection with equine herpesvirus.
Hematology and biochemistry
Resting hemogram, leucogram, and serum or plasma biochemical variables
Sample processing and accuracy
Resting hemogram
 O2max and Hb concentration was shown experimentally in human athletes using autologous blood transfusions and blood loss (Ekblom et al., 1972; 1976). The relationship between an acute increase in blood Hb concentration and performance has been well studied in humans, with researchers showing increases in endurance time, greater speed and mean power output, and lower blood lactate concentration in standardized exercise tests (Calbet et al., 2006). Conversely, although perhaps less well studied, reduced Hb concentration reduces endurance performance (Calbet et al., 2006).
 O2max (McKeever et al., 2006), further supporting the relationship between RBC volume and performance.
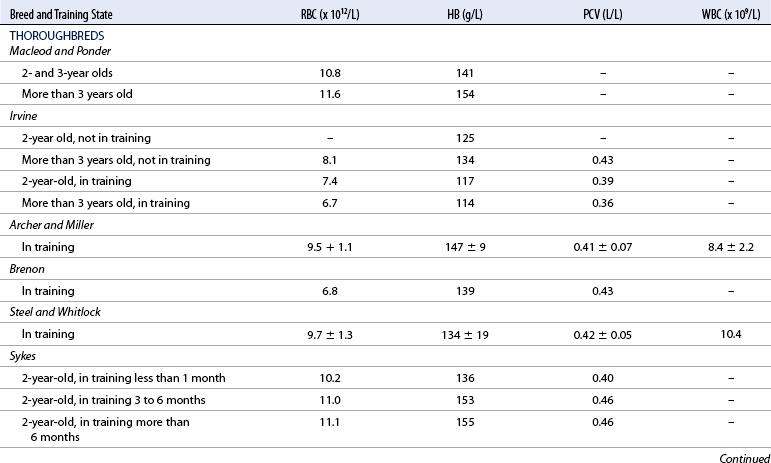
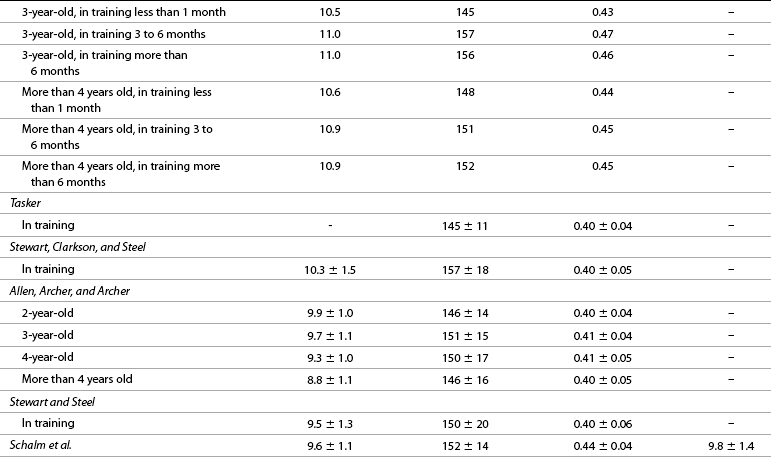
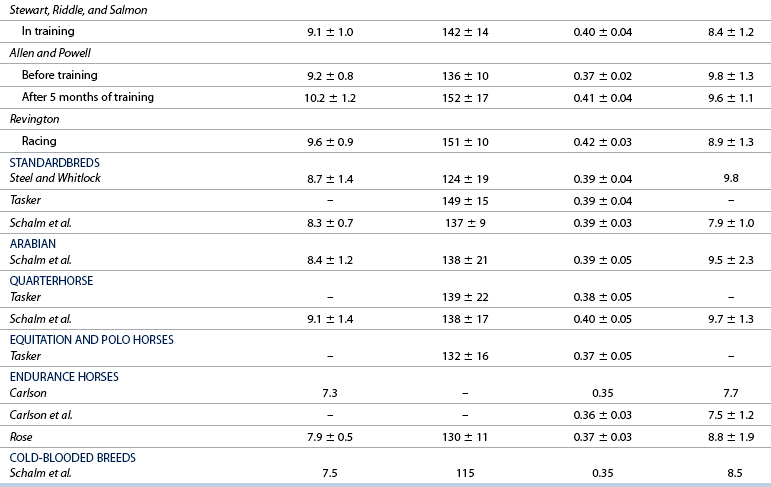
Normal ranges, monitoring, and performance
Standardbred
Thoroughbred
PCV (HCT) liter/liter (L/L)
32–39
32–43
Maximal PCV
48–65
60–65
Red blood cells (×1012/L)
6.8–9.8
7.8– 9.7
Hb (gram per liter [g/L])
115–146
124–180
MCV ([fl])
45–45.5
39.4–47.2
MCH ([pg])
14.3–16.6
13.8–16.6
MCHC (g/L)
314–372
315–361
Maximal packed cell volume or hematocrit
Factors affecting the resting hemogram
Attitude of the horse
Effect of feeding
Exercise
 O2max) (Rose and Allen, 1985). In adult athletic horses, maximal HCT is usually in the range 0.60 L/L to 0.65 L/L, the mean value being 0.61 L/L in Thoroughbred racehorses. Although most of this increase is related to splenic erythrocyte release, there are also substantial fluid shifts out of the plasma during exercise, and therefore, some of the increase in HCT is from fluid movement (Carlson, 1983).
Overtraining
Erythrocyte changes with intense exercise
Leucogram
Value
Range
Mean
Leukocytes (× 109/L)
6.0–11.0
8.5
Neutrophils (× 109/L)
2.5–6.5
4.5
Lymphocytes (× 109/L)
2.0–5.5
3.5
Monocytes (× 109/L)
0.2–0.8
0.5
Eosinophils (× 109/L)
0.1–0.4
0.2
Basophils (× 109/L)
0–0.3
0.1
Factors affecting the resting leucogram
Stress and moderate intensity exercise (effect of corticosteroids)
Overtraining
Subclinical disease
![]()
Stay updated, free articles. Join our Telegram channel

Full access? Get Clinical Tree


Hematology and biochemistry
Only gold members can continue reading. Log In or Register to continue
