Insulin Resistance in Dairy Cows
Jenne D. De Koster, DVM and Geert Opsomer, DVM, PhD, Msc∗, Department of Reproduction, Obstetrics and Herd Health, Faculty of Veterinary Medicine, Ghent University, Salisburylaan 133, Merelbeke 9820, Belgium. E-mail address: geert.opsomer@ugent.be ∗Corresponding author.
Keywords
Insulin resistance
Dairy cow
Glucose metabolism
Insulin sensitivity tests
Pregnancy and lactation
Adipose tissue
Cows are ruminants and possess a very specific glucose metabolism
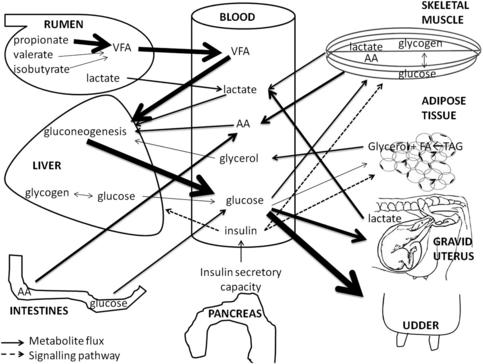
The glucose metabolism is of major interest in all living mammals because certain vitally important cell types (erythrocytes, brain cells, and kidney cells) have to rely on glucose as the only energy substrate.1 Therefore, maintenance of blood glucose levels within normal physiologic ranges is of utmost importance. In comparison with that of other mammals, the glucose metabolism of ruminants is characterized by low peripheral glucose concentrations2–4 and a low insulin response of the peripheral tissues.3,5–7 The glucose metabolism is regulated by the supply and removal of glucose and glucogenic precursors in the blood and is tightly controlled by different hormones. Within the ruminants, dairy cows occupy a special position regarding the glucose metabolism. The massive glucose drain toward the udder and the unique transition between pregnancy and lactation make the glucose metabolism of dairy cows an example of how intensive genetic selection can drive metabolism to extremes. A schematic overview of the glucose metabolism in dairy cows is given in Fig. 1.
Glucose Supply
Propionate
Whereas monogastric species rely on intestinal glucose absorption as an exogenous supply of glucose, ruminants absorb only small amounts of glucose in the intestines.1 Most of the circulating glucose in ruminants originates from hepatic and renal gluconeogenesis. Different endogenous and exogenous substrates are used for this gluconeogenesis. In the forestomachs, short-chain fatty acids are formed by microbial fermentation of carbohydrates in the feed. Among these short-chain fatty acids propionate, isobutyrate, and valerate are the main contributors to gluconeogenesis.1 The relative contribution of glucogenic precursors changes during the different stages of lactation depending on feed intake, tissue mobilization, and energy balance. Quantitatively, propionate (60%–74%) is the most important glucogenic precursor, followed by lactate (16%–26%), alanine (3%–5%), valerate and isobutyrate (5%–6%), glycerol (0.5%–3%), and other amino acids (8%–11%).1,8
Lactate
Lactate can have an endogenous or exogenous origin. Rations based on high amounts of concentrates provoke a shift from a cellulolytic to an amylolytic flora in the rumen.9 This amylolytic flora is responsible for the production of lactate in the rumen, which can be used by the liver for glucose production.10 However, an overproduction of lactate may become detrimental to the health of the cow because of its low pH and concomitant higher risk of suffering from (sub)clinical ruminal acidosis. Another source of lactate is the anaerobe oxidation of glucose in the skeletal muscles and other peripheral tissues. During early lactation the expression of lactate dehydrogenase, the enzyme responsible for converting pyruvate into lactate, is upregulated, whereas the expression of the main enzymes of the citric acid cycle are downregulated in skeletal muscle. The latter indicates that the catabolism of glucose in skeletal muscle is diverted toward lactate production, indirectly supporting gluconeogenesis.11 At the end of pregnancy, the uterus and placenta are important sources of lactate.12 Therefore, the relative contribution of lactate in hepatic gluconeogenesis is maximal at the end of pregnancy and during early lactation.8,13
Glycerol
When adipose stores are mobilized, nonesterified fatty acids (NEFAs) and glycerol are released into the bloodstream. The fate of the NEFAs is well described in other reviews.14,15 The released glycerol can be used in the gluconeogenic pathway. Its contribution to gluconeogenesis and, hence, in the overall glucose production depends on the size of the fat depots and the amount of fat mobilization, and is thus directly related to the negative energy balance.8
Amino acids
Circulating amino acids provide another determinant in gluconeogenic pathways. Especially during periods of high glucose requirements, more amino acids are converted into glucose. The extra amino acids originate from intestinal absorption (higher feed intake), decreased protein synthesis in skin and skeletal muscles, and increased protein breakdown in skeletal muscles.8,16 The most important amino acids to contribute to glucose provision are alanine and glutamine.8
Glycogen
Glycogen stores in the liver and skeletal muscles provide a store of glucose in the body of the dairy cow. In periods of low glucose availability or high glucose requirements (end of pregnancy and early lactation), these stores can be mobilized. Only the glycogen stores in the liver can directly support the blood glucose level, because the liver is able to convert glucose-6-phospate into glucose. Skeletal muscles lack the enzyme, glucose-6-phosphatase, necessary for this conversion, therefore glycogen stores from skeletal muscle do not directly contribute to the blood glucose level.17 Because of the limited size of the glycogen stores in the liver, this glucose reserve is regarded as a minor contributor to the overall blood glucose regulation at the end of pregnancy and at the beginning of lactation.18–20 Glycogenolysis and glycolysis in skeletal muscle are upregulated at the initiation of lactation. In this period the oxidation of glucose in skeletal muscle is shifted in the direction of lactate. Because lactate can be converted to glucose by the liver, this shift in glucose metabolism within the skeletal muscle means that the muscular glycogen stores contribute indirectly to the blood glucose levels.11
Glucose Removal
Glucose uptake: a facilitated process
Glucose cannot pass the plasma membrane surrounding the cells.21 Glucose uptake takes place by 2 different processes: facilitated diffusion and cotransport. Cotransport is mediated by sodium-dependent glucose transporters (SGLT), and is driven by a difference in sodium concentration between the intracellular and extracellular fluid. The sodium-dependent glucose transporters are located at the epithelial cells of the small intestine and the tubular cells of the kidney.22 Most cells, however, take up glucose by facilitated diffusion via glucose transporter (GLUT) molecules. The uptake of glucose through these GLUTs is basically driven by the difference in glucose concentration between the extracellular and intracellular fluid.7,22 There are 13 different isoforms of the GLUTs, all of them having a specific tissue distribution, expression profile, and specific properties regarding sensitivity to hormones. The GLUT1 molecule is expressed in all tissues throughout the body and is responsible for basal glucose uptake.22 Of all the GLUT molecules, GLUT4 is the only one that is responsible for the insulin-stimulated glucose uptake in skeletal muscle, heart, and adipose tissue.22 The quantitatively most important glucose-consuming tissues are the skeletal muscles, the udder, and the gravid uterus.
Glucose uptake in skeletal muscle and adipose tissue
In skeletal muscle and adipose tissue, glucose is transported into the cells by GLUT1 and GLUT4 molecules. GLUT1 accounts for the basal glucose supply while GLUT4 mediates the insulin-stimulated glucose uptake.22,23 On insulin stimulation, intracellularly stored GLUT4s are translocated to and fused with the plasma membrane. The increased number of GLUT4s on the cell membrane is responsible for the insulin-induced blood glucose reduction.21 The previously mentioned lower insulin response of skeletal muscle and adipose tissue in ruminants compared with monogastric animals is partly due to the lower number and lower insulin-induced translocation of GLUT4s in these tissues in ruminants.7,23 Another typical feature in ruminants is that adipose tissue prefers to use acetate, a volatile fatty acid produced in the forestomachs, as a substrate for lipogenesis. Monogastrics use glucose for this purpose.5,24 Therefore, the adipose tissues in ruminants account for only a small part of the total insulin-induced glucose disposal.
To preserve sufficient glucose for fetal growth and development, homeorhetic changes in glucose metabolism take place throughout the body during pregnancy and lactation. At the level of the skeletal muscle and adipose tissue, glucose consumption is reduced. According to Komatsu and colleagues,25 GLUT4 mRNA expression was not altered in adipose tissue or skeletal muscle during lactation or the dry period. A recent study using Western blot analysis of skeletal muscle, however, revealed that GLUT4 content was reduced by 40% by the fourth week of lactation in comparison with the GLUT4 content during the dry period,11 suggesting a posttranscriptional regulation of GLUT4 mRNA in the skeletal muscle to reduce muscular glucose uptake in early lactation.
In adipose tissue, expression and protein content of GLUT1 and GLUT4 are minimal during peak lactation, and increase at the end of lactation to remain elevated during the dry period.25–27 This expression profile gives rise to a decreased basal and insulin-stimulated glucose uptake by the adipose tissue in early lactation, thereby sparing glucose for milk production. From these studies, it seems that homeorhetic changes at the level of the glucose metabolism of skeletal muscle and adipose tissue are regulated by different mechanisms.
Glucose uptake by the uterus, placenta, and fetus
The GLUT molecules responsible for glucose uptake in the ovine placenta are of the GLUT1 and GLUT3 isoform type.6 Only during the last trimester of pregnancy do uterine, fetal, and placental glucose requirements substantially increase the total glucose requirement of the dam.28 In sheep, this is associated with an increased number of GLUT3.6
In cattle, placental expression of GLUT1, GLUT3, GLUT4, and GLUT5 has been demonstrated.29–31 The expression of GLUT4 mRNA in placental tissue during early pregnancy is a new finding in dairy cows and had been demonstrated previously in humans. However, no direct evidence exists that insulin stimulates the glucose uptake by placenta in humans or cattle.31,32
Glucose uptake by the mammary gland
Glucose consumption of the mammary gland in dairy cows is responsible for 50% to 85% of whole-body glucose consumption, and amplifies the glucose demand by 2.5-fold at the third week of lactation in comparison with the demand during the end of the dry period.8,22,33 Seventy-two grams of glucose are needed to produce 1 kg of milk.34 This glucose is transported into the epithelial cells of the alveoli and is converted into lactose, creating an osmotic pressure that ultimately determines the amount of milk produced. The uptake of glucose into the bovine mammary gland is regulated by GLUT1, GLUT8, GLUT12, SGLT1, and SGLT2,22 GLUT1 being the most important. Its expression and protein content are almost undetectable during the dry period and increase severalfold at the initiation of lactation.22,25 The insulin independence regarding the mammary glucose uptake is further demonstrated by the absence of GLUT4 in the mammary gland.25
Glucose uptake by the liver
In nonruminants, the liver is an appreciable glucose consumer.35 Because of the sophisticated carbohydrate metabolism, the main function of the liver in ruminants is glucose production, with production rates increasing up to 3600 g per day during peak lactation.13 The GLUT isoforms responsible for the transport of glucose out of (and into) the hepatocytes are of the GLUT2 and GLUT5 type.35
Insulin resistance, insulin secretion, and diabetes mellitus: a necessary distinction
Definition of Insulin Resistance
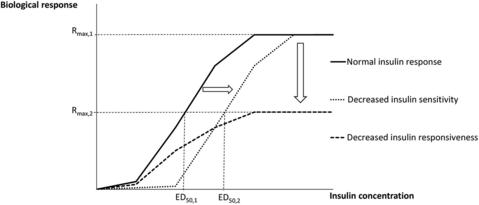
Insulin resistance is defined as a state whereby a normal concentration of insulin induces a decreased biological response in the insulin-sensitive tissues.36 Insulin resistance can furthermore be subdivided based on 2 distinct features: insulin sensitivity and insulin responsiveness. The maximal effect of insulin determines the insulin responsiveness. The concentration of insulin to elicit a half-maximal response determines the insulin sensitivity.36 Insulin resistance can hence be attributed to a decrease in insulin responsiveness (a downward shift of the insulin dose-response curve), a decrease in insulin sensitivity (a rightward shift of the insulin dose-response curve), or both (Fig. 2).36,37 Insulin resistance can be specific for certain tissues and for certain biological processes within these tissues.36,38
Insulin Secretion and Diabetes Mellitus
A further necessary distinction needs to be made between insulin resistance and deficient insulin secretion. Insulin resistance is determined by the response of the insulin-sensitive tissues to a normal concentration of insulin. Insulin secretion is determined by the secretory capacity of the pancreas in response to a factor that stimulates insulin secretion. Deficient insulin secretion does not entail an altered state of insulin resistance. The best way to explain this is by observing the difference between type 1 and type 2 diabetes in human medicine. Type 1 diabetes is caused by a destruction of the β cells of the pancreas, resulting in an absolute insulin deficiency. Patients with type 1 diabetes have no insulin secretion but can have normal insulin sensitivity and responsiveness of their tissues.39
The most common form of type 2 diabetes is caused by a combination of insulin resistance and a relative deficiency of insulin secretion. In the early phase of the pathophysiology of type 2 diabetes mellitus, insulin resistance occurs but the pancreas compensates for this by increasing the secretion of insulin, giving rise to a secondary hyperinsulinemia. If the insulin resistance is not ameliorated, the pancreas may become exhausted, which may lead to β cells failing to compensate for the increased insulin resistance. Relative to the degree of insulin resistance, the pancreas cannot produce enough insulin (relative insulin deficiency) and levels of blood glucose rise, thus type 2 diabetes develops.39–41 Insulin secretion in type 2 diabetes can be normal, but is insufficient to compensate for the higher degree of peripheral insulin resistance.
Diabetes mellitus has been described in young cattle and dairy cows.42,43 The role of insulin resistance in the development of diabetes in cattle is unknown, but diabetes mellitus is considered to be a rare endocrine disease in dairy cows owing to its irreversible nature. By contrast, the insulin-secretory capacity of the pancreas seems to be influenced by NEFAs in dairy cows. Bossaert and colleagues44 demonstrated a negative impact of chronically elevated NEFA levels on the insulin-secretory capacity of the pancreas. Similarly, lower insulin secretion following an intravenous glucose bolus has been demonstrated in ketonemic and starved cows.45–47 Opsomer and colleagues48 demonstrated blunted insulin secretion in cows suffering from cystic ovarian disease, suggesting a role of insulin in the pathogenesis of this ovarian disease in dairy cows.
Effect of insulin resistance in different tissues
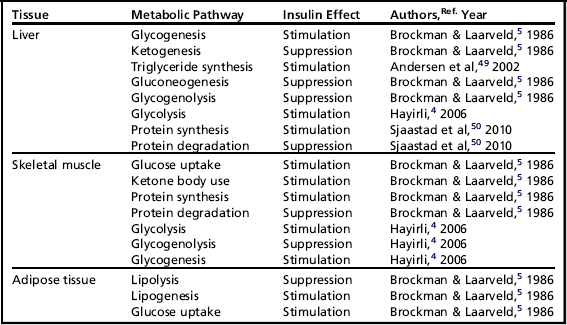
Insulin elicits different effects on the carbohydrate, lipid, and protein metabolism of different insulin-sensitive tissues (Table 1).
Besides these effects on glucose, amino acid, and lipid metabolism, insulin has some additional functions on several tissues throughout the body. In general, insulin is known to stimulate cell proliferation and differentiation.40 In the ovary, insulin stimulates steroidogenesis and the proliferation of granulosa cells, and hence influences follicular growth.51,52 Lower peripheral insulin levels have been associated with the development of ovarian cysts in postpartum dairy cows.53
Insulin-Stimulated Glucose Uptake by Skeletal Muscle and Adipose Tissue
General aspects of insulin-stimulated glucose uptake
Insulin-stimulated glucose uptake is probably the most intensively studied metabolic pathway of insulin in dairy cows. Based on the effect of insulin on this pathway, conclusions are drawn for other metabolic pathways, which may give rise to incorrect or at least insufficiently substantiated conclusions. In humans, skeletal muscles account for 80% of the insulin-stimulated whole-body glucose uptake, whereas adipose tissues contribute to only 5%.40 In dairy cows, where acetate is the major precursor of triglyceride synthesis, the skeletal muscles account for most of the insulin-stimulated whole-body glucose uptake.23 Therefore, glucose uptake in adipose tissue is limited in dairy cows.5 The fact that dairy cows are in a lactating and/or pregnant state means that a considerable amount of glucose is taken up by the pregnant uterus or the lactating udder. One should consider this carefully when comparing glucose-uptake experiments in cows at different stages of lactation or in cows with a different level of milk production.
Insulin resistance for glucose uptake by skeletal muscles and adipose tissues is a well-known feature in pregnant women, obese people, and people suffering from type 2 or gestational diabetes.40,54–57 Some of these metabolic states in humans show remarkable similarities with insulin resistance in cattle.58
Insulin resistance as homeorhetic mechanism during pregnancy and lactation
Nowadays it is generally accepted that dairy cows are insulin resistant at the end of gestation and in early lactation. These homeorhetic adaptations are necessary to ensure a sufficient glucose supply for the gravid uterus and lactating mammary gland in support of the growing offspring, both prenatally and postnatally.6 The adaptation toward an insulin-resistant state seems to be conserved in mammals among different species.
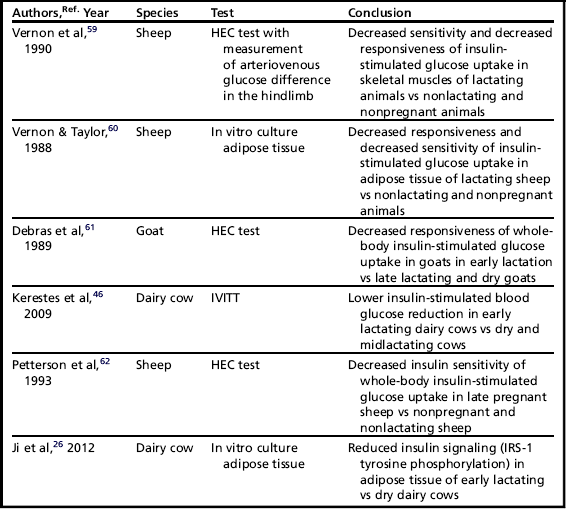
Different studies have been performed to assess insulin resistance in glucose metabolism during pregnancy and lactation in ruminants, and these are summarized in Table 2.
Adipose tissue and its derivatives
The adipose tissue and its derivatives undoubtedly play a crucial role in the determination and modulation of insulin sensitivity in the glucose metabolism of dairy cows. A first indication in this regard was given by McCann and Reimers in 1985.63 Using the intravenous insulin tolerance test (IVITT), they demonstrated a lower reduction of glucose in obese heifers when compared with lean heifers.
In the last decade, different researchers have focused on the role of NEFAs in the insulin sensitivity of dairy cattle. In experimental studies using nonpregnant and nonlactating dairy cows, an artificial elevation of circulating NEFAs following a fasting period or by the intravenous administration of a tallow infusion has been shown to cause an impaired insulin-stimulated glucose uptake by insulin-sensitive tissues.47,64,65 On the other hand, reduction of the NEFA load by means of abomasal delivery of nicotinic acid improved the insulin-stimulated glucose uptake.66
Other studies provided evidence for the extrapolation of these experimental results in practice. Overfeeding dairy cows during the dry period provoked an excessive condition score at parturition.67 In the dry period, these overfed cows showed higher peripheral levels of insulin in response to a glucose bolus, which may point to a higher insulin resistance of the peripheral tissues eliciting a secondary hyperinsulinemia at that time. In the subsequent lactation, these overfed cows showed prolonged elevated levels of NEFAs and a lower glucose clearance after an intravenous glucose tolerance test (IVGTT), indicating a higher degree of insulin resistance.68 In dairy cows suffering from different degrees of fatty liver, NEFA levels were negatively correlated with the insulin-stimulated reduction in blood glucose after an insulin challenge.69 In a study using cows suffering from different forms of ketonemia, the cows with chronically elevated concentrations of β-hydroxybutyrate (BHB) (more than 1 mmol/L from 2 days preceding calving until 7 days following calving) showed a higher insulin resistance in the glucose metabolism at their peripheral tissues. In the same study, a higher concentration of NEFAs was significantly correlated with a lower insulin secretion.46 These findings demonstrate an important role of NEFAs in the development of insulin resistance.
Underlying molecular mechanisms of fatty acid–induced insulin resistance are as yet unstudied in dairy cows but may be extrapolated from human medicine. The first mechanism is called the Randle cycle,70 or glucose-fatty acid cycle, which involves the biochemical mechanisms that control substrate (glucose or fatty acids) use in skeletal muscle, heart, liver, and pancreas. The Randle cycle postulates that when availability of fatty acids is abundant, the oxidation of the latter inhibits the use of glucose as substrate for the cellular metabolism. This process is mediated by different intracellular pathways: inhibition of pyruvate dehydrogenase, phosphofructokinase activity, and hexokinase activity, and decreased GLUT4 translocation in skeletal muscle.70 In addition, NEFAs induce the phosphorylation of insulin receptor substrate 1 (IRS-1) on serine residues. The serine phosphorylation of IRS-1 leads to a decrease in insulin-induced tyrosine phosphorylation of IRS-1, which is necessary for normal activation of the insulin signaling cascade.71
Besides NEFAs, other (unknown) factors originating from the adipose tissues also affect insulin-stimulated glucose uptake. As demonstrated in obese sheep, insulin sensitivity is decreased despite their NEFA levels being equally as high as those in lean sheep.72 In human medicine, the metabolic syndrome links visceral obesity, insulin resistance, dyslipidemia, and hypertension.57 Adipose tissue plays a central role in the development of the metabolic syndrome by increasing the production of proinflammatory adipokines (tumor necrosis factor [TNF]-α, interleukin [IL]-6, monocyte chemoattractant protein [MCP]-1) and decreasing the production of the anti-inflammatory adipokine, adiponectin.73 The final result of this altered production of adipokines is that obese people are considered to be in a proinflammatory state with the adipose tissue as primary site of inflammation.73 In dairy cows, the endocrine function of adipose tissue has been confirmed by demonstrating mRNA expression for TNF-α, IL-6, MCP-1, leptin, adiponectin, haptoglobin, visfatin, and resistin.27,74–78 The effect of these adipokines on insulin-stimulated glucose uptake by the skeletal muscle and adipose tissue is unknown in cattle, with the exception of TNF-α. Prolonged exposure to TNF-α by means of a series of subcutaneous injections induced insulin resistance in young steers and increased triglyceride concentration in the liver of dairy cows.79–81 Ohtsuka and colleagues69 concluded that cows suffering from fatty liver had higher serum concentrations of NEFA, were more insulin resistant, and had higher serum TNF-α activity. These observations, together with the study of O’Boyle and colleagues82 in which it was shown that overconditioned cows have higher plasma TNF-α concentrations, lead the authors to hypothesize that obesity in dairy cows may lead to a state of chronic low-grade inflammation, causing insulin resistance and metabolic disorders, and rendering these cows to hyperinflammatory reactions in cases where infections occur.
Stay updated, free articles. Join our Telegram channel

Full access? Get Clinical Tree


