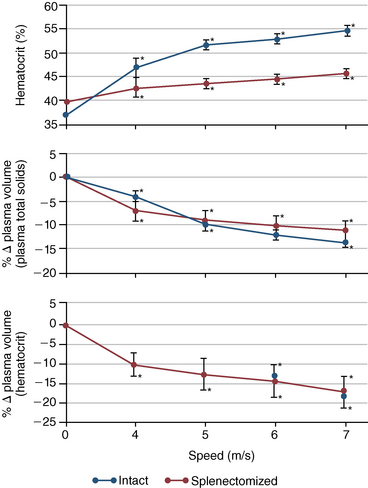
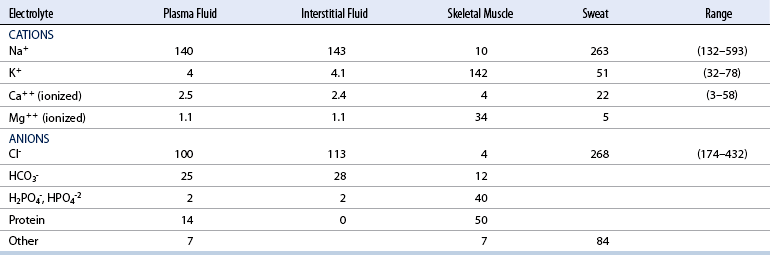
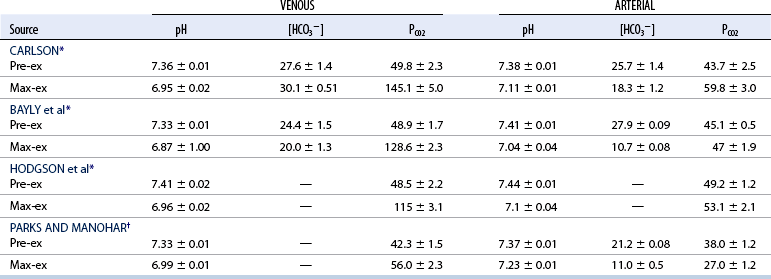
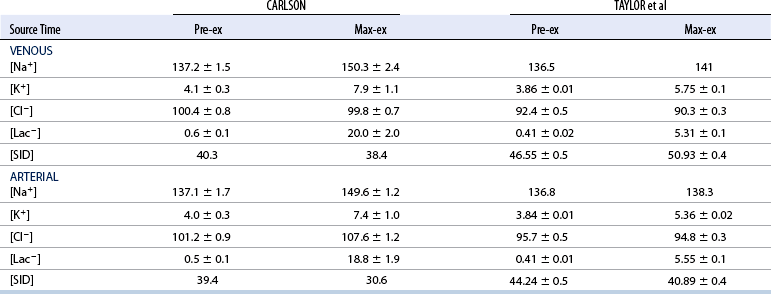
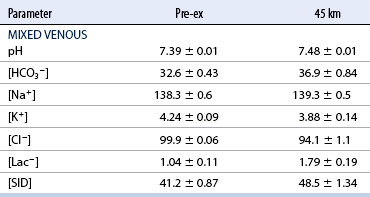
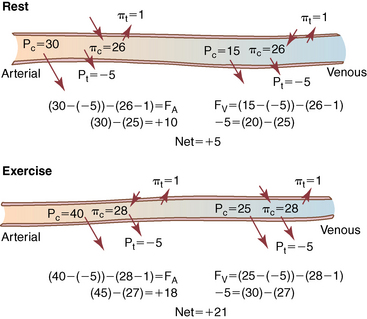
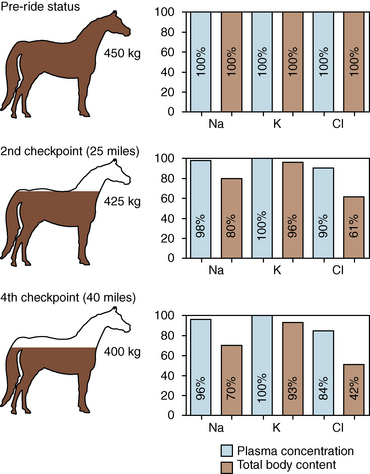
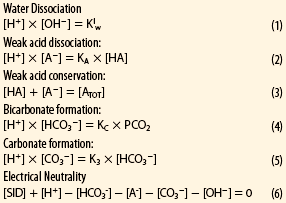
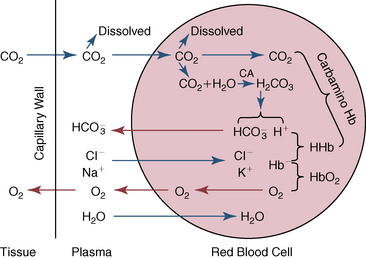
CHAPTER 6 Food of any specific nature provides the energy needed by any specific species to perform work. This work may be expressed as whole body movement, as the function(s) of individual physiologic systems within the body, or as processes inside a single cell. Regardless of the physiologic “level” at which work is performed, the major byproduct of the transduction of potential energy (food) into kinetic energy (work) is heat (see Chapter 8). Moreover, whether it is intracellular or total body work, the more work that is accomplished in a given period, the more heat is produced (Rowell, 1983; Rowell, 1993). The survival of the horse is dependent on its ability to eliminate body heat primarily through the evaporation of sweat (Carlson, 1983; Carlson, 1987; Schott and Hinchcliff, 1993; see Chapter 8). Core temperature in the horse can rise significantly in a matter of minutes. The mere digestion process can raise core temperature in the horse. In the exercising horse, core temperature can exceed 42°C in a matter of minutes. Intracellular heat generated in the horse must be moved to the periphery, where it can be dissipated to the surrounding air. Horses and humans are the only species with physiologic mechanisms in place to allow this process (sweating). Although sweating, in general, provides an efficient means of heat loss, it can also lead to significant fluid and electrolyte losses (Greenleaf and Morimoto, 1996). The magnitude of these losses is particularly great during exercise of long duration, exercise performed in environments of high temperature and humidity, or both. If uncompensated for, the loss of fluid and electrolytes can lead to thermoregulatory as well as cardiovascular instability (Rowell, 1983; Rowell, 1993) and ultimately death (Geor and McCutcheon, 1998; McConaghy, 1994; McKeever, 1997; McKeever, 2008; Schott and Hinchcliff, 1993). Therefore, an understanding of thermoregulatory mechanisms, as well as appropriate fluid and electrolyte ingestion, is imperative for anyone involved in training equine athletes. This chapter provides a review of the current literature on exercise, fluid balance, and renal function in the horse. As with all animals, the body of the horse is primarily composed of water. The total volume of water in the body is compartmentalized in two areas: (1) inside the cells (intracellular) and (2) outside the cells (extracellular). Carlson (1983; 1987) has done an exceptional job of reviewing these fluid compartments in the horse. Total body water (TBW) is typically estimated to be 50% to 70% of body weight. In a 500-kg horse, this translates into 250 kg to 350 kg of water weight (Carlson 1983; Carlson 1987; McKeever, 1998; McKeever, 2008). Direct measures of TBW may be obtained using various indicator dilution techniques, stable isotope techniques, and bioelectric impedance technologies (Carlson 1983; Carlson 1987; McKeever, 2008). Cell membranes provide a structural division of TBW into the intracellular fluid (ICF) compartment and the extracellular fluid (ECF) compartment (Carlson 1983; Carlson 1987; McKeever, 2008; Schott and Hinchcliff, 1993). Approximately two thirds (∼200 L) of TBW in the horse is ICF. The remaining third (∼100 L) resides in the ECF space. According to Carlson (1987), ECF is further compartmentalized into fluid contained within the vascular space, the ICF space, the lymphatics, and transcellular fluids. This last category includes the fluid content of the gastrointestinal tract, which of itself, represents a large reservoir of water (Carlson, 1987). The fluid occupying the vascular space is known as total blood volume (BV). The actual measure of BV not only includes fluid volume (plasma volume [PV]) but red blood cell volume (RCV) as well. Thus: BV = PV + RCV (Carlson, 1987). In the horse, resting BV varies from breed to breed, ranging from 61 milliliter per kilogram (mL/kg) in draft horses to 137 mL/kg in race horses (Carlson, 1987; McKeever, 1987; Persson, 1967). It is also affected by age, body composition, hydration status, and training status. In an average 500 kg horse at rest with a PCV of 0.40l/L, total BV would be about 40 L, PV about 24 L, and RCV around 16 L (Carlson, 1987; McKeever, 1987; Persson, 1967). Aerobic performance in the horse is greatly affected by BV. Oxygen delivery to, and uptake by, muscles is dependent on both the PV and RCV components of BV. Optimal PV is needed to ensure proper cardiac filling pressure (preload), and an optimal number of red blood cells (RBCs) must be in place to ensure proper arterial oxygen partial pressure (pO2). The elegant work of Persson (1967), as well as that of many others (McKeever et al., 1987; McKeever et al., 1993a; Rose and Hodgson, 1994), has shown that there is a strong relationship between RCV and aerobic performance in the horse. However, the interdependence of RCV with PV should not be overlooked. Blood flow can be affected by changes in viscosity. Thus, if RCV is high, PV is low, or both, the resulting increase in viscosity will slow blood flow and the delivery of oxygen to the working muscles. In the literature, values obtained for BV, PV, and RCV vary with the differing methodologies used to measure and calculate total blood volume. For the most part, studies in the horse have not relied on the direct measurement of BV. Instead, they have generally used dye or indicator dilution techniques to measure PV. The value for PV may then be used along with the hematocrit (HCT) value to estimate BV using the following formula (Formula 1) (Carlson, 1987; McKeever et al., 1987; McKeever et al., 1988; McKeever et al., 1993a; Rose and Hodgson, 1994;). Dye or indicator dilution techniques require the use of an indicator able to stay within the vascular compartment long enough to reach full steady state distribution without substantial removal by tissues. Ideally, this requires an indicator that binds to a large molecule that does not readily diffuse or transport out of the blood. Two substances commonly used to measure PV in the horse include Indocyanine Green dye (otherwise known as IC-Green or Cardiac green) and Evans Blue dye (Carlson, 1987). Caution must be exercised in the use of IC-Green to measure PV because of its rapid clearance (half life) from the vascular compartment. It is better suited for the repeated injections required during measurement of cardiac output. Conversely, Evans Blue dye binds to albumin and, thus, has a relatively long half life in the vascular compartment. However, albumin can shift out of the vascular compartment if there is an increase in hydrostatic pressure (Figure 6-1 and Figure 6-2). Therefore, measurement of PV using Evans Blue dye requires the horse to be standing quietly, unperturbed by exercise or pharmacologic manipulations during blood sampling (Carlson, 1987; McKeever et al., 1987; McKeever et al., 1988; Rose and Hodgson, 1994). FIGURE 6-1 Changes in hematocrit and plasma volume in the horse during incremental exercise. The second graph depicts the percent change in plasma volume calculated using plasma protein concentration (i.e., total solids). The third graph depicts the percent change in plasma volume calculated using hematocrit and the formula in Box 6-1. (Adapted from McKeever KH, Hinchcliff KW, Reed SM, et al: Role of decreased plasma volume in hematocrit alterations during incremental treadmill exercise in horses, Am J Physiol 265:R404, 1993a.) Anything that disturbs the steady state of the cardiovascular system will affect the distribution of Evans Blue dye. Nonsteady state sampling, particularly in studies employing exercise in their methods, has the potential to cause significant error in the measurement of PV and the resultant calculation of BV and RCV. Therefore, the results from studies reporting BV, PV, and RCV values calculated from postexercise injection samples should be viewed with caution. Injecting the marker after exercise may skew the data in two ways. First, due to increases in hydrostatic pressure, plasma volume can decrease 15% to 20% (see Figure 6-1) after only three 1-minute stages of an incremental exercise test (McKeever et al., 1993a; McKeever, 2004). Such a decrease would effect an artificially high concentration of the dye. Secondly, the same increases in hydrostatic pressure can cause the loss of dye from the vascular compartment due to exercise-induced extrusion of albumin (Carlson, 1987; McKeever et al., 1987; McKeever et al., 1988; McKeever et al., 1993a, 1993b). Another factor that must be considered in the calculation of BV in the horse is the splenic reserve volume. Most species retain a portion of their BV in the spleen. However, the spleen in the horse is a very capacious and capricious organ. When the horse is at rest, its spleen stores between 6 L and 12 L of blood (16% – 30% of BV) (Carlson, 1987; McKeever et al., 1993b; McKeever and Hinchcliff, 1995; Persson, 1967). In addition, this splenic blood has a typical hematocrit of about 70 to 80 (Carlson, 1987; Persson, 1967) compared with blood in the vascular tree with an HCT of 35 to 40. Thus, the calculation of BV in the horse becomes somewhat problematic. To account for the splenic reserve volume, most studies, to date, have used exercise or infusion of adrenaline or an alpha-agonist to cause splenic contraction and thus mobilization of the splenic reserve volume. Once mobilized, accommodation and mixing of this extra volume of blood (RBCs) takes only 1 to 2 minutes (Persson, 1967; Rose and Hodgson, 1994). However, the confounding factor in many studies is the change in hydrostatic pressure resulting from exercise or pharmaceutical manipulation. Although these are accepted viable methods to induce splenic contraction and estimate the contribution of the splenic reserve to the total circulating blood volume, if hematocrit samples are drawn after exercise, their values will be skewed upward due to the dynamic fluid shifts that occur with exercise (Persson, 1967; Rose and Hodgson, 1994). Therefore, the hematocrit value used to calculate total BV would reflect both the contribution of splenic reserve mobilization and reductions in plasma volume, resulting in an overestimation of BV. This is essentially an offset error that can be controlled for in a study’s methodology. Reductions in PV caused by exercise-induced fluid shifts (see Figure 6-1) are linked to exercise intensity (Carlson, 1987; McKeever et al., 1993a; McKeever et al., 1993b; McKeever and Hinchcliff, 1995). The comparison of HCTs only becomes a problem if a study’s experimental design employs different exercise intensities. For example, calculating BV using an HCT value obtained at the 10 meters per second (m/s) step of a treadmill test will yield a different result from hematocrit collected at the 11 or 12 m/s step. Therefore, comparisons of BV between treatment groups, or before and after training, must be based on HCT drawn following exercise of the same intensity. Resting PV can be determined by using Evans Blue dye. However, measurement of PV in the horse during exercise is problematic because of mixing time, the requirement for steady state conditions, and the potential for overwhelming the vascular space with dye through repeated injections. Percent changes in PV can be calculated using changes in protein (albumin) concentration (McKeever et al., 1993a). However, because some protein leaves the vascular compartment during exercise, this method tends to underestimate the reduction in PV (McKeever et al., 1993a). Studies with human athletes have addressed this problem by using changes in HCT rather than albumin to calculate changes in PV. This method is feasible because RBCs do not leave the vascular compartment like protein molecules do, and any change in their concentration must be due to changes in plasma volume (Dill and Costill, 1974; Harrison, 1985; Van Beaumont et al., 1972). For example, in humans, if the pre-exercise hematocrit (HCTb) is 43 and the postexercise hematocrit (HCTa) is 45, then the change in PV calculated using the formula in Box 6-1 is –7.9%. Absolute volume changes in liters are then calculated using the absolute pre-exercise resting PV determined using Evans Blue dye (Dill and Costill, 1974; Harrison, 1985; Van Beaumont et al., 1972). However, it is important to note that the use of this formula requires that there be no addition of RBCs to the central circulation or change in the size of the cells (Dill and Costill, 1974; Harrison, 1985; Van Beaumont et al., 1972). In humans, neither of these factors is a problem if the exercise duration is less than 120 minutes (Harrison, 1985). In the horse, the addition of splenic RBCs to the central circulation during exercise makes the use of this formula problematic. Fortunately, McKeever and coworkers (1993a), who employed splenectomized horses, developed a correction factor for this splenic contraction. They demonstrated that the spleen contracts very rapidly with the onset of exercise and that both the extruded PV and RBCs accommodate with the central circulation within the first 90 seconds of exercise. Changes in HCT from the point of full mixing onward were parallel in splenectomized and intact horses. Therefore, from 2 minutes into exercise and beyond, changes in HCT were caused by decreases in PV in both groups (McKeever et al., 1993a). This meant that the difference between pre-exercise and 2-minute values for HCT in intact horses represented a splenic reserve offset that could be used as a correction factor (McKeever et al., 1993a). BOX 6–1 Calculation of the Percent Change in Plasma Volume Using Corrected Hematocrit in Horses* From McKeever KH, Hinchcliff KW, Reed SM, et al: Role of decreased plasma volume in hematocrit alterations during incremental treadmill exercise in horses, Am J Physiol 265:R404, 1993a. Box 6-1 demonstrates the use of HCT to calculate percent changes in PV in the horse. If a horse has a resting hematocrit (HCTb) of 35, and the hematocrit measured at 2 minutes of exercise (HCT2min) is 55, then the difference between the two would be the correction factor (HCT2min) applied to all the hematocrits drawn after 2 minutes. In Box 6-1, if the uncorrected hematocrit (HCTraw) was 58, then the value for HCTa to be used in the calculation of PV would be obtained by subtracting the correction factor (HCT2min) from the uncorrected hematocrit (HCTraw). Osmolality is the total number of dissolved particles in solution, independent of the elemental species making up that solution (Johnson, 1998; Wade et al., 1989). The term osmolality is applied when the solute is expressed as weight (kg). Thus, osmolality is the number of osmoles (Osm) of solute per kilogram (kg) of solvent or (Osm/kg). In living organisms, the solvent is expressed in terms of volume (liters). The relationship is the same, but the term is changed to osmolarity (Osm/L). Normal plasma osmolarity in the horse and most other mammals averages 290 mOsm/L and is a reflection of the dissolved particles in both ICF and ECF spaces (Carlson, 1987; Wade et al., 1989). Plasma osmolarity plays a key role in maintaining a normal intracellular environment, a factor that is vital for cellular function (Carlson 1987; Greenleaf and Morimoto, 1996; Nadel et al., 1993; Wade et al., 1989). All of the electrolytes contribute to osmolarity by affecting the osmotic concentrations in the various fluid compartments of the body. Sodium (Na+) is the major cation in the ECF space, making it the greatest contributor to osmolarity (Carlson, 1987; Greenleaf and Morimoto, 1996; Nadel et al., 1993; Wade et al., 1989). This large molecule in solution exerts osmotic force across semipermeable membranes such as capillaries and cell membranes. This force, or “osmotic pull,” is exerted by the sum of freely moving particles in solution exerting an effect on water in surrounding tissues (Johnson, 1998; Szlyk-Modrow et al., 1996). Because water tends to move down a gradient from an area of low concentration to an area of high concentration, an increase or decrease in plasma [Na+] (osmolarity) has the capacity to cause large fluid shifts out of or into the cells. These fluid shifts can dramatically alter normal cellular function. Since a change in osmolarity reflects expansion or contraction of the extracellular fluid compartment, cardiovascular function may be affected as well (Johnson, 1998; Szlyk-Modrow et al., 1996). Extracellular fluid volume serves as one of the first lines of defense in the regulation of cardiac filling volume and mean arterial pressure. A negative change in osmolarity can negatively affect these hemodynamics, thereby ultimately affecting the ability to perfuse the tissues (Nose et al., 1988; McKeever, 2008; McKeever and Hinchcliff, 1995). Potassium is the primary cation found within the cells; however, calcium and magnesium are additionally important to intracellular functions (Carlson, 1987; Greenleaf and Morimoto, 1996). Calcium within the tubular sarcoplasmic reticulum of muscle cells plays a vital role in excitation contraction coupling (muscle contraction). Magnesium is an important cofactor in many of the reactions involved in cellular metabolism (Carlson, 1987; Kingston and Bayly, 1993; McKeever, 1997). Major extracellular anions in the body include chloride, bicarbonate, and the phosphates (Carlson, 1987; Kingston and Bayly, 1993; McKeever, 1997; McKeever, 2008). Normal values for resting concentrations of the major electrolytes found in plasma, interstitial fluid, intracellular fluid, and sweat are listed in Table 6-1. These concentrations are tightly regulated to prevent cellular dehydration or swelling (edema). TABLE 6–1 (Adapted from Schott HC, Hinchcliff KW: Fluids, electrolytes, and bicarbonate, Vet Clin North Am: Equine Pract, 9(3):577-604, 1993.) Thermoregulation during exercise in the horse can result in a tremendous volume of fluid loss (hypertonic sweat). Thus, maintaining the fluid volume and solute composition of the intercellular and extracellular body compartments becomes a serious challenge (Carlson, 1983; Carlson 1987; McKeever and Hinchcliff, 1995). Compromised cellular function and cardiovascular stability (Wade and Freund, 1990) are serious considerations. Therefore, it is vitally important that plasma osmolarity be regulated within very narrow limits. The regulation of osmolarity is intertwined with the defense of ECF volume, PV, and cardiac filling pressure. Thus, its regulation involves an integrative response of multiple systems, including the cardiovascular, neural, endocrine, and renal systems (McKeever et al., 1993a); McKeever and Hinchcliff, 1995; Rowell, 1993; Wade and Freund, 1990). Changes in plasma osmolarity are sensed by specialized cells within the supraoptic and paraventricular nuclei of the hypothalamus in the brain (McKeever and Hinchcliff, 1995; Wade et al., 1989; Wade and Freund, 1990). These osmoreceptors can detect changes in plasma osmolarity as small as 2 mOsm/L that, in turn, evoke a rapid change in the synthesis and secretion of the hormone arginine vasopressin (antidiuretic hormone [ADH]) by the posterior pituitary. Within minutes, an increase in vasopressin concentration causes renal reabsorption of water, thus correcting the volume deficits and alterations in electrolyte concentration suffered through the sweating process (Convertino et al., 1981; Wade and Freund, 1990). In addition, vasopressin stimulates thirst. The addition of water through drinking also has a positive effect on fluid balance and osmolarity (Wade and Freund, 1990). When considering the effects of acute exercise on key electrolytes, changes in concentration must be distinguished from changes in total content (McKeever et al., 1993c; Van Beaumont et al., 1972). By definition, the concentration of a substance is the amount of solute in a given volume of solvent. Content, in contrast, is the total amount of that solute in the fluid compartment or body, depending on the focus of analysis. For example, if the normal plasma concentration of sodium is 140 milliequivalents per liter (mEq/L), then the plasma content of sodium would be obtained by multiplying its concentration by the total plasma volume (McKeever et al., 1993c; Van Beaumont et al., 1972). Calculating content change for an electrolyte will determine if the corresponding change in its concentration is caused by the addition or loss of the electrolyte itself or is the result of changes in plasma volume. When measured for the whole body, changes in content provide insight into how electrolyte concentrations are affected through routes of intake and loss. This is of particular interest when the changes are acute because of the stress imposed by exercise. Studies with human athletes have long used key formulas to calculate the total amount of specific electrolytes lost from the vascular compartment during exercise (Box 6-2) (Dill and Costill, 1974; Harrison, 1985; Van Beaumont et al., 1972). An example of their use would be in the examination of sodium losses during short-term exercise versus long-term exercise. Plasma sodium concentration is held within very narrow limits. During short-term exercise, these concentrations undergo minimal changes. However, the plasma content of sodium does show a decrease. In exercise of long duration, changes in plasma sodium concentration may still be minimal, but the changes in content are dramatic (Figure 6-3). These results suggest the fluid shifts that occur during exercise are, in part, caused by isotonic shifts (McKeever et al., 1993c; Schott and Hinchcliff, 1993). BOX 6–2 Calculation of Percent Change in the Content of a Plasma Constituent using Corrected Hematocrit From McKeever KH, Hinchcliff KW, Reed SM, et al: Splenectomy alters the hemodynamic response to incremental exercise in the horse, Am J Physiol 265: R409, 1993b. Chloride concentrations, like sodium, are held within very narrow limits. However, in the case of this ion, due to large amounts lost in the sweat, there is a dramatic disproportional decrease both in its plasma concentration and its content (McKeever et al., 1993c; Schott and Hinchcliff, 1993). When considering potassium, the picture is just the reverse. Both the plasma concentration and content of potassium increase during high-intensity exercise. The measured increase in content allows for an accurate interpretation of the increase in concentration, being that it is caused by both loss of plasma fluid and addition of potassium to plasma when it “leaks” out of the contracting muscle cells. One of the benefits in measuring the plasma content of electrolytes is the knowledge it provides toward the dietary supplementation of electrolytes to replace their exercise-related losses. When considering the effects of exercise on fluid balance and the internal environment of the body, changes in acid–base status must be considered as well. Blood pH is tightly regulated with small changes creating dramatic physiologic outcomes. In the horse, short-duration, high-intensity exercise creates a metabolic acidosis resulting in a decrease in pH from resting values of 7.4 to levels as low as 6.8. In contrast, there is an increase in pH during submaximal endurance exercise, rising up to 7.8. Among those variables that are closely linked to changes in pH are the dynamic alterations in ICF and ECF and electrolyte homeostasis that occur with work. In the case of either high-intensity or submaximal exercise in the horse, changes in pH have been linked to changes in the major strong ions that are altered by increases (from rest) in workload. The major cations and anions are independent variables that contribute to the disturbances, and then the rapid restoration, of pH during and following the challenge of exercise (Lindinger and Waller, 2008). There have been many papers published on the effect of acute exercise on whole body acid–base status in the horse (Kingston and Bayly, 1998; Lindinger and Waller, 2008). A large number of them have reported data obtained using the Henderson-Hasselbach equation, where pH = pKa + log [HCO3–]/CO2 (Kingston and Bayly, 1998; Lindinger and Waller, 2008). The independent variables (PaCO2 and [HCO3–]) are easily measured by using a blood gas analyzer. This method can determine if there is alkalosis or acidosis in the body and whether the change in pH is metabolic or respiratory in origin. A change in the [HCO3– ] in the numerator of the Henderson-Hasselbach equation indicates that the change in pH is caused by metabolic factors such as the rapid rate of adenosine triphosphate (ATP) hydrolysis that occurs with high-intensity exercise or the excessive chloride losses associated with a lengthy submaximal session of work. If the change in pH is due to a change in the PaCO2, then the mechanism for the alteration is considered respiratory in origin (Lindinger and Waller, 2008). The major disadvantage to the Henderson-Hasselbach method is the qualitative nature of the information it derives with regard to exercise-related acid–base status. This limitation has led researchers to seek more quantitative methods for determining the physiochemical mechanism behind exercise-induced changes in pH. A quantitative method developed by Stewart (1981) simultaneously takes into account the variables measured in the Henderson-Hasselbach equation, along with the interplay needed to achieve equilibrium in the carbon dioxide system (Figure 6-4), the weak acids, and the strong ions (Box 6-3). The regulated dependent variables are [H+] and [HCO3– ]. The independent variables measured for their effect on [H+] and [HCO3–] include the PaCO2, the Atot (weak volatile acids, primarily plasma protein), and the strong ion difference (SID). There are many strong ions that contribute to the SID; however, most exercise-related studies focus on sodium, potassium, chloride, and lactate. Thus, SID = [(Na+ + K+) – (Cl– + LA–)] (Constable, 1997; Kingston and Bayly, 1998; Lindinger and Waller, 2008). In the Stewart approach, pH decreases when the SID decreases. The opposite occurs when the SID increases with the horse becoming alkalotic. Some consider the Stewart approach cumbersome because it requires simultaneous measurement of several independent variables. However, the quantitative data gained through this method lend much greater insight into the relative contribution of multiple factors in the regulation of acid–base status. High-intensity, short-duration exercise results in a dramatic metabolic acidosis in the horse (see Table 6-1 and Table 6-2). Blood pH can drop from 7.4 (resting) to 6.8, and bicarbonate or total carbon dioxide (tCO2) concentrations can show an increase of up to 10 mmol/liter from their normal resting concentrations (Kingston and Bayly, 1998; Lindinger and Waller, 2008). Following exercise, there is a rapid return to resting values in pH, bicarbonate, and tCO2 concentrations, usually within 90 minutes. The respiratory compensation for metabolic acidosis is mechanistically different in the horse compared with humans. In humans, the hyperventilation observed at the ventilatory threshold is part of the mechanism for regulating pH through the elimination of CO2 (Lindinger and Waller, 2008). However, while VCO2 increases in the horse during exercise, the rate of elimination is inadequate because the horse does not hyperventilate during exercise. This is a species related difference that results in the well-recognized hypercapnea associated with high-intensity work in the horse. Coincident with the retention of CO2 in the horse are the dramatic decreases in pH (Lindinger and Waller, 2008). TABLE 6–2 Summary of Selected Studies Showing the Effects of Maximal Exercise on Acid–Base Parameters *Corrected to pulmonary artery temperature. †Corrected to rectal temperature. Adapted from Kingston JK, Bayly WM: Effect of exercise on acid–base status of horses. In Hinchcliff KW, editors: Vet Clinics of North America: equine practice: fluids, electrolytes and thermoregulation in horses, Philadelphia, 1998, WB Saunders, p 61. A portion of the drop in pH can be attributed to a dramatic change in SID during high-intensity exercise in the horse (Constable, 1997; Kingston and Bayly, 1998; Lindinger and Waller, 2008). This change in SID is caused by transient changes in plasma electrolyte concentrations (Table 6-3). In races covering distances between 1200 m and 2400 m, changes in electrolyte and acid–base status are associated with increases in the concentrations of Na+, K+, Cl−, and LA−, all of which affect SID. High-intensity exercise also results in an increase in plasma protein concentration by two routes: (1) the loss of plasma water, and (2) the addition of plasma protein due to splenic reserve mobilization. TABLE 6–3 Summary of Selected Studies Showing the Effects of High–Intensity Exercise on Plasma Strong Ion Concentrations* Lac, lactate; max-ex, maximal exercise; pre-ex, pre-exercise; SID, strong ion difference. *All values are expressed as milliequivalents. (Adapted from Schott HC, Hinchcliff KW: Fluids, electrolytes, and bicarbonate, Vet Clin North Am: Equine Pract, 9(3):577-604, 1993.) During high-intensity exercise, plasma sodium concentration increases because of movement of water out of the vascular compartment and the extracellular space. Despite this increase, and the concomitant increase in plasma protein, there is no change in chloride concentration (Constable, 1997; Kingston and Bayly, 1998; Lindinger and Waller, 2008). This may reflect the effect of the chloride shift (see Figure 6-4) that is part of the bicarbonate system in the RBCs. It may also be a reflection of the large increases in the other strong anion, lactate. This anion is exchanged along with chloride across the muscle cell membrane. Similar to sodium, plasma potassium concentration increases during high-intensity exercise, reaching values greater than 10 mmol/L (Constable, 1997; Kingston and Bayly, 1998; Lindinger and Waller, 2008). However, the increased plasma potassium is transient, returning to the normal resting range within minutes after maximal exercise. Mechanistically, an accumulation of H+ in active muscle impairs the sodium-potassium-adenosine triphosphatase (Na+– K+ -ATPase) pump, which, in turn, decreases the reuptake of K+ by the fibers. The functional significance of this flux of K+ is a decrease in muscle membrane potential, which may contribute to fatigue during high-intensity exercise. During endurance exercise, changes in acid–base status are related, in part, to the tremendous amounts of sweat lost by the horse during prolonged bouts of work. In hot conditions, a horse competing in an endurance ride may lose up to 10% of its body weight. Even more critical is the fact that the sweat of the horse is hypertonic compared with the plasma. This differs from humans, in whom the composition of sweat is hypotonic to the plasma (Kingston and Bayly, 1998). The functional significance of this species related difference may be related to thermoregulation. In the horse, the surface area to body mass ratio is less optimal than that of humans. Thus, the extra salt in the sweat enhances solvent drag and alters the vapor point of the solution as well. Some have suggested that this means the horse can get sweat onto the skin for faster evaporation, thus increasing the rate of cooling. However, the magnitude of the accompanying electrolyte losses can be substantial, having a significant effect on whole-body SID and, consequently, acid–base status (see Figures 6-3A and 6-3B; Table 6-4). TABLE 6–4 The Effects of Prolonged Low–Intensity Exercise (40% 45 km, at the end of 45 km; Lac, lactate; pre-ex, pre-exercise; SID, strong ion difference. *All values are expressed as milliequivalents. (Adapted from Schott HC, Hinchcliff KW: Fluids, electrolytes, and bicarbonate, Vet Clin North Am: Equine Pract, 9(3):577-604, 1993.) The flux, as well as the losses, of major anions and cations varies between individual animals. Plasma sodium concentration varies with the duration of exercise and the environmental conditions. Different studies have reported an increase in concentration, no change, or a decrease in concentration (Kingston and Bayly, 1998). In many cases, there is an initial isotonic shift of fluid from the vascular compartment to the interstitial space, followed by losses of sodium and water as exercise progresses for an extended time. Potassium concentration increases because of a loss of plasma water and leakage of potassium from the ICF compartment to the ECF compartment. However, when it comes to electrolyte losses during endurance rides, the horse encounters a disproportional loss of chloride. Although changes in sodium and potassium concentrations can contribute to changes in acid–base status through their collective alterations in SID, the chloride loss seen in the horse has the most pronounced effect. Chloride losses during endurance exercise exceed sodium losses, making it the principal anion lost in the sweat. During endurance exercise, the observed decreases in plasma chloride concentration can exceed 15 mmol/L (Kingston and Bayly, 1998). This loss of chloride ions can lead to the renal retention of bicarbonate, which results in metabolic alkalosis. If the chloride losses are substantial, this renal effect on acid–base status can increase bicarbonate concentrations by up to 5 mmol/L (Kingston and Bayly, 1998). These documented changes during long-duration exercise in the horse have led to the conclusion that administration of bicarbonate, either as a treatment or as a feed supplement, is contraindicated for this group of equine athletes.
Physiology of acid–base balance and fluid shifts with exercise
Body fluid compartments


Plasma osmolarity and the concentration of key electrolytes
Plasma concentration versus plasma content


Electrolytes and acid–base status
Maximal exercise
Low–intensity exercise
 O2max) on Plasma pH; Lactate, Na+, K+, and Cl− Concentrations; and Strong Ion Difference in Six Thoroughbred Horses Exercised over 45 km*
![]()
Stay updated, free articles. Join our Telegram channel

Full access? Get Clinical Tree


