Fig. 1.
(a) Light source (Olympus, Tokyo, Japan) with an attachment of optic fiber. (b) The attachment of optic fiber handmade of plastic syringes and pipettes. (c) Schematic drawing of the tip of the optic fiber. The diameter is 0.5 mm. (d) Spherical lighting from the optic fiber. (e) Position of the optic fiber and stereotaxic frame. (f) An optic fiber stereotaxically implanted to rat.
2.3 Histopathology and Blood–Brain Barrier Changes
For light microscopy, the animals were reanesthetized with 4% isoflurane and transcardially perfused with 4% paraformaldehyde in 0.1 mol/L phosphate-buffered saline (pH 7.4). The fixed brains were removed and kept in 4% paraformaldehyde for 6 h. A coronal slab of brain tissue containing the center of the lesion was cut, embedded in paraffin, sectioned, and prepared for hematoxylin and eosin staining. Electron microscopy was also performed on caudate tissue from the rats at 4 h after photothrombosis. The animals underwent transcardiac perfusion with 4% glutaraldehyde. Specimens containing the photothrombosis-induced lesion were excised, embedded in epon, and prepared for ultrastructural examination. For the assessment of blood–brain barrier change, the animals were anesthetized and injected with Evans Blue solution (2 mL/kg, 2% in saline). After 1 h, brains were removed and cut coronally (1-mm-thick) on a brain-slicing matrix at the level of optic fiber implantation. The coronal section was stained with 2,3,5-triphenyl tetrazolium chloride to visualize the area of mitochondrial dysfunction and Evans blue leakage.
2.4 Neurological Deficits
Neurological deficits were examined in gerbils by the recording of open field locomotion. The animals were placed in an open field 90 cm × 90 cm in size and their spontaneous locomotion was traced with a video-tracking system (PanLab, Barcelona, Spain) for 5 min, and length of stay in the center and the periphery, both equal to 50% of total area, of open field was calculated.
3 Model Characteristics
In our hands, the mortality rate was zero in these stroke models. The blood gases and blood pressure were stable and within the normal range. At 24 h after light exposure in the basal ganglia model, an oval, lightly stained, ischemic lesion was present in the caudate around the tip of the optic fiber (Fig. 2a, b). Histologically, the lesion was an ischemic infarction (Fig. 2c). Four hours after photothrombosis, many thrombosed microvessels with pyknotic and eosinophilic neurons and numerous microvacuoles were seen in the lesion (Fig. 2d, f). Electron microscopy revealed platelet thrombus formation within parenchymal small vessels (Fig. 2e). The lesion became infarcted at 24 h after photothrombosis.
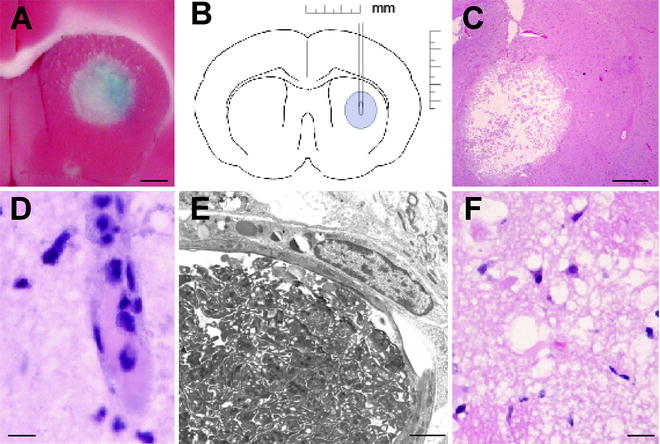
Fig. 2.
(a) An example of 2,3,5-triphenyl tetrazolium chloride staining 1 day after photothrombosis (bar = 1.0 mm). A round lesion indicative of infarction is seen in the center of the caudate nucleus. Evans blue was injected intravenously as a tracer of blood–brain barrier opening before sacrifice and an area of blue staining is seen within the lesion. (b) Schematic drawing of the stereotaxic placement of the optic fiber in the caudate nucleus. (c) Typical lesion 1 day after photothrombosis (hematoxylin and eosin staining; scale bar = 1.0 mm). (d) A small thrombosed blood vessel (about 10 μm diameter) 4 h after light exposure (bar = 5 μm). (e) Typical electron micrograph of a large microvessel within the periphery at 4 h after ictus filled with platelets and are surrounded by swollen perivascular end-feet of astrocytes (bar = 50 μm). (f) Histology 4 h after light exposure demonstrating neuronal pyknosis and microvacuolation (bar = 5 μm).
Histological changes after cortical photothrombosis were identical to caudate photothrombosis (Fig. 3). Control animals developed no tissue injury except for that caused by the needle track.
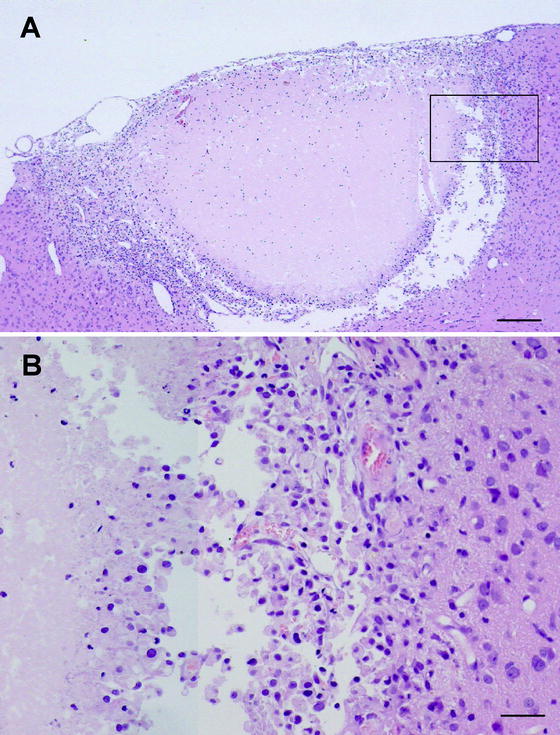
Fig. 3.
(a) Typical lesion 4 days after cortical photothrombosis. Coronal section of the lesion showing central infarction and lesion periphery (hematoxylin and eosin staining; scale bar = 0.2 mm). (b). Higher magnification of the infarction periphery (square in Fig. 3a) demonstrating a layer of pyknotic neurons and microvacuolation (bar = 50 μm). These changes are identical to those seen after caudate infarction.
Recording of locomotion in gerbil after photothrombosis revealed different pattern and distribution between caudate and cortical lesioning. The trace showed circulation after caudate photothrombosis (Fig. 4a). The animal moved evenly both in the center and periphery of the open field. After cortical photothrombosis, the animal developed linear locomotion mainly in the periphery of the open field (Fig. 4b).
 < div class='tao-gold-member'>


Only gold members can continue reading. Log In or Register to continue
Stay updated, free articles. Join our Telegram channel
Full access? Get Clinical Tree
