Fig. 1.
Approximate operating ranges for rods, cones and melanopsin ganglion cells (GCs). The high sensitivity rod pathway saturates at relatively low light levels; however, recent work suggests that in light-adapted conditions new undefined rod pathways can play a role in non-image forming responses at high irradiances (indicated by the dashed green line) (1).
Table 1
Peak sensitivity of rodent photoreceptor opsins
Opsin | Peak sensitivity (nm) | Reference |
|---|---|---|
Rod | 498 (rats, mice) | (2) |
Long wavelength cone | 508 (mice), 509 (rats) | |
Short wavelength cone | 360 (mice), 358 (rats) | |
Melanopsin | 479 (mice), 484 (rats) |
In this chapter, we describe seven methods to probe the functionality of the visual systems in rodents. Together, these approaches can allow one to elucidate the photoreceptive systems that are functioning, and also gain insight into whether light is perceived at both cortical and sub-cortical levels (Table 2).
Table 2
Summary of the visual system brain regions that are involved in, or that can be recorded by, each technique
Visual system region | ||||
|---|---|---|---|---|
Retina | Midbrain | Hypothalamus/thalamus | Visual cortex | |
Electrical recordings | + | + | + | + |
Optical imaging | + | + | ||
Functional anatomy | + | + | + | + |
Wheel running | + | + | ||
Pupillometry | + | + | + | |
Optokinetic head-tracking | + | + | + | +a |
Behavioural light aversion | + | + | + | + |
2 Electrical Recordings of the Visual System
Sensory information in the nervous system is processed and transmitted through electrical signals. Electrophysiological techniques aim to measure these signals using different visual stimulation protocols at various locations and spatial scales to understand the function of the visual system. Most components required to record electrical signals are the same across various electrical visual function modalities.
2.1 Electroretinography
Electroretinography (ERG) is a well-established non-invasive technique used to diagnose patients with retinal degeneration or in animal studies. When a light stimulus impinges on the retina, a flow of extracellular current is initially generated at the photoreceptors and subsequently in other retinal cell types. Given the parallel arrangement of the retinal layers, extracellular currents will only be aggregated in the radial direction while lateral currents will be cancelled out. This current can be measured using extraocular electrodes in the form of a small potential and it is commonly known as the electroretinogram (ERG). Therefore, while the ERG originates from many different cells types and layers within the retina it is represented by a single electrical trace. The ERG trace is made of a combination of signals giving rise to several characteristic peaks and troughs within the initial hundreds of milliseconds after stimulus onset (Fig. 2). These characteristic features of the ERG response are used as indicators to estimate the functional condition of the retinal cells that give rise to them. We only describe here those components that are most commonly used in rodent studies.
Fig. 2.
ERG components: a-wave, b-wave, and oscillatory potentials (OPs). Top trace shows an ERG recording from a mouse following a single flash of broad spectrum light in a dark adapted condition. Medium trace shows the same ERG response as in the top picture after filtering out the OPs. Bottom trace shows the OPs obtained from the top trace after filtering out the a-wave and b-wave components.
1.
The a-wave
Following light absorption by the photoreceptor outer segments a chain reaction is initiated leading to the neurotransmitter release in their synaptic terminals. Blocking synaptic transmission using l-glutamate suppresses subsequent neural activity while leaving intact the photoreceptor response. Under this condition, a negative potential is generated in the initial tens of milliseconds following stimulus onset, while the subsequent positive-going signal is abolished. The a-wave component corresponds to this initial negative component of the ERG trace and is therefore considered to be a direct reflection of photoreceptor activity.
2.
The b-wave
Following the a-wave, a positive signal appears in the ERG trace reaching a maximum before it declines. This component of the ERG is called the b-wave. The b-wave is abolished in mGluR6 knockout mice (11) or by pharmacologically blocking (12) the mGluR6 receptor. Given that mGluR6 receptors are specific to ON-centre bipolar cells, the b-wave is considered to be generated by this type of cell. Additional studies have also shown that the amplitude and latency of the b-wave is modulated by third order neurons (13).
3.
Oscillatory potentials
At bright stimulus intensities, the ERG trace shows high frequency wavelet components in the 100 Hz range on the ascending part of the b-wave known as the oscillatory potentials (OPs). The OPs can be separated from the a-wave and b-wave by using a band-pass filter between ∼80 and 150 Hz. Dopaminergic amacrine cells appear to be involved in generating this component of the ERG and it appears to be affected in retinal degenerations both in human and rat models of retinal disease.
2.2 Brain Electrophysiology
1.
Visual Evoked Potential (VEP)
Visual-evoked potentials are a gross measure of neural activity. Although borders of the active region cannot be clearly defined using this technique, the amplitude and latency of the response have been used clinically to assess visual function. Since the visual cortex lies at the surface of the brain, an evoked electrical response can be detected non-invasively simply by placing a low impedance electrode on the surface of the skull or epidurally. The ability of the visual system to resolve a certain type of visual stimulus at the level of the visual cortex can then be assessed using VEPs (14). As in the ERG, a judicious choice of visual parameters can be used to determine the cortical response of the different visual pathways.
2.
Extracellular electrophysiological recordings
Electrophysiological responses at the cellular level can be examined by inserting a small electrode made of metal (tungsten or platinum-iridum) insulated with thin glass into the brain. The tubing is filled with an electrolytic solution to allow electrical contact between the neural tissue and the electrode. There are also metal electrodes with a small conductive area that can be directly inserted in the brain without the glass tubing. There are commercial electrodes that allow multiple recordings across its length (channels) with the additional option of arranging several of them in a spatial array (Neuronexus, Ann Arbor, MI, USA). Extracellular recordings give an indication of the electrical activity of surrounding neural tissue.
3.
Local field potential
As a result of an action potential, the presynaptic neuron releases glutamate at a synapse onto the postsynaptic neuron. This leads to the opening of glutamate receptor channels resulting in a net flow of current inside the neuron. An extracellular electrode detects this as a negative potential. A nearby electrode of approximately 1 MΩ impedance is able to measure this potential known as the local field potential (LFP). It is generally assumed that the LFP reflects the incoming electrical signal and local neural processing of tissue up to a couple of millimetres surrounding the electrode (15). In order to extract this signal, a band-pass filter between ∼1-300 Hz is applied to the electrical recording. Figure 3 shows an example of the cortical recordings taken from an electrode with 16 different channels.
Fig. 3.
Local field potential (LFP) recordings from the rat visual cortex using a 16-channel electrode following a single flash of broad spectrum light.
4.
Single unit and multiunit activity
Multiunit activity (MUA) is believed to reflect the aggregate spiking activity of neurons within approximately a few hundred micrometers surrounding the electrode (15). The same electrophysiological recording taken to measure the LFP can be used to study MUA by simply using a band-pass of ∼300–3,000 Hz. Furthermore, the spiking activity of individual neurons can be estimated by assigning them the detected spikes based on the spike characteristics (spike sorting).
2.3 Materials
1.
Fixed frame
A stable mechanical support is required to avoid vibrations from surrounding equipment or natural movements such as respiration that could introduce noise in the recordings or even break the electrode. A nose clamp and/or ear bars are ideal to fix the head of the animal. Specifically, brain electrical recordings require the accurate location of visual structures with respect to some visual landmarks and a stereotaxic frame is used for this purpose (Harvard Apparatus, Kent, UK).
2.
Electrode
An electrode is an electrical conductor that provides a path for electricity to enter or leave a medium. The shape of the electrode depends on the visual structure that is to be measured. The electrical connection between the electrode and the amplifier should be kept at a minimum distance and away from potential sources of interference, since any noise introduced at this point will be subsequently amplified. In order to reduce interference with the mains, the body of the animal (e.g., the base of the tail) should be connected to the ground of the amplifier. The use of a Faraday cage should be considered as an option to block environmental electromagnetic noise.
Custom-made electroretinogram (ERG) electrodes can be manufactured using simple components. Stainless steel or gold wire electrodes with a round shape or saline-soaked cotton-wick electrodes can be used to measure the ERG. Alternatively, ERG electrodes are also commercially available (LKC Technologies, Gaithersburg, MD, USA). It is important to maintain a good electrical connection at all times by applying a transparent electrolytic solution such as methylcellulose between the cornea and the electrode.
3.
Voltage amplifier
The analogue electrical signal measured is generally very small and needs to be amplified (103–104) with voltage amplifiers in the order of volts before it can be digitized (Digitimer, Letchworth, UK).
4.
Signal filtering
The aim of filtering is to remove the unwanted noise from the signal. Very low frequencies (drift) are usually removed before digital conversion to prevent the signal drifting out of the desired voltage range. Unnecessary high frequencies can also be removed at this point by low pass filtering (Digitimer, Letchworth, UK).
5.
Analogue-to-digital converter (ADC)
The electrical signals need to be converted from an analogue to a digital signal so that the voltage can be interpreted by a computer. It is important to make sure that the sampling rate is at least twice the size of the maximum frequency of the signal of interest to avoid aliasing. Current commercial ADCs also have a resolution of at least 16-bits which allows for a wide range of voltage levels to be measured (CED, Cambridge, UK).
6.
Digital signal processing
In order to increase the signal to noise ratio, the same visual stimulus is generally presented several times and averaged at corresponding time steps. Further processing steps such as discrete Fourier analysis might also be carried out to highlight the frequency components of interest.
2.4 Methods
2.4.1 Electroretinography
Given that different cells respond preferentially to a set of stimulus conditions, visual parameters and presentation protocols should be chosen according to the retinal cell type and visual pathway that we want to examine. Table 3 shows a range of stimulus options grouped under different criteria. While there are a large number of stimulus combinations that can be used, we only present here an overview of the most common in rodent studies.
Table 3
Visual stimulation ERG modalities
Light intensity | Spectral properties | Spatial luminance pattern |
|---|---|---|
Scotopic range | Broad spectrum | Flash ERG |
Photopic range | Narrow spectrum | Pattern ERG |
Number of flashes | Adaptation to light | |
Single flash | Dark adaptation | |
Double flash | Light adaptation | |
Flicker | ||
1.
Flash ERG
The use of a single full-field flash of broad spectrum (white) light at various intensity levels and pre-adaptation to light (light adaptation level) is commonly used both in human and rodent ERG. The strengths of this method lie in its simplicity and ability to give an indication of visual function from photoreceptors and various cell types of the neural retina. While there are international guidelines for human ERG recordings to this type of stimulation, no such standard exist in animal studies including the rodent, and recordings are taken with a much wider range of stimulus conditions. The flash ERG stimulus is ideally spanning the entire visual field of the animal by means of a Ganzfeld although the use of a diffuser or a fibre optic near the eye is also common. It is important to control the light level over a wide range of intensities and limit the duration of the stimulus to the shortest time possible, and no longer than the integration time limit of the photoreceptors (approximately 15 ms for cones and 100 ms for rods). In order to test rod function at low intensity levels, the rodent needs to be dark adapted for a prolonged period of several hours and the flash of light needs to be presented at increasing intensity levels. At the higher intensities, ERGs will be generated from a combination of rod and cone function. In order to selectively test cone function, visual stimuli can be delivered after a period of light exposure at a rod-saturating level (approximately 5–30 cd/m2) of at least 10 min which is deemed to be sufficient in order to render the retina into a light-adapted state. Using this type of stimulus the a-wave, b-wave and oscillatory potentials can be extracted from the ERG.
2.
Flicker ERG
Given that cones are capable of regenerating at a much faster rate than rods, a stimulus presented at a high rate will be mainly a reflection of cone activity. The response has the resemblance of a sinusoidal signal at rates higher than 3 Hz and individual components of the ERG can no longer be identified. Instead, the amplitude and phase of the response at the stimulus frequency is useful in determining cone physiology. The amplitude of the response is reduced at high flicker frequencies until it is no longer distinguishable from noise (critical flicker frequency).
2.4.2 Brain Electrophysiology
Visual stimulation described in Table 3 for ERG recordings are also applicable to any of the electrophysiological recording modalities in the brain. Extracellular recordings of the superior colliculus (SC), lateral geniculate nucleus (LGN) or visual cortex (VC) are taken using stereotaxic coordinates as the reference followed by post-mortem confirmation of the electrode position. By sampling the region of interest at regular intervals using various visual stimulus parameters and, by combining these responses, one can examine the properties of individual neurons or small clusters of neurons (16). The superior colliculus is a particularly important visual structure in the rodent given that over 70% of retinal ganglion cells (RGC) project to the superficial layers of the superior colliculus and that it contains a retinotopic map of visual space. Therefore, electrophysiological recordings of the SC give an accurate description of RGC output. The VC in the rodent also contains a topographic representation of visual space and is crucial for high visual acuity given its ability to resolve high spatial frequencies.
3 Optical Imaging of Intrinsic Signals
There is a close link between the electrical activity of a population of neurons and the underlying metabolic activity. Local changes in electrical activity result in local changes in blood volume, blood oxygenation, and light-scattering properties of tissue. These phenomena can be exploited to determine the location of cortical activity by measuring the stimulus-evoked changes in tissue reflectance (Fig. 4). The technique used to measure these intrinsic changes is known as optical imaging of intrinsic signals (17). It offers the possibility of simultaneously sampling a substantial area of the rodent cortex (several millimetres) with good spatial resolution (μm range) and temporal resolution (peak changes within several seconds of stimulus onset).
Fig. 4.
A schematic of the optical imaging set up.
3.1 Materials
1.
Camera
A camera with a good signal to noise ratio is required to measure changes in the signal in the order of 0.1–1% with respect to baseline. A high quality CCD camera (DALSA, Billerica, MA, USA) with an analogue-to-digital converter of no less than 10-bits resolution per pixel will achieve this. The camera should be able to capture images synchronized with the visual stimulus (NI LabView, Newbury, UK) at a constant rate of at least 2 Hz for an extended period of time in order to capture the temporal profile of the response. The optical imaging response returns slowly to baseline and consequently it is also important to avoid inter-stimulus intervals shorter than 15 s.
2.
Lens system
It is important to focus below the cortical surface (∼500–700 μm) and collect images at a shallow depth of field in order to reduce blood vessel artefacts in the functional maps. It is also necessary to collect images with a field of view large enough to include the brain structures of interest (several millimetres) at good spatial resolution (∼10–50 μm/pixel) and with a long enough working distance to allow proper alignment of light illumination (more than 3 cm). The use of a macroscope made of a tandem-lens combination of two 50-mm camera lenses or a 50 mm with a 135-mm lens will fulfil all these requirements.
3.
Cortical illumination
The light source to illuminate the cortex has to provide the intensity, stability and wavelength required. Tungsten halogen lamps (Newport, Irvine, CA, USA) powered by a stabilized power supply are suitable for this purpose. A light guide is sufficient to achieve certain uniformity in the illumination over the cortex. Interference filters (Edmund Optics, York, UK) are interposed between the light source and the light guide to deliver narrow band in the 570–730 nm range.
3.2 Methods
Urethane on its own or in combination with other drugs (e.g., ketamine) is generally administered to the rodent in optical imaging experiments since it provides a stable level of anesthesia for a prolonged period of time. Barbiturates and gas anesthetics (e.g., isoflurane) have also been used in optical imaging although it is important to bear in mind that the effects of anesthetics on neurovascular coupling may be different between species and strains. Mucus secretions can make breathing difficult and a subcutaneous injection of atropine has been routinely carried out in the past. However, atropine can affect pupil dilation and recent studies have shown that it can also affect retinal activity (18), so it is advisable to avoid its use in the future. Instead, performing a tracheotomy which is a relatively fast and simple procedure can facilitate breathing and provide a route for artificial ventilation. The physiological condition of the animal should be monitored and controlled whenever possible. Maintaining core body temperature constant for the duration of the experiment at approximately 37°C is critical and a regulated heating pad using a rectal thermoprobe should always be used. A pulse oxymeter for rats and mice has been recently made commercially available (Starr Life Sciences, Oakmont, PA, USA) and monitors relevant physiological parameters such as heart rate, breathing rate and blood oxygenation non-invasively. This device is highly recommended since it avoids difficult artery cannulation in such small species. While large species require the opening of the skull, this is not required in rodents. Optical imaging can be performed in rats by thinning the skull and in the case of mice by leaving the skull intact. In order to increase the translucency of the skull, silicon oil or saline should be applied and maintained for the duration of the experiment. Optical imaging measurements are generally taken at a single wavelength in order to emphasize a specific component of the reflected light changes: blood volume (570 nm), blood oxygenation (605 nm) or scattering (>650 nm). Optical imaging applications to study visual function in rodents have been comparatively less used than other electrophysiological techniques. High contrast gratings presented at various locations of the visual field have been used to study the retinotopic organization of the visual cortex (19). A high contrast thin bar moving at constant speed across the visual field in different directions has also proved to be efficient for this purpose (20) as well as for the study of the plastic properties of the visual cortex (21). Prolonged periods of spatially uniform stimulation have also been shown to elicit strong cortical responses (22). In order to identify the region of activity, an initial ratio analysis is first carried out by removing and dividing a reference image collected previous to stimulus onset, from the images acquired after stimulation to normalize for uneven illumination. A general linear model has also been used to fit the measured signal to a temporal model of the response and noise, and subsequently calculate the map of activity in terms of z scores (Fig. 5). Alternative methods attempt to separate the cortical response from background noise without assuming a shape of the temporal response by making use of their underlying differences in variance (principal component analysis) or other measures of independence (23, 24).
Fig. 5.
Cortical map of activity following high contrast gratings stimulation. Left picture shows the z scores map of activity. a anterior, p posterior, l lateral, m medial. The right trace shows the average temporal response of the most active pixels in percentage changes from baseline.
4 Functional Anatomy
The activation of retinal circuitry by visual stimulation can be assessed by several functional anatomical methods which include the visualisation of neurotransmitter signalling using both indirect (25, 26) and direct methods (27). By far the most commonly applied methodology involves the use of immunohistochemistry for the immediate early gene c-fos. The transcription of c-fos is associated with neural activity, as it is activated following membrane depolarization (28). Light stimulation induces Fos expression in retinal neurons and has been demonstrated in both sub-cortical and cortical regions in the brain. Comparative anatomical techniques can be employed to assess qualitative and quantitative differences in light-induced Fos in these regions to assess visual function.
In the retina, immunohistochemistry for Fos was first used to measure the activation of retinal dopamine neurons in response to stroboscopic illumination in the chick (29) but is equally effective in revealing the rod/cone-driven activation of amacrine cell interneurons of the rodent retina (30, 31).
Immunohistochemistry for Fos can be used in combination with a second, cell-type specific marker to identify light-driven neural activation of amacrine cells (Fig. 6) (30–33) or intrinsically photosensitive, melanopsin-expressing retinal ganglion cells (34–36). Importantly, in the wildtype rodent retina, a linear relationship exists between light intensity and the detection of Fos expression in amacrine cells of the inner retina (31). The Fos induction in this retinal cell type has been shown to decline with advancing retinal degeneration in dystrophic mice (37) and as such can provide a sensitive measure of regional losses in rod/cone function. Below we describe a relatively simple functional anatomical method, which employs immunohistochemistry for Fos to visualise light-driven activation in specific inner retinal circuits. We have recently used this technique to measure the spatial decline and preservation of retinal function following stem-cell grafting into the sub-retinal space of dystrophic RCS rats (38).
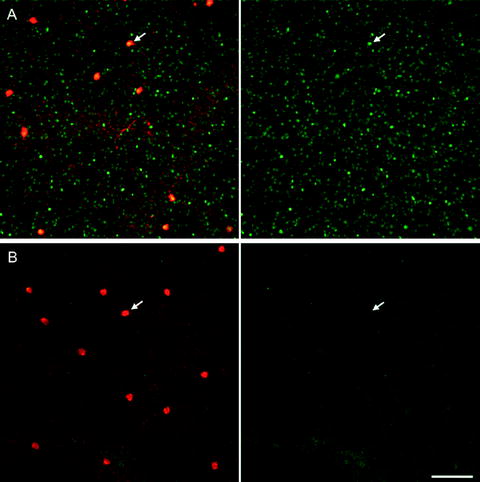
Fig. 6.
Light-driven Fos activation in dopaminergic amacrine cells of the rat retina. Confocal images from flat-mounted retina showing Fos labelled in green and tyrosine hydroxylase in red. (a) Following 90 min of light. (b) Following 90 min of darkness. Arrows point to nuclear Fos in (A) verses cytosolic Fos in (B), scale bar 100 μm.
Light-induced Fos has been described in a growing list of retinorecipient brain regions and nuclei. Given that different regions of the visual system are specialized in responding to different types of stimuli, the optimal light stimulation parameters for Fos induction will vary and would need to be defined on a region-by-region basis. Such in-depth analysis is yet to be performed for many visual system targets. One region that has been extensively studied is the suprachiasmatic nucleus (SCN) within the hypothalamus.
In mammals, the SCN is the master circadian rhythm generator (39, 40). The cells of the SCN respond to increasing levels of irradiance and appear to function as irradiance detectors (41). Fos expression in the SCN can be light induced but it is expressed in an endogenously rhythmic manner in constant conditions. Under a 12:12 light dark (LD) cycle Fos levels peak 2 h after dawn and are low during the night (42, 43). In constant darkness (DD) there is a peak of Fos expression during the mid-subjective day (44–46). Fos expression in the subjective night is low, and light stimulation up-regulating it during this period can be informative to assess visual function (Fig. 7).
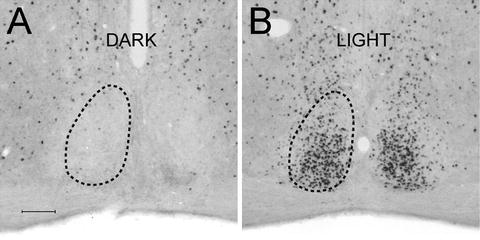
Fig. 7.
Light-induced Fos in the suprachiasmatic nuclei of mice. (a) The mouse remained in darkness and was perfused at the same circadian time (CT) as (B). (b) The mouse received a 15 min light pulse at CT16 and was perfused 90 min later. Fos has been visualized using DAB-nickel; relative quantification of Fos can be made by densitometry analysis. Scale bar 100 μm.
Light-induced Fos in the SCN is phase dependent and only occurs at times when exposure to light will cause phase shifts of the endogenous clock (43, 45, 47–50). The levels of light-induced Fos correlate to both the intensity and duration of the light exposure and show a linear–temporal relationship to the number of photons applied over durations of 5–47.5 min (51). Melanopsin-positive ganglion cells provide the majority of the projection to the SCN (52–57). As such light-induced Fos in the SCN survives the degeneration of the outer retinal photoreceptors (47, 58–60). Mice with only melanopsin ganglion cells as functional photoreceptors retain light-induced Fos in this structure (61, 62). Indeed the level of induced Fos is unattenuated between wildtype animals and those with only melanopsin cells at monochromatic wavelengths ∼505 nm (∼1013 photons/cm2/s) (62). Melanopsin knockout mice still display photically induced c-fos to broad-spectrum white light (70–280 lux) in the SCN but the level is attenuated compared to wildtypes (63).
Other sub-cortical brain regions that show light-induced Fos in rodents include the vLGN (62, 64), IGL (48, 62, 64–67), ventrolateral preoptic nuclei (VLPO) (68), and OPN-pretectal regions (64, 69, 70). These structures (with the exception of the VLPO) show impairment in Fos induction following loss of rod and cone photoreceptors (vLGN (62, 64), IGL (61, 62, 64), OPN-pretectum (61)). These regions receive input not only from melanopsin, but also non-melanopsin positive ganglion cells (56, 71); as such, rod and cone activity may be responsible for most light activated Fos within them.
Light-induced Fos in the superior colliculus of the midbrain seems to be dependent on the functioning of rod photoreceptors as it is not detectable in a rat with degenerated rods and cones (64). Indeed the degeneration of the retina causes a confounding non-light-dependent Fos activity in this region. The visual cortex also responds to light activation with Fos induction (72), and this still occurs in mice with only melanopsin photoreceptors (18). To what extent different types of light stimuli and different photoreceptor classes lead to Fos induction in the visual cortex still needs further investigation.
4.1 Methods
The specific parameters of light stimulation required to induce Fos will depend on the system under investigation; optimal light stimulation may need to be verified in advance. Continuous pulses of light of 15 min or longer are typically used to assess Fos induction in regions associated with irradiance detection such as the SCN (59, 62), while discontinuous stimuli may be optimal for others such as the SC (64). Dark adaptation may need to be considered as well as circadian time at the point of sampling.
Induction of c-fos transcription occurs rapidly and the protein has a half-life of about 2 h (73); to assess acute Fos induction animals are generally killed between 90 min and 2 h from the beginning of light stimulation. Animals are then deeply anaesthetised with sodium pentobarbital (60 mg/kg) and perfused with 0.1 M PBS (pH 7.2) followed by 4% paraformaldehyde (in 0.1 M PBS). The brains and eye are removed and post-fixed overnight at 4°C. Tissues to be cryostat sectioned need to be cryoprotected overnight at 4°C in 30% sucrose solution (in 0.1 M PBS), and then frozen with a dry ice/acetone slurry. Brains should be cryosectioned (∼30–40 μm thick) while retinae can be sectioned (∼10–15 μm) thick or removed and processed free floating as flat-mounts. Immunostaining for Fos can be carried out using standard protocols, two examples are described below, the first for double immunofluorescent labeling in the retina and the second for densitometry analysis of Fos label in brain regions:
1.
Immunofluorescent double labeling for Fos and tyrosine hydroxylase in the retina
Tissue should first be blocked in 5% normal donkey serum (NDS) 1 h (in 0.3% triton X-100 (BDH) in PBS (0.1 M pH 7.2) for sections or flat-mount retina. Then incubated concurrently with sheep anti-tyrosine hydroxylase (Chemicon AB1542, 1:1,000 dilution, a pan-TH antibody recognizing all phosphorylation states) and rabbit anti-c-fos (Calbiochem PC38, at 1: 5,000 dilution) antibodies in 1% NDS in 0.3% triton/PBS at room temperature overnight. Then washed in a couple of changes of PBS before incubation in secondaries: FITC anti-rabbit and TRITC anti-sheep antibodies (preabsorbed to multiple species and especially designed for multiple labelling; Jackson Immuno Research; catalogue no: 713-095-147 (FITC), 711-025-152 (TRITC)) diluted 1:200 in 2% NDS (0.3% triton/PBS). Nuclei can be stained with DAPI (1 min incubation in DAPI diluted 1:5000 in PBS) and then tissue should be washed extensively in PBS and Tris buffer (0.05 M, pH7.5). Flat-mounts can now be mounted onto slides (ganglion cell layer up) and all slides can be coverslipped using Vectashield (Vector Laboratories, Burlingame, CA). Co-localisation can be viewed on a microscope using the appropriate epifluorescent filter cubes, but confocal microscopy is preferable as it enables accurate determination of co-localization of Fos-positive label in the nuclei of the tyrosine hydroxylase positive cells (30).
2.
Densitometry analysis of Fos induction in brain sections
In brain sections, this can be done reliably using diaminobenzidine (DAB) chromogen development which produces a dark brown/black reaction product. The following is a detailed protocol, described from (74). Free floating sections should first be incubated in 50% ethanol, 0.9% NaCl, and 0.05% H2O2 to block endogenous peroxidase at 4°C for 1 h. Then washed in PBS (0.01 M, pH7.4), 0.3% triton, and 0.1% sodium azide (PBSTA) and then incubated in blocking serum containing PBSTA with 1.5% normal goat serum for 60 min at 4°C. The primary antibody should then be applied to the sections; primary antibody rabbit anti-Fos (Ab-5 Oncogene Research Products Calbiochem) at a final dilution of 1:20,000 in blocking serum at 4°C for 72 h. The sections are then rinsed twice in PBSTA and incubated in the secondary biotinylated antibody for 2 h at room temperature (BA-1000 goat antiserum, Vector Laboratories; final dilution 1:200) followed by two further rinses in PBSTA. Avidin biotin amplification is then carried out by incubation in the avidin-biotin-peroxidase complex for 2 h at room temperature (Vectastain ABC Elite Kit, PK-6100, Vector Laboratories). Brain sections are then washed in Tris buffer 0.05 M, pH 7.4 twice for 10 min and then transferred to chilled 4°C Tris buffer containing 0.02% 3,-3′diaminobenzidine, 0.5% nickel ammonium sulphate and 0.001% H2O2. The development of the DAB nickel chromogen can be visually monitored. After which sections should be washed in Tris buffer before mounting them onto gelatinized slides, air-dried, dehydrated in a series of alcohols, cleared in xylene, and coverslipped with DePeX.
Images can be captured from a microscope using a digital camera (e.g., Spot RT colour digital camera (Diagnostic Instruments Inc., Sterling Heights, USA)). Relative amounts of Fos can be quantified by calculating the integral optical density of the chromogenic label (74). This analysis can be done using image analysis software such as Image Pro Plus (Media Cybernetics UK, Finchampstead, UK).
4.2 Notes
1.
2.
If freezing artefact (tissue shattering) is observed, then this is likely to be due to insufficient time in sucrose solution. We recommend overnight exposure of fixed eyes to 30% sucrose solution. Removal of lens is important when processing sectioned eye material.
3.
It is important to use 3% triton with the blocking/primary antibody incubation stages because, without this, penetration of antibodies will be insufficient to visualise amacrine cells in the inner nuclear layer.
4.
When flat-mounting retinae, it is important to post-fix the eyes for at least 2 h prior to attempting removal of the retina. If the retinae are not sufficiently fixed, they will disintegrate upon immuno-processing with the 3% triton solution.
5.
Try to perfuse animals rather than just remove the eyes, as it is more difficult to obtain flat-mounts from fresh tissue.
6.
Always use an anti-fading mounting medium such as Vectashield as, otherwise, fading of fluorescent signal will make it difficult to quantify the extent of fos activation.
5 Measurement of Wheel Running Behaviour
Wheel-running behaviour of mice can be used to assess visual functional at the sub-cortical level. Its use has been well studied in mice and to a lesser extent in rats. The circadian clock of mammals, the SCN within the hypothalamus is photo-entrained by light signals that are mediated by the retinohypothalmic tract projection from the eye (80). Locomotor behaviour is a clock-controlled output, and is demonstrated by wheel running in rodents. Wheel-running behaviour is generally analysed using an actogram (Fig. 8).
Fig. 8.
An actogram showing wheel-running behaviour of a mouse. The black blocks represent bouts of wheel-running activity; each day is plotted on a successive line. For the first 4 days, the animal is maintained in an LD cycle with lights on from 5:00 to 17:00; it restricts its activity to the dark period. On the 5th day, the lights remain switched off and the animal’s wheel running activity free runs through time. On the 14th day, the animals receives a 15-min pulse of light at CT16; this causes a phase delay in the onset of activity in subsequent days.
As nocturnal animals, when mice are photo-entrained they will restrict wheel running to the dark phase under light dark (LD) conditions. When animals are released into constant darkness then their activity will no longer be entrained, their periodicity (τ) will be controlled by the endogenous clock and τ will probably not equal external time (24 h).
Their activity rhythms are said to be free running (through time). The τ of mice (in constant darkness) is usually <24 h, as such with each successive day they will commence wheel running slightly earlier. The full cycle of activity (between activity onsets on each successive day) is considered to last 24 circadian hours, 1 h lasts τ/24 h. The start of subjective night, circadian time 12 (CT12) is defined as the time at which mice start wheel running. Light has a distinct effect on the circadian system at different circadian times. Pulses of light during the subjective night (CT12-24) can cause phase shifts in the subsequent onsets of activity. Conversely pulses of light during the subjective day (CT0-12) do not. Pulses of light as short as 15 min in duration, in the early part of the subjective night (CT12-18) cause phase delays, and those in the late subjective night (CT18-24) phase advance the activity rhythm. In mice, the largest phase shifts are elicited to pulses of light that phase delay the activity during the early part of the subjective night (81). There is a positive correlation between the magnitude of the phase shift and the intensity of light (over about 2 log units) given for the same duration (82).
< div class='tao-gold-member'>
Only gold members can continue reading. Log In or Register to continue
Stay updated, free articles. Join our Telegram channel

Full access? Get Clinical Tree


