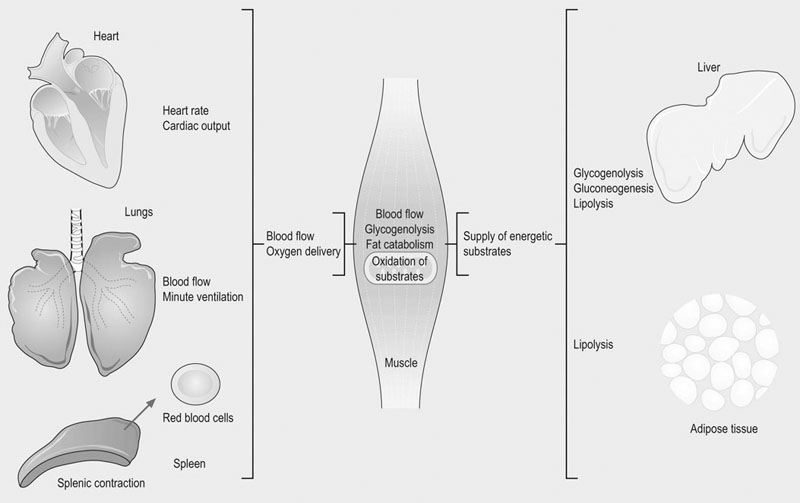
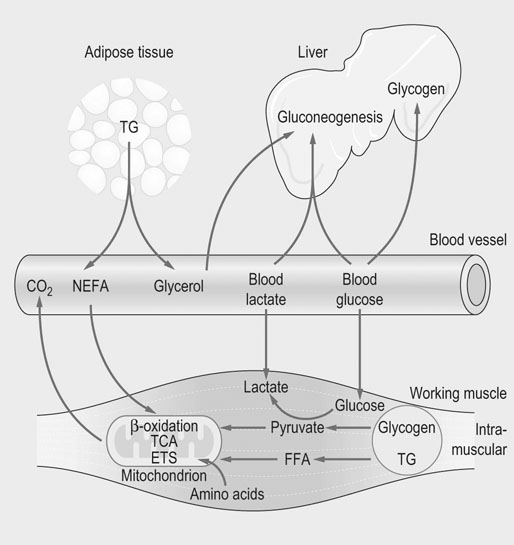
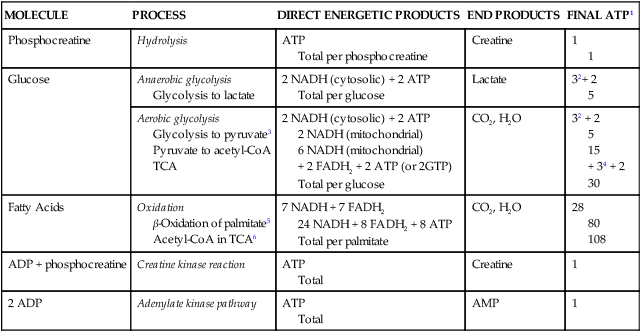
The physiological response to exercise is a coordinated event that involves integration of various body systems to sustain ATP turnover at the level of working muscles. Several hormones act on the lungs, heart, spleen, vasculature and muscles to increase metabolic rate. Physiological adaptations to exercise increase blood flow and oxygen delivery to muscles while maintaining thermal homeostasis. In addition, the supply of energy substrates to muscle is increased via the mobilization of reserves in the liver and in adipose tissue, in addition to catabolic processes within muscle (Fig. 33.1). The overall response to exercise is regulated by several hormones released into circulation. The initial response to exercise is primarily controlled by epinephrine and norepinephrine, two catecholamines synthesized and released by the adrenal medulla of the adrenal glands in response to the exercise-induced stress. Norepinephrine is also a neuromodulator of the peripheral sympathetic nervous system where it is released from synaptic vesicles. Among other effects, catecholamines stimulate the cardiovascular and respiratory systems, and induce splenic contraction. They contribute to the redistribution of blood flow to working muscles and promote catabolic processes to provide energy. The increase in catecholamine concentrations occurs at the onset of exercise and is proportional to exercise intensity. In horses during maximal effort, the responses are several-fold greater than in humans.1–3 Mobilization of fuel for muscular work is also under the dependence of hormones such as glucagon that acts on the liver to induce glycogenolysis and gluconeogenesis. Glucocorticoids, in particular cortisol, also play a role in enhancing substrate availability. High aerobic capacity (expressed as the maximal rate of oxygen consumption [VO2max]) underpins the athletic power of horses.4,5 On a mass specific basis, racehorses typically have values for VO2max at least double those of elite human athletes (>200 mL.min−1.kg−1 6 versus 80 mL.min−1.kg−1 7). The up to 50-fold increase in oxygen consumption from rest to maximal exercise is facilitated by adjustments in cardiopulmonary function, including a large increase in oxygen extraction from blood perfusing the muscles and increases in pulmonary blood flow and ventilation. During high-intensity exercise, respiratory rate increases 10-fold and the tidal volume three-fold; consequently, the minute ventilation may reach 1500 L/min with peak expiratory airflow as high as 90 L/s.8,9 During exercise, cardiac output may increase 10-fold (versus 6-fold in human athletes) whereas the heart rate may exceed 230 beats/min8,10,11 (versus 170–190 beats/min in trained men12). Also, in response to the sympathetic stimulation of exercise, the oxygen-carrying capacity of the blood is enhanced by the release into circulation of red blood cells (RBCs) stored in the spleen with total circulating RBCs increasing by as much as 50%.13 The muscle vascular bed accommodates such an increase in blood flow via capillary dilatation mediated by the autonomic nervous system and locally produced vasoactive substances. At VO2max, skeletal muscle receives about 80% of total cardiac output14 while, at the same time, there is an increase in blood flow to the skin to facilitate heat loss.15 Oxygen delivery to skeletal muscle is thought to be the primary limiting factor in VO2max5 as muscle mitochondrial oxidative capacity far exceeds the ability of the respiratory and cardiovascular systems to deliver oxygen.16 Mitochondrial oxidative capacity appears to be fixed among species including the horse, with average values of ~5 mL O2.min−1.mL−1 of mitochondrial volume.17–19 According to the theory of symmorphosis, therefore, improved muscle oxidative capacity with training would only result from increased muscle mitochondrial density.20 However, recent investigations have demonstrated functional plasticity of mitochondria and thus have challenged an exclusively quantitative effect of training on mitochondrial oxidative capacity.21,22 Equine skeletal muscle, especially fast twitch fibers, contains high glycogen stores. Expressed on dry weight basis, the glycogen concentration varies from 300 to 650 µmol/g dry weight depending on the muscle, training status and diet.23,24 The content of triglycerides in equine skeletal muscle has been found to be highly variable (from 7 to 128 µmol/g dry weight in the middle gluteal muscle.25 Proteins (amino acids) also may contribute to the energy supply, particularly during prolonged low-intensity exercise such as endurance races.26 Fatty acids released from triglycerides stored in adipose tissue, myocytes or very low density lipoproteins (VLDL) are a major energy source. Horses differ from other athletic animals in that there is an increase in the circulating triglycerides during exercise.27 Triglycerides are released from the liver as very low density lipoproteins;27 the increase during exercise may reflect enhanced synthesis in response to increased delivery of non-esterified fatty acids (NEFA) to the liver. Lipoprotein lipase located on the outer side of the endothelial membranes in muscle capillaries will release fatty acids from circulating VLDL-triglycerides for oxidation in muscles. NEFA released from the hydrolysis of triglycerides in adipose tissue are transported in blood bound to serum albumin and enter myocytes via specific fatty acid transporter proteins. The glycerol from hydrolyzed triglycerides is converted to glycerol-3-phosphate and enters the glycolytic pathway.28,29 In the liver, glycerol is a gluconeogenic substrate, as are lactate and alanine (Fig. 33.2). The release of nutrients from the gastrointestinal tract depends on pre-exercise feeding regimens (e.g. glucose absorbed after digestion of a pre-exercise grain meal may be utilized during exercise). In general, equine diets are rich in carbohydrates (e.g. hemicellulose) that are not degraded by pancreatic amylase, but rather are subjected to bacterial fermentation in the cecum and colon. Short-chain (or volatile) fatty acids, mainly acetate, propionate and butyrate, are produced by this process. At rest, acetate may provide approximately 30% of the energy utilized by the hindlimb30 while propionate is used mainly for gluconeogenesis.31,32 The direct contribution of these substrates to energy use during exercise is not known. Ultimately, the metabolism of the above-mentioned energy substrates generates reduced nicotinamide adenine dinucleotide (NADH + H+) or reduced flavine adenine dinucleotide (FADH2) that are further oxidized by the mitochondrion to generate ATP. The main muscle energy metabolic pathways are illustrated in Figure 33.3. The preferential use of an energetic substrate is dependent on its availability, the activity of oxidative enzymes, oxygen availability, and mitochondrial density. Also, the sources of energy for aerobic and anaerobic metabolism as well as the relative contribution of both pathways depend on the intensity, type and duration of the exercise. Nutrition and training are also important determinants of the relative contributions of different substrates to energy transduction (for a review, see Reference 33). Two pathways are available to extract energy from glycogen or glucose in muscle: anaerobic and aerobic glycolysis. Glucose 6-phosphate derived from blood glucose or from mobilized stored intracellular glycogen is the first substrate in the glycolytic pathway. Blood glucose crosses the plasma membrane of the muscle cells through specific glucose carriers (GLUTs); glucose transporter 4 (GLUT-4) is the major isoform in the skeletal muscle.34 The translocation of GLUT-4 to the cell surface is a major rate-limiting step in glucose utilization; translocation occurs in response to insulin as well as muscle contraction.35 Once in the cytoplasm, glucose is phosphorylated by hexokinase into glucose 6-phosphate. Glycogenolysis releases glucose 1-phosphate molecules from glycogen that are subsequently converted into glucose 6-phosphate. The key regulatory enzyme of glycolysis is phosphofructokinase, which converts fructose 6-phosphate to fructose 1,6-diphosphate. This enzyme is considered to be an indicator of the anaerobic metabolism because its activity is regulated by the ATP/ADP ratio; when this ratio decreases, the activity of phosphofructokinase increases, thus resulting in a greater production of pyruvate. Under anaerobic conditions, the pyruvate produced in the cytoplasm is converted to lactate by lactate dehydrogenase (LDH), utilizing electrons from NADH + H+. In anaerobic glycolysis, one glucose molecule produces a net gain of two ATP molecules but the conversion of glucose to pyruvate also yields NADH + H+. Indeed, when the NADH/NAD+ ratio increases, glycolysis switches to the anaerobic mode and pyruvate is reduced to lactate. This decreases the NADH/NAD+ ratio and restores NAD+, which allows glycolysis to continue at the maximum rate. This process occurs in the cytoplasm and is only moderately efficient in terms of energy production but is efficient with respect to speed (Table 33.1). Table 33.1 Total ATP yield from major pathways for ATP regeneration 1These calculations assume that mitochondrial oxidative phosphorylation produces 1.5 ATP per FADH2 oxidized and 2.5 ATP per NADH oxidized. 2In the muscle, cytosolic NADH are delivered to ubiquinone of the ETS by the glycerol 3-phosphate shuttle and thus, the reducing equivalents from NADH are directed to Complex III and not Complex I, providing only 1.5 ATP molecules per pair of electrons rather than 2.5 ATP molecules when this pair of electron passes from Complex I to O2. 32 molecules of pyruvate are produced per glucose molecule. 4FADH2 passes its electrons into the ETS at the level of Complex II and generates 1.5 molecules of ATP. 5Palmitate (C16:0) is one of the major individual acids in the fatty acids of adipose tissue in horses.231 β-Oxidation of fatty acids occurs within the mitochondrial matrix. Sarcoplasmic short and medium-chain fatty acids (chain lengths up to 12 carbons) can freely enter the mitochondrial matrix. In contrast, long-chain fatty acids must be transported into the mitochondria by the carnitine shuttle, which is a rate-limiting step.29 β-Oxidation involves the sequential removal of 2-carbon segments in the form of acetyl-CoA29 and production of shortened acyl-CoA, with concurrent reduction of one FAD and one NAD+. The electrons carried by NADH + H+ and FADH2 immediately enter the electron transfer system (ETS) of the oxidative phosphorylation (OXPHOS) system, whereas acetyl-CoA enters the TCA cycle (Fig. 33.3).29,36 Tissue proteins can be degraded to provide fuel and a net protein degradation may occur during prolonged exercise.26 There is no large energetic storage form (like glycogen for glucose or triglycerides for fatty acids) for amino acids; thus amino acids used for energy are provided by structural and functional proteins. When necessary, these proteins are degraded into amino acids that are transported via the blood to other tissues. Some of the amino acids are oxidized as fuel (where their metabolites enter the TCA cycle), whereas the rest provide substrates for gluconeogenesis in the liver and possibly for acid–base regulation. The major pathways for oxidative metabolism of glucose, fatty acids and amino acids converge in the TCA cycle. In this mitochondrial process, several oxidation steps culminate in the formation of oxaloacetate that can be used to repeat the cycle. The oxidants used are NAD+, FAD and guanosine 5′-diphosphate (GDP) or ADP. For each acetyl-CoA that undergoes the whole process, three NADH+ + H+, one FADH2, and one ATP (or one guanosine 5′-triphosphate (GTP) that is energetically equivalent) are generated. NADH and FADH2 are reoxidized by the mitochondrial ETS to provide ATP (Fig. 33.3). Under aerobic conditions, glycolysis, β-oxidation of free fatty acids and the TCA cycle generate reducing equivalents (i.e. NADH + H+ and FADH2) which are oxidized in mitochondria owing to the ETS localized in the inner mitochondrial membrane. The ETS is made of five complexes and two mobile carriers named ubiquinone (also called coenzyme Q, or simply Q) and cytochrome c (Fig. 33.4). From I to IV, complexes are named NADH dehydrogenase (or NADH : ubiquinone oxidoreductase), succinate dehydrogenase (or succinate-coenzyme Q reductase or succinate-ubiquinone oxidoreductase), coenzyme Q : cytochrome c – oxidoreductase (or cytochrome bc1 complex or ubiquinone : cytochrome c oxidoreductase) and cytochrome c oxidase (frequently abbreviated as COX). Mitochondrial NADH transfers its electrons to Complex I whereas cytosolic NADH requires a specific shuttle (i.e. the glycerol 3-phosphate shuttle in the skeletal muscle and brain versus the malate-aspartate shuttle which operates in liver, kidney and heart mitochondria) to pass its electrons to Q. FADH2 transfers its electrons into the ETS at the level of Complex II. There is also an entry at the level of Q for electrons transferred at the first step in the β-oxidation of fatty acyl-CoA by the electron transferring flavoprotein (ETF) (Fig. 33.5). The mitochondrial ETS reduces oxygen to water and generates the electrochemical gradient of protons used by ATP synthase (i.e. Complex V) to phosphorylate ADP and produce ATP. The oxygen consumed by the ETS must be constantly provided to mitochondria from the blood (transferred via myoglobin). OXPHOS is highly efficient in producing ATP and thus mitochondria have a central role in ATP replenishment (Table 33.1). Consumption of ATP during exercise results in the accumulation of ADP. During intense exercise, in addition to the ATP regeneration via the enzyme creatine kinase (that catalyzes the replenishment of ATP using the phosphocreatine as a source of phosphoryl groups), muscle can temporarily generate ATP using the adenylate kinase pathway. This fully reversible reaction catalyzes the generation of one ATP and one adenosine monophosphate (AMP) using two ADP molecules. The AMP molecule can then be deaminated to inosine monophosphate (IMP) within the purine nucleotide cycle, with concurrent production of ammonia. The accumulation of IMP closely mirrors the loss of ATP.37 This reaction cascade eventually leads to loss of adenine nucleotides and myofibrillar fatigue. Assessment of the metabolic responses to exercise may guide conditioning programs that target the optimization of athletic performance. This goal raises the question of the physiological determinants of performance and requires understanding of whether specific responses represent physiological or pathophysiological events. For example, oxidative stress during exercise is a physiological event, whereas inappropriate antioxidant capacity may result in muscle homeostasis disturbances, fatigue and injury.38–40 Several exercise testing methodologies enable evaluation of the state of physical conditioning and therefore an indication as to whether the horse is fit for the intended activity.22,41–48 They may be used repeatedly to adjust the degree of exercise load during the conditioning program.45 Indeed, it is well documented that training induces biochemical adaptations that moderate exercise-induced muscle damage.49–51 The monitoring of specific biomarkers also may facilitate avoidance of overexertion and training-associated injuries,52,53 while standardized assessment of the metabolic response to exercise can aid in the investigation of poor performance.54–56 Methods for laboratory (treadmill) and field exercise testing are covered in Chapters 2 and Chapter 3. In brief, treadmill testing offers several advantages, including the ability to control the environmental and exercise conditions, use sophisticated equipment for physiological monitoring, and easily obtain blood samples from the horse during running. However, physiologic and metabolic responses to treadmill exercise may not mirror exercise over ground.57,58 In contrast, field testing offers environmental conditions closer those of competition but is more difficult to standardize and in general allows for a more limited range of measurements when compared to treadmill tests. Nonetheless, the advent of newer methodologies and equipment22,48,55,56,59–62 has increased the clinical usefulness of field exercise testing. Indirect calorimetry can be used to estimate whole-body rates of carbohydrate and lipid utilization during submaximal exercise, while isotopic tracer techniques enable quantification of the turnover of specific metabolic substrates such as glucose.63–68 Using stoichiometric equations for the combustion of carbohydrate and fat, values for the respiratory exchange ratio (R, the ratio of carbon dioxide produced to oxygen consumed) can be used to estimate the relative contribution of these substrates to energy expenditure during submaximal exercise.65 These calculations assume that measures of gas exchange at the level of the lung accurately reflect the actual metabolic gas exchange at the cellular level. In addition, it is assumed that protein makes a negligible contribution to energy metabolism. This approach is invalid at high work intensities wherein a portion of expired CO2 is derived from the bicarbonate buffer system (the buffering of lactic acid) and values for R may be greater than 1.0. So, this technique enables the quantification of aerobic energy release (i.e. whole-body aerobic production of ATP) from the combustion of carbohydrates and fats. Several studies in horses have employed an infusion of a stable isotopically labeled tracer of glucose in order to calculate rates of glucose production (mainly hepatic glucose production) and utilization (mainly muscle glucose uptake) in horses during submaximal exercise.63–69 In contrast with measurement of blood glucose concentrations, this technique allows assessment of the dynamics of glucose turnover during exercise or after feeding.68,69 From concurrent calculations of whole-body rates of carbohydrate oxidation and the rate of plasma glucose disappearance, it is also possible to estimate the contribution by blood glucose and muscle glycogen (plus lactate) to total carbohydrate utilization.65 The main assumption is that the rate of glucose disappearance is equal to the actual oxidation rate of glucose derived from the blood, although it is possible that some glucose is used for glycogen resynthesis during low-to-moderate-intensity exercise. This technique is expensive due to the price of stable-isotope labeled substrates and the instrumentation required for measurement of isotopic enrichment.70,71 Recently, the hyperglycemic clamp technique has been used to estimate glucose utilization in horses during exercise.72 In this non-isotopic method,73 the plasma glucose concentration is acutely raised to a fixed concentration by injection of glucose and then maintained at a hyperglycemic plateau by use of a variable rate glucose infusion. Because the plasma glucose concentration is held constant, the glucose infusion rate is an index of glucose disposal.74 By maintaining the fixed hyperglycemic plateau for about 2 h, it is assumed that endogenous hepatic glucose production is suppressed and (with appropriate corrections for glucose loss via the glucose space and urine) and that the rate of glucose disposal is equal to the glucose infusion rate.72 However, the induced hyperglycemia may affect muscle metabolism by favoring the use of glucose rather than fat. Aerobic capacity, measured as maximum oxygen uptake (VO2max), correlates with running speed over 2000 m in Thoroughbreds.44 The measurement of VO2max is also useful because thereafter it is possible to express workloads as a percentage of VO2max.75 Comparison of studies performed among sport centers is feasible since the type of exercise protocols used to determine VO2max does not markedly influence the results.76 In horses, methods to quantify anaerobic energy metabolism are the measurement of maximal accumulated oxygen deficit (‘MAOD’, calculated from the difference of calculated O2 demand and maximum oxygen uptake77) and blood lactate measurement. These methods lack accuracy due to the fact that anaerobic ATP production is an intracellular process. The peak blood lactate concentration is often used as a measure of anaerobic release during exercise but this does not take into account the energy release from stored ATP and phosphocreatine. In addition, blood lactate does not quantify muscle lactate concentration. However, it may be used to indicate increased glycolytic activity within exercising skeletal muscle78 as lactate and hydrogen ions (end products of anaerobic glycolysis) are released from muscle into the circulation. Indeed, the initial rise in blood lactate does not necessarily mean hypoxia in muscle cell; rather it is an indication that the rate of pyruvate delivery to the mitochondria has exceeded the ability of the organelle to oxidize pyruvate, leading to accelerated generation of lactic acid. Therefore, lactate accumulation is intimately linked to the oxidative capacity of muscle fibers. Lactate threshold (VLa4, i.e. velocity at 4 mmol/L of blood lactate) and the velocity (running speed) at a heart rate of 200 bpm (V200) are frequently used in the evaluation of fitness and state of training. These indices are easy to measure, can be determined both on a track and a treadmill and do not require any expensive equipment. Metabolically, lactate threshold represents the maximal work intensity at which ATP is produced aerobically, i.e. there exists a steady-state situation in blood lactate concentration, wherein lactate is released (mainly from muscles) into circulation at the same rate as it is used by other tissues. Based on studies in humans, it has been shown that blood lactate concentration starts to increase exponentially around a concentration of 4 mmol/L. Similarly, in horses lactate threshold is expressed as the speed of the treadmill or the speed of the horse on a track at which blood lactate reaches 4 mmol/L (see Fig. 33.6). The analysis of blood lactate is complex since equine RBCs behave differently from that of other athletic species,79 functioning as lactate sink. Up to 50% of blood lactate can be found in RBCs80,81 versus only 20% in human athletes.82 There is a close correlation between whole-blood and plasma lactate concentrations80,83 but the uptake of lactate into RBCs varies interindividually81,84,85 according to activity of monocarboxylate transporters (MCT) that facilitate the transport of lactate across membranes in RBCs but also from the muscles into plasma.86 On the basis of lactate transport activity in RBCs, horses can be divided into two populations of unequal size: the large majority with high transport activity versus the other one with low lactate transport activity in their RBCs.85,87 Low lactate transport activity in the Standardbred is inherited as an autosomal recessive trait.87 Horses with high lactate transport activity have higher RBC lactate concentration after submaximal and maximal exercise81,88 and have been shown to be better performers.89 It is hypothesized that the influx of lactate from plasma into RBC sustains the gradient between muscle cell and plasma, thereby facilitating lactate efflux from muscle.80,90 Further studies are needed to demonstrate a correlation between lactate transport activity and performance.91 Blood samples are easy to collect and many research studies have been directed at finding the best markers of performance and athletic ability. It is worth noting that several factors may influence the results obtained in laboratory analysis. Sources of variation include the laboratory that may use different methodologies for the measurement of the same biochemical parameters. At animal level, breed, age and sex are significant sources of variation in blood variables.92 Two other major factors influencing the results of blood analyzes are the site of collection and methods of sample handling. The sample collection site (e.g. jugular vein, carotid artery, systemic artery) can have important effects on the results. From a metabolic viewpoint, the most relevant samples would be those taken from veins coming directly from exercising muscles, especially if combined with arterial samples. These samples would allow for measurement of oxygen extraction, the consumption of various fuels, and the efflux of catabolic products. However, for practical reasons samples are most often taken from the jugular vein, which represents mixed venous blood. For some metabolites, the concentrations in jugular venous blood are similar to those in arterial blood, while others such as glucose, ketones and lactate differ.93,94 It should, however, be kept in mind that the concentration of any substance in blood is a sum of its release into and its disappearance from the blood and does not provide information about the rate of these events. Blood lactate measurement is a good example of the importance for standardization in sampling, given the differences in arterial and venous lactate concentrations93 as well as the inter-individual variation in RBC lactate transport activity that induces different kinetics in blood lactate metabolism. The choice of anticoagulants for determination of specific biochemical parameters in plasma is also crucial. Heparin is the anticoagulant of choice for most chemical determination requiring plasma; however, it must be excluded for specific measurements such as myeloperoxidase (MPO) enzyme activity (ethylenediamineteraacetic acid [EDTA] should be used).95,96 On the other hand, EDTA is a chelating agent which interferes with several chemical determinations. Fluoride/oxalate halts glycolysis by the RBC and thus is the best choice for blood glucose determination. Exercise and training induce alterations in enzyme activities related to energy metabolism.97 For example, the activities of plasma malate (MDH) and lactate dehydrogenase (LDH) change with training and reflect alterations in oxidative capacity and lipid mobilization. As previously mentioned, fatty acids with a chain length longer than 12 carbons must be transported into the mitochondria by the carnitine shuttle in which their acyl group is transiently attached to the hydroxyl group of carnitine to form fatty acyl-carnitine.98 Determination of plasma acyl-carnitine and fatty acid profiles might be of interest to better understand fatty acids metabolism in the exercising horse99 but will require the establishment of reference ranges. In the future, proteomic and metabolomic approaches may provide new insight into the metabolic responses to exercise and training. While the genome is a steady entity, its proteomes may differ according to the cell and to specific post-translational modifications that are critical to define function. In equine exercise physiology, proteomics is in its early infancy but one preliminary study has provided evidence that a proteomic approach may be useful for assessment of training level as well as detection of subclinical exercise-related conditions.100 In this study, prolonged physical exercise was demonstrated to affect plasma proteins involved in pathways related to inflammation, coagulation, immune modulation, oxidant/antioxidant activity, and cellular damage. Metabolomic profiling also may provide new insights about the responses of specific metabolic pathways.101 Metabolic changes in muscle are primarily determined by analysis of muscle samples taken by the percutaneous needle biopsy technique that was introduced to equine research by Lindholm and Piehl102 as well as by Snow and Guy.103 Biochemical, histochemical, immunohistochemical, and morphological studies performed on muscle biopsy samples have provided most of our knowledge about muscle energetic.33 Biopsy samples are usually taken from the middle gluteal muscle at a defined depth (e.g. 2, 4 or 6 cm) and at a specific location. Standardization of the site of the muscle biopsy is imperative because equine skeletal muscles have a heterogeneous distribution of muscle fiber types within the muscle.104–106 The glycolytic capacity of muscle fibers may be evaluated using stains for enzymes of the glycolytic pathway, whereas pre- and post-exercise muscle biopsy may be used to estimate glycogen utilization and to follow the recovery of glycogen stores, e.g. by use of histological stains.107–111 Immunofluorescent and immunohistochemical stains are useful to locate GLUT-4 in intracellular storage pools and in their active position within the sarcolemma.112 Assessment of the concentrations of triglycerides, glycogen, glucose 6-phosphate, pyruvate, lactate and adenine nucleotides may provide further information regarding the metabolic state of muscle at the time of biopsy. However, these local measures are ‘static’ in the same way as blood samples, and do not allow quantitative assessment of the actual rate of substrate use. In horses, muscle oxidative capacity has been classically evaluated by the activity of mitochondrial enzymes such as succinate dehydrogenase, by examining the capillary supply of muscles and/or by determining the mitochondrial volume density.19,43,102,113–116 These techniques have contributed to the characterization of the metabolic properties of diverse muscles105 in different types of horses,102,104,117,118 to study effects of growth on muscle characteristics,119 to describe muscle response to exercise and/or training,49,120–123 to improve conditioning programs (for a review, see Reference 47), and define athletic potential.124,125 These measurements have also highlighted the possible contribution of muscle oxidative capacity to maximal metabolic rate in mammals.18,19 Determination of oxidative capacity based on histological methods does not provide information on the integrative nature of mitochondrial function. Among others, the coupling of phosphorylation to oxygen consumption, transport of metabolites into the mitochondrial membrane, activity of dehydrogenases and the structural integrity of the mitochondria are key determinants of aerobic energy production. Quantitative determination of single marker enzymes or mitochondrial volume density does not take into account this fundamental concept of integrated function and assume that mitochondrial markers define oxidative capacity. Only one study has reported direct measurement of respiratory capacity, specifically by use of a Clark electrode on mitochondria isolated from equine muscle samples collected by percutaneous needle biopsy.126 High-resolution respirometry (HRR) is an advanced technology that enables the monitoring of mitochondrial respiration in small samples of permeabilized muscle fibers.127 This in situ approach allows the analysis of integrated mitochondrial function by controlling metabolic pathways. Under controlled experimental conditions, the functional capacities of mitochondria are determined by feeding various substrates, uncouplers and inhibitors into the ETS. Mitochondrial function is screened at different steps of the OXPHOS system and may be analyzed to define the various modes of mitochondrial respiratory control127 (Fig. 33.7). Standardized protocols to determine OXPHOS capacity and respiratory control patterns with HRR in horse skeletal muscle have been validated.22,128 The technique is minimally invasive since the protocol may be performed using microbiopsies collected with a 14G biopsy needle (about 20 mg of tissue is sampled by puncture). Given that fiber-type distribution is not homogeneous within the muscle,105,106 an accurate standardization of the sampling site and depth is required. The triceps brachii muscle has been selected as the reference muscle in equine studies because of its mixed composition of type I (slow-twitch) and type II (fast-twitch) fibers.105 Conveniently, the triceps brachii is safer to access for the investigator than the propulsive muscles of the hindlimb. In addition to this important advantage, the hindlimb muscles include a greater proportion (up to 90% in thoroughbred horses) of type II fibers,105 thus rendering them less useful for screening. Muscle specimens remain viable for up to 4 days when kept in a specific medium and under controlled temperature;22 thus, this methodology may be applicable for the evaluation of horses in field settings.128
Metabolic responses to exercise and training
Physiological response to exercise
Overview
Integration of various body systems
Sources of metabolic fuel
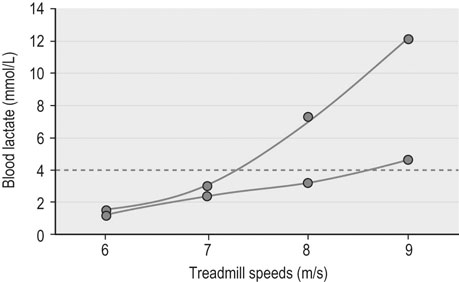
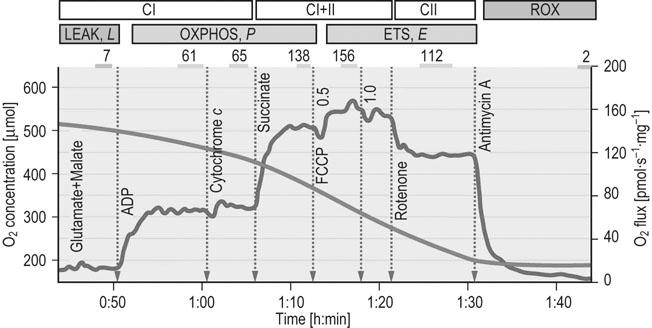
Major pathways for energy transduction
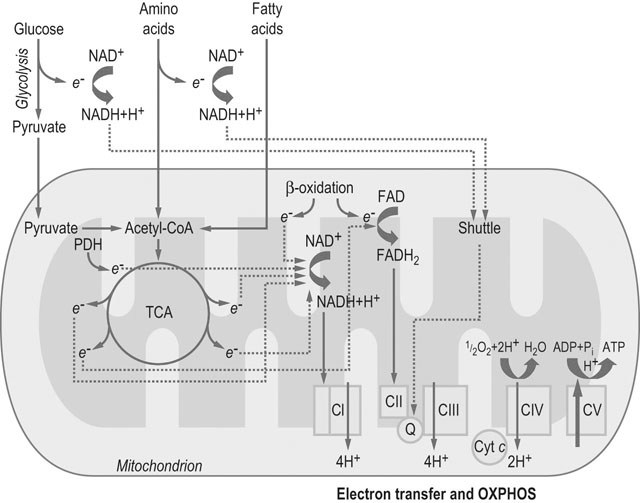
Abbreviations: PDH = pyruvate dehydrogenase complex; Cyt c = cytochrome c; Q = coenzyme Q; CI, CII, CIII, CIV, and CV = complexes I, II, III, IV and V, respectively.
Glycolysis
MOLECULE
PROCESS
DIRECT ENERGETIC PRODUCTS
END PRODUCTS
FINAL ATP1
Phosphocreatine
Hydrolysis
ATP
Total per phosphocreatine
Creatine
1
1
Glucose
Anaerobic glycolysis
Glycolysis to lactate
2 NADH (cytosolic) + 2 ATP
Total per glucose
Lactate
32+ 2
5
Aerobic glycolysis
Glycolysis to pyruvate3
Pyruvate to acetyl-CoA
TCA
2 NADH (cytosolic) + 2 ATP
2 NADH (mitochondrial)
6 NADH (mitochondrial)
+ 2 FADH2 + 2 ATP (or 2GTP)
Total per glucose
CO2, H2O
32 + 2
5
15
+ 34 + 2
30
Fatty Acids
Oxidation
β-Oxidation of palmitate5
Acetyl-CoA in TCA6
7 NADH + 7 FADH2
24 NADH + 8 FADH2 + 8 ATP
Total per palmitate
CO2, H2O
28
80
108
ADP + phosphocreatine
Creatine kinase reaction
ATP
Total
Creatine
1
2 ADP
Adenylate kinase pathway
ATP
Total
AMP
1
β-Oxidation of free fatty acids
Degradation of amino acids
Tricarboxylic acid cycle
The electron transfer system
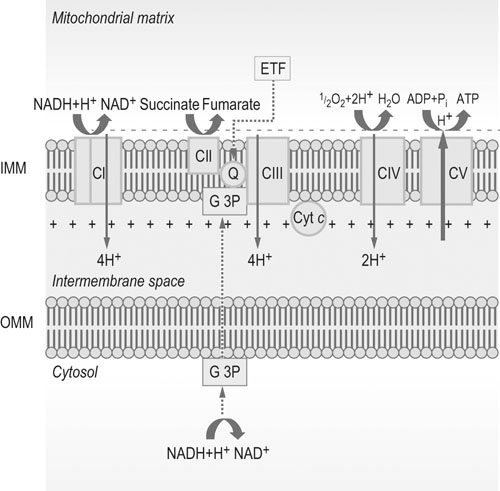
Abbreviations: IMM = inner mitochondrial membrane; OMM = outer mitochondrial membrane; Q = ubiquinone or coenzyme Q; Cyt c = cytochrome c; CI, CII, CIII, CIV, and CV = complexes I, II, III, IV and V, respectively; G 3P = glycerol 3-phosphate shuttle; ETF = electron-transferring flavoprotein.
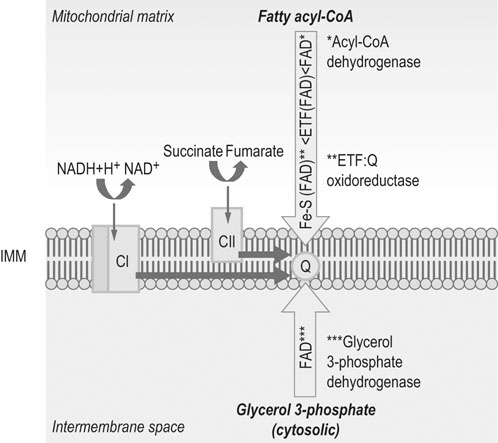
Abbreviations: IMM = inner mitochondrial membrane; Q = coenzyme Q; CI = Complex I; CII = Complex II.
Other pathways
Methods of assessing metabolic response to exercise and training
Samples and measurements to study the effects of exercise
Whole-body level measurements
Metabolic evaluation at the organ level
![]()
Stay updated, free articles. Join our Telegram channel

Full access? Get Clinical Tree


