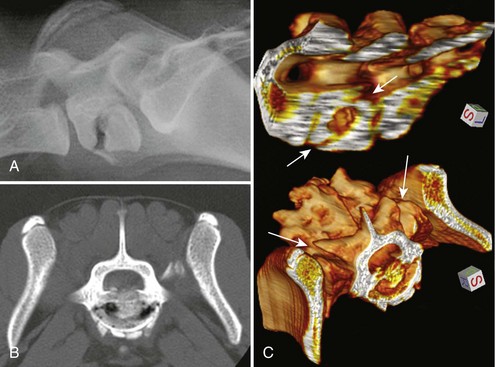
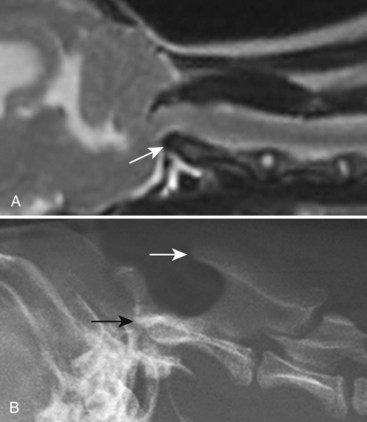
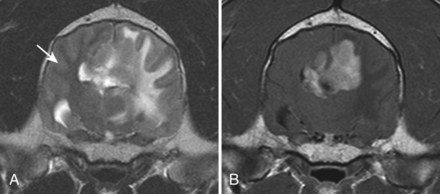
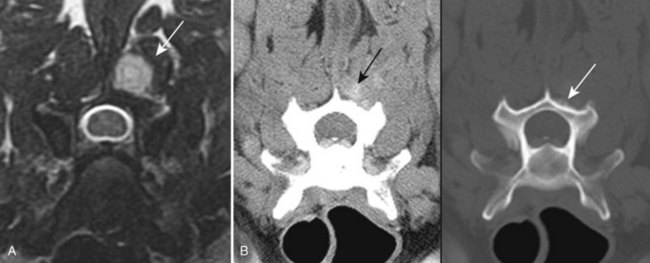
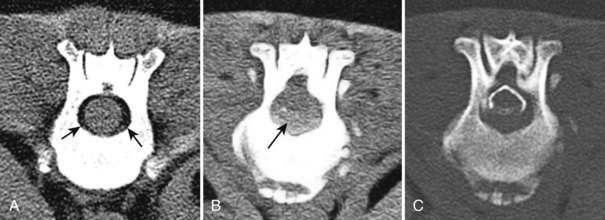
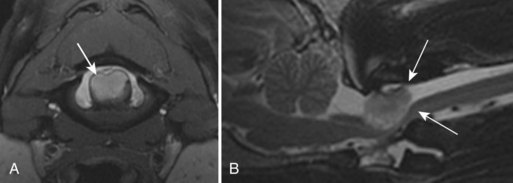
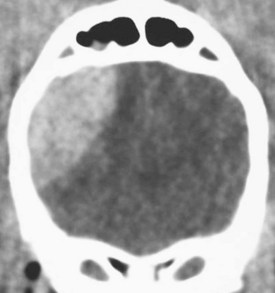
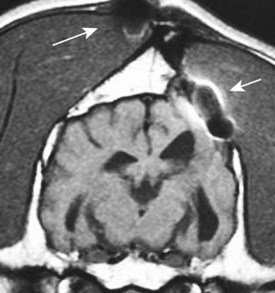
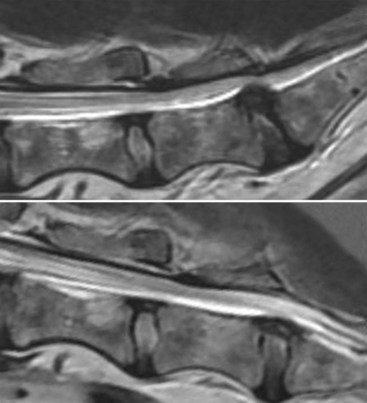
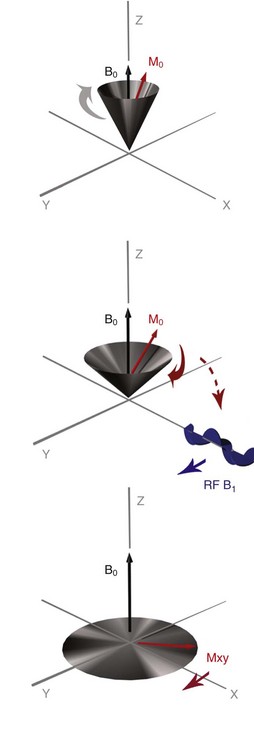
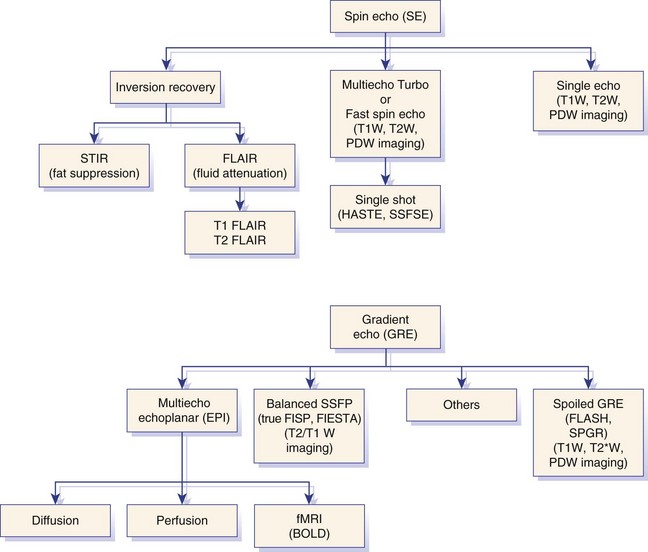
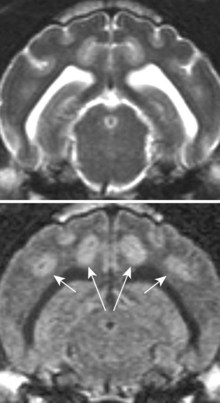
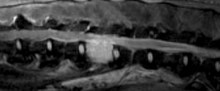
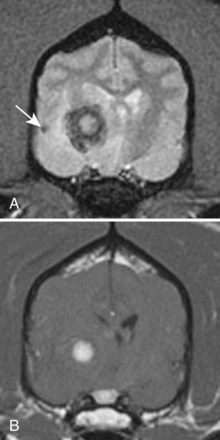
Chapter 28 The following chapter is intended to provide a core of essential neuroimaging concepts that have applicable clinical implications for the specialty of neurology and neurosurgery. We have chosen to place the emphasis on MRI and CT to reflect the absolute necessity of these imaging modalities in the practice of neurology and neurosurgery. Other modalities will be briefly discussed, but only with regard to their supplementary roles. Excellent comprehensive discussions of radiography and myelography can be found elsewhere.274 Although the choice of imaging modality depends largely on the tissues in question, access and familiarity with the different techniques also influence this decision. Because of its exceptional depiction of nervous tissue, MRI is most frequently utilized. Nevertheless, exceptions are made depending on specific circumstances and needs influenced by the modality’s advantages and limitations (Box 28-1). Unlike for other body systems, conventional radiography has limited utility in evaluating the nervous system because of its limited contrast resolution (i.e., the ability to discriminate tissues of differing composition), summation of superimposed skeletal structures, and perception problems related to geometric projection (Figure 28-1).The primary advantages of conventional radiography are its universal availability, relative speed, and ease of obtaining images. This is particularly advantageous in patients with neurologic trauma. Unfortunately, these attributes are often negated by the need for specialized radiographic projections (e.g., cranial, nasal, or bulla series) that are time-consuming to perform. Radiography provides a familiar “global” perspective that is particularly advantageous when assessing congenital vertebral anomalies and vertebral instability using dynamic views (e.g., atlantoaxial subluxation; Figure 28-2), or when needing accurate landmarks for surgical planning such as rib identification, as the presence of transitional vertebrae may be difficult to discern on tomographic images. Additionally, radiographs have the highest spatial resolution (i.e., the ability to resolve fine detail) of all the modalities and therefore may be required to further elucidate subtle lysis or periosteal new bone and fracture healing response (see Figure 28-1), even after identification with CT or MRI. Myelography is a radiographic examination of the spinal cord and vertebral column performed after the injection of contrast medium into the subarachnoid space. Abnormalities must be inferred by alterations in the contrast medium–filled subarachnoid space. Because it is invasive and is associated with adverse effects,141,273 including the intensification of preexisting neurologic signs, myelography has relatively few indications if MRI or CT is available. As with routine radiography, the perspective and resolution of dynamic cervical myelography may be necessary to aid in the diagnosis of cervical vertebral malformation/instability. Myelography is also occasionally performed with spinal CT, particularly when abnormalities identified on CT images need further clarification. CT and MRI produce images that are tomographic or slice oriented, thereby eliminating the summation effects and depth perception losses associated with radiography. In addition, CT and MR images are digital; therefore, they depict differences in tissue composition more faithfully than radiographs and can be manipulated interactively with appropriate software to produce views in any desired plane or in three dimensions. These advantages often make spatial relationships easier to conceptualize, and thus aid in surgical planning (see Figure 28-1). Contrast Resolution: Given its superior ability to discriminate between soft tissues, including gray and white matter (Figure 28-3), MRI is the gold standard imaging modality for evaluation of the central and peripheral nervous systems. Likewise, its exceptional contrast resolution permits unprecedented evaluation of soft tissue structures outside of the nervous system (Figure 28-4), thus making MRI an increasingly popular choice for a growing number of disorders. Although superior to radiography, the contrast resolution of CT is inferior to MRI (see Figure 28-4). Likewise, intracranial CT suffers from several artifacts such as beam hardening that affect the ability to image areas such as the caudal cranial fossa. This can be remedied somewhat by use of thick section reformatting of thin slices.206 Ultimately, the use of CT to evaluate intracranial structures is limited (see below, Additional Advantages and Disadvantages of CT and MRI). Within the vertebral column, resolution of modest differences in attenuation with CT is limited by the small size of the vertebral canal in dogs and cats. Within the vertebral canal, contrast is largely provided by epidural fat (Figure 28-5). When pathology reduces epidural fat, identifying the underlying lesion or its relationship with the meninges and spinal cord may be difficult. Loss of contrast can be compensated for by the use of myelography with CT; added contrast between the subarachnoid space and the spinal cord helps to delineate intradural and extradural structures (Figure 28-5, C). In some instances, pathology may increase contrast in the epidural space by the addition of tissue with greater attenuation. For example, acute hemorrhage and mineralization are usually readily identified, as they are relatively hyperattenuating (bright) in comparison with the spinal cord (see Figures 28-1 and 28-5). For this reason, CT can be used in the evaluation of chondrodysplastic dogs with suspected intervertebral disc disease, with the assumption that the herniated disc material will contain mineral or hemorrhage.186 It is critically important to recognize that the choice to use CT is based on the validity of two assumptions: that the cause of the clinical signs is the result of intervertebral disc disease, and that the herniated disc material will be mineralized. When these two assumptions can be made with a high degree of certainty (i.e., when the patient is a chondrodysplastic dog with an acute onset of clinical signs), CT may be an efficient and effective imaging modality to use. However, in nonchondrodysplastic dogs or in chondrodysplastic dogs in which the most likely diagnosis is not intervertebral disc disease, CT may not resolve the lesion. In such cases, MRI or CT with myelography should be considered. Spatial Resolution: CT affords a relatively detailed evaluation of bone, as its spatial resolution is superior to MRI (see Figure 28-4). On an MR image, tissues devoid of hydrogen protons will have no signal; dense cortical bone is therefore very hypointense (black) on an MR image (see Figure 28-3; Figure 28-6), making subtle fracture lines, cortical lysis, or periosteal new bone (see Figure 28-4) difficult to resolve. This does not mean, however, that MR images have no utility in bone evaluation. To the contrary, when pathologic soft tissues infiltrate and replace the normal signal void of bone, bony abnormalities become apparent (see Figure 28-6). The same applies when the hyperintense (bright) signal of fat within bone marrow is altered by pathology (see Figure 28-6). Thus, although CT is generally thought to be a superior bone imaging modality, the opposite may be true with an infiltrative type of pathology. With MRI, images from each anatomic plane are obtained using separate acquisitions. Because they are acquired directly, the spatial resolution of sagittal and dorsal plane MR images is generally superior to that of reformatted CT images. Although this makes an MRI study more time consuming, the added perspective gained by direct multiplanar MR images is invaluable for elucidating the precise localization or extent of disease (Figure 28-7). Additional Advantages and Disadvantages of CT and MRI: Because CT readily identifies acute hemorrhage and fracture, it is often considered the first line for imaging in patients with neurologic trauma (see Figures 28-1 and 28-5; Figure 28-8). Moreover, the time needed to acquire CT images is generally shorter than for MRI; this may be advantageous in the immediate posttrauma setting, especially if monitoring or access to the patient inside the magnet gantry is limited. In addition, because each MR sequence takes several minutes, patient and physiologic motion can degrade image quality. Likewise, metal in the scan field (e.g., orthopedic implants, drill bit shavings65 [Figure 28-9], identification microchips, gunshot pellets) can render all or parts of an MR image nondiagnostic. Despite all of these drawbacks, MRI may still be necessary if the contrast resolution of nervous tissue is insufficient with other modalities. Both CT and MR imaging use contrast media to help improve contrast resolution and provide insight into the vascularity and perfusion of pathologic processes. Intravenous administration of both iodinated CT and gadolinium-based MRI contrast medium agents is associated with moderate hemodynamic alterations but no adverse systemic effects in dogs203 and cats,204 whereas serious side effects are known to occur in people.142,170,215 Angiography may be performed without selective catheterization with both CT and MRI, and in some MRI studies, without the need for contrast media. Dynamic imaging of the vertebral column (images acquired in different anatomic positions [flexed, extended, or distracted]) can be performed with MRI or CT, although the ability to obtain direct sagittal images usually makes this more feasible with MRI (Figure 28-10).195 MRI can provide physiologic information through the use of specialized pulse sequences; these include brain perfusion, brain diffusion, spectroscopy, and brain activation (also known as functional MRI, or fMRI).8,55,101,213 Finally, MRI does not use ionizing radiation; nevertheless, its magnetic field and radiofrequency energy pose safety concerns for both the patient and personnel. Ultrasonography has a limited role in neurologic system imaging because of the inability of sound waves to penetrate bone. Nevertheless, sonography can be used to evaluate the brain and spinal cord using a natural acoustic window (e.g., bregmatic fontanelle, foramen magnum) or intraoperatively and postoperatively if a window is created with a craniotomy/craniectomy or laminectomy.* Sonography can be used to visualize pathology of the brachial plexus, lumbosacral plexus, and peripheral nerves, and to guide tissue core or fine needle aspiration biopsy if the acoustic window is sufficient.† Abdominal sonography (along with thoracic radiography) may also be warranted in patients with intracranial disease before advanced diagnostics and therapeutics, given the high rate of unrelated neoplasia in dogs with primary intracranial tumors.229 Perhaps the largest role that ultrasonography and scintigraphy have is in the identification of portosystemic shunting in animals with hepatoencephalopathy.41,238 Although not commonly performed in the clinical setting, single photon emission computed tomography (SPECT) and positron emission tomography (PET) are also used to detect alterations in brain perfusion and cellular metabolism.56,137,156,198 As the patient table is moved through the donut-shaped housing or “gantry” of the CT unit, images are constructed as an x-ray tube within the gantry rotates around the patient while emitting x-ray photons.225 Similar to conventional radiography, attenuation of photons occurs as they pass through the patient and is largely related to electron density. Directly opposite the x-ray tube, electronic detectors (as opposed to film) absorb the remaining x-rays and convert them into a digital signal. Through a process called back-projection, computer-generated images of each slice of the scanned anatomy are constructed. Depending on the sophistication of the CT unit, detectors may be arranged in single or multiple rows. Images can be obtained as a discrete transverse section or slice, after which the table is advanced and another image is acquired. Alternatively, data can be acquired continuously as the patient table is advanced, resulting in a spiral acquisition. From this volume of data, images are then displayed as discrete slices. Contrast in CT arises from tissues that differ in their ability to attenuate x-rays. Attenuation values are visually discriminated in the image as different shades of gray but are assigned Hounsfield unit measurements after standardization with water (Table 28-1). Thus, by using region of interest tools, the x-ray attenuation of a specified volume of tissue can be quantified. Quantification provides a guide to the composition of the tissue and serves as an aid for determining whether a tissue is normal (see Figures 28-1, 28-5, 28-8). Hounsfield unit measurement may be useful if tissue composition is uncertain based on subjective visual assessment of the gray level. However, the Hounsfield unit is not specific for a substance and therefore should serve only as a guide, as many combinations of various tissue types, theoretically, will yield the same Hounsfield unit value.248 For example, a Hounsfield unit of 90 could indicate acute hemorrhage or soft tissue combined with mineralization or less common combinations. Table • 28-1 Hounsfield Unit Measurements for Various Substances Although Hounsfield units and their corresponding gray shades have a direct relationship (i.e., the higher the Hounsfield unit, the greater the brightness level on the monitor), it is not always beneficial to apply the entire selection of gray shades, or the gray scale, to the entire range of attenuation values across the image.248 A process called windowing allows the operator to manipulate the gray scale by first selecting the tissue of interest (window level) and then determining what range of tissues around it (window width) will appear gray. For evaluation of neuroparenchyma or other soft tissues, a narrow window width is used to apply the gray shades only to soft tissues, thereby improving their discrimination. (Substances with values above and below the range will appear white and black, respectively.) For bone or lung evaluation, a wide window width is needed to encompass the wide range of tissues potentially found in these organs. Substances that can be discriminated on a CT image (in order of increasing monitor brightness) include gas, lung, fat, water or other fluids such as cerebrospinal fluid, normal and abnormal soft tissues, mineral, dense bone, and metal, including iodinated contrast medium. Soft tissues that appear less opaque than normal (or are “hypodense” or “hypoattenuating”) may be cystic or fluid filled, necrotic, or edematous, and may have fatty infiltration or contain gas (see Figure 28-1). Soft tissues that appear more opaque than normal (or are “hyperdense” or “hyperattenuating”) may contain hemorrhage (because of the globin in hemoglobin, fibrin, or clot retraction; see Figure 28-8), mineral (see Figure 28-5), or metal (see Figure 28-5, C), or may be densely cellular (particularly those tissues with cells that have a high nuclear-to-cytoplasmic ratio) or densely fibrotic.248,278 The MRI process is described as follows54,86,168,205,248: 1. During the scan, the patient lies within the bore of a very strong magnet. Alongside the body part of interest are specialized coils for transmitting and receiving radiofrequency waves. When the hydrogen protons of the body experience the strong field of the magnet, they align with the field, somewhat akin to the needle of a compass placed next to a bar magnet. (By convention, the direction of the magnetic field of the scanner [often denoted as B0] is in the Z plane of a three-dimensional Cartesian coordinate system, with the magnetic fields represented by vectors denoting direction and magnitude. The coils are positioned in the X-Y plane.) 2. Unlike the response of the compass needle to a bar magnet, the protons do not simply align parallel to the magnetic field, but instead begin to wobble or “precess” around the axis of the field. This is analogous to a spinning top that responds to gravity’s pull by wobbling downward rather than simply falling over. Protons and spinning tops precess because they have angular momentum—a property that keeps spinning objects in motion in response to an applied force. Thus, rather than simply aligning with the force, the object rotates around its axis. In addition, some of the protons (or “spins”) are observed to align in the direction of B0 (spin-up), and some in the opposite direction (spin-down). Because an excess number of spins is observed to align with the field, a net vector of magnetization (longitudinal magnetization, M0) is created in the “up” direction (Figure 28-11, top image). 3. The rate at which a spinning object precesses is proportional to the strength of the applied force, such as the magnetic field produced by the MRI unit. Thus, the spins precess with a frequency (Larmor frequency) that is proportional to the strength of their local magnetic environment. Although the main determinant of a spin’s Larmor frequency is the strength of the magnet itself, other static magnetic fields (in the form of applied encoding gradients—additional magnets that add to or subject from the main magnetic field in a graded manner) and magnetic substances within tissues (e.g., hemoglobin), as well as the randomly fluctuating magnetic fields of neighboring protons, also contribute. 4. The spins are then perturbed by radiofrequency pulses through a process called excitation. Because radiofrequency waves are a form of electromagnetic energy, they create both electrical and magnetic fields. With the application of radiofrequency energy, M0 now experiences a second magnetic field (denoted as B1) and begins to precess about this force while simultaneously precessing about the strong field of the magnet, B0 (see Figure 28-11, middle image). This simultaneous precession causes a downward spiraling or “nutation” of M0 toward the X-Y plane. Thus, radiofrequency excitation serves to generate a precessing field of magnetization in the X-Y plane (transverse magnetization, MXY; see Figure 28-11, bottom image). It should be emphasized that B1 of the radiofrequency pulse must precess in resonance (i.e., at the same frequency as M0); otherwise, the two would be out of sync with each other, and the precession of M0 around B1 and subsequent nutation would not be possible. For this reason, the resonance phenomenon is critical to radiofrequency excitation, hence the name magnetic resonance imaging. 5. As soon as the desired amount of transverse magnetization is generated, the radiofrequency pulse is removed. According to the law of electromagnetic induction, which states that a magnetic field that is changing in strength and direction will generate an electrical voltage in a coiled wire, this precessing (time varying) transverse magnetization creates alternating current in the receiver coils positioned in the X-Y plane as stored radiofrequency energy is released. This measured current is the MR signal. This signal immediately begins to decay as protons relax and (1) return to a state of equilibrium, allowing longitudinal magnetization to recover (described by a time constant called T1 recovery), and (2) stop precessing in unison or “dephase” (described by a time constant called T2 decay). Dephasing occurs because the Larmor frequencies of the spins making up MXY are heterogeneous; this heterogeneity, in turn, is influenced by inhomogeneities in the magnetic field, as described in item 3 above. 6. T1 and T2 relaxation are different for different types of substances and are influenced by characteristic properties, namely, the interaction of the proton with its environment and with neighboring protons, respectively. Thus, when the sequence of radiofrequency excitation followed by relaxation (in a process called a pulse sequence) is repeated numerous times, subsequent signals from different tissue types will have different strengths. This variation in signal intensity, which varies widely between tissues, provides contrast within the image and can be accentuated by the MRI technician by manipulating certain parameters in the pulse sequence through a process called weighting. 7. To create a meaningful image, the signal intensities from various tissues within the body must be localized first to an image slice, then to a position within that slice. By a process called spatial encoding, additional magnetic fields (encoding gradients) are superimposed over B0 to predictably alter the Larmor frequencies of spins in a graded linear fashion along one of three orthogonal axes. Because of the resonance phenomenon, only those spins whose Larmor frequencies are in sync with the transmitted radiofrequency frequency will undergo excitation, as described in item 4 above. The desired slice location therefore can be chosen by turning on the slice selection gradient while transmitting radiofrequency pulses at a selected frequency. Within that slice, additional gradients are applied to alter the phase and frequencies of spins, again in a predictable graded fashion, but this time while the signal is being measured. This permits a direct correlation between frequencies in the measured signal and the position of spins along these gradients. By a process called Fourier transform, various signal amplitudes or strengths for each of the frequencies can then be deciphered. These amplitudes or signal intensities determine the brightness or gray levels for each picture element (pixel) located within the image slice. A pulse sequence is simply the series of timed events by which a radiofrequency pulse is used to create signal.205 Because the signal following the excitation of protons is short-lived, an “echo” of that signal is created by the application of additional pulses by one of two basic methods: spin echo or gradient echo. T1 and T2 relaxation occur simultaneously following the radiofrequency excitation pulse, regardless of the type of pulse sequence. Nevertheless, by altering the timing between successive radiofrequency excitation pulses, (echo time) or the timing of the echo (repetition time), the relative contribution of T1 or T2 relaxation to image contrast can be controlled. Images are referred to as T1-weighted (T1W) or T2-weighted (T2W) (see Figure 28-3). Alternatively, images can be weighted based largely on the density of protons in the tissue (proton density–weighted). If the operator selects a short TR, the differences in signal intensity between tissues that differ in T1 relaxation times will be accentuated, and the image will be T1W. For T2-weighting, the operator selects a long echo time to maximize T2 contrast in the image. Despite the vast number of vendor-specific names, abbreviations, and acronyms, it is important to remember that spin echo and gradient echo are the only pulse sequences upon which all others are built. Other sequences are variations intent on optimizing desired effects. For example, the basic spin echo and gradient echo pulse sequences can be modified to create sequences that reduce scan times, accentuate tissue contrast or anatomic detail, suppress signal from certain tissues, identify hemorrhage, or emphasize physiology or function.8,21,55,101,213 A taxonomy of pulse sequences is illustrated in the schematic in Figure 28-12.21 Spin Echo and Multiecho Fast Spin Echo: Spin echo and multiecho fast spin echo or turbo spin echo pulse sequences are considered the “workhorse” of clinical MRI and are used to produce T1W, T2W, and proton density–weighted images. With these sequences, an additional RF pulse is applied to refocus the initial decaying signal by creating an echo of that signal. This eliminates signal losses due to static inhomogeneities in the field, thus only true (intrinsic to the protons of a specific substance) differences in T2 relaxation influence T2 contrast in a spin echo sequence. Because image acquisition is rapid, fast spin echo is routinely used for long echo time (i.e., T2W) images. The most significant difference is the relative brightness of fat on a fast spin echo (moderately hyperintense) compared with a single echo image (less intense). Taken to the extreme, fast spin echo images can be produced by using only one radiofrequency excitation pulse or “shot.” These ultrafast images (e.g., HASTE [Siemens], SSFSE [General Electric]) are acquired in a few seconds. Cerebrospinal fluid and other fluids with long relaxation times are very hyperintense, so single-shot multiecho images are used occasionally for rapid evaluation of the subarachnoid space.194 They can also be used for diffusion weighting.149 Inversion Recovery—T1 FLAIR, T2 FLAIR, STIR: An inversion recovery pulse sequence is simply a spin echo sequence preceded by a 180-degree radiofrequency pulse. On these sequences, signal from fluid (fluid-attenuated inversion recovery, FLAIR) or fat (short tau inversion recovery, STIR) is suppressed. T1 FLAIR sequences are T1W and are sometimes obtained instead of conventional spin echo because of their superior contrast-to-noise ratios, especially at high (3 Tesla) field strengths. They can be interpreted similarly to conventional T1W spin echo images. T2 FLAIR images have dual weighting (i.e., they are both T1W and T2W), with the latter influenced by the use of a long TE. Advantages of T2 FLAIR images include the ability to distinguish “pure” fluid (fluid with little to no protein content such as cerebrospinal fluid) structures (nulled signal) from solid but high water content lesions such as edema within tissue (high signal) and the improved conspicuity of hyperintense lesions compared with spin echo T2W images. This sequence is particularly advantageous for periventricular or perisulcal lesions that are hyperintense on T2W images that blend into the hyperintense cerebrospinal fluid (Figure 28-13). It is important to recognize, however, that quite often high protein mucinous fluid (e.g., within the tympanic, nasal, and paranasal cavities) will not completely attenuate.248 On STIR images, fluid or solid tissues having high water content are hyperintense and conspicuous against a background of suppressed fat. Although most STIR sequences are not truly T2W (because a short echo time is usually used), the signal characteristics on STIR may be interpreted similarly to T2W spin echo images, except for the suppressed fat. STIR images provide a useful screen for vertebral and paravertebral soft tissue pathology (Figure 28-14), as the high signal of fat within marrow is suppressed. STIR can usually identify fat composition, although any substance with similar short T1 relaxation will be suppressed.46 Gradient Echo: In a spin echo pulse sequence, the mechanism used to produce the echo corrects for signal loss influenced by inhomogeneities in the magnetic field. Some of these inhomogeneities are associated with magnetic substances found in the patient (e.g., hemoglobin); others are created by applied gradient fields. In a gradient echo pulse sequence, the mechanism that produces the echo corrects only dephasing of protons influenced by applied gradient fields—not the other static inhomogeneities. T2 contrast in gradient echo images, in reality, therefore reflects true T2 relaxation plus that influenced by static (nongradient) inhomogeneities and is more appropriately termed T2* contrast. The importance of this is that gradient echo images therefore are very prone to signal losses at magnetically diverse interfaces. This propensity is responsible for deleterious signal void artifacts (e.g., at air-tissue interfaces near the frontal sinuses) that often obscure adjacent tissues. Nevertheless, this propensity can be intentionally exploited to identify hemorrhage. Spoiled Gradient Echo: The most basic gradient echo sequence is the spoiled gradient echo (e.g., FLASH [Siemens], SPGR [General Electric]). It can produce T1W or proton density–weighted images faster than the corresponding spin echo sequences, but may suffer from reduced image quality. Spoiled gradient echo with a long echo time (T2*W) will accentuate T2* contrast and is routinely used for the detection of some stages of hemoglobin within blood clot (Figure 28-15).193
Imaging of the Neurologic System
Advantages and Limitations of Neuroimaging Modalities
Radiography
Tomography: computed tomograpHy and magnetic resonance imaging
Choosing the Most Appropriate Tomographic Imaging Modality
Ultrasonography and Scintigraphy
Fundamentals of CT and MRI
CT
Tissue Contrast in CT
SUBSTANCE
HOUNSFIELD UNIT
Air
−1000
Fat
−100 (approximately)
Water
0
Brain (white matter slightly lower than gray matter)
30 to 40
Acute to subacute clotted blood
60 to 100
Mineral and bone
Variable
(e.g., 100 to >1000)
Metal (e.g., iodine)
Variable, depends on dilution
(e.g., 100 to >3000)
MRI
Pulse Sequences and Weighting
< div class='tao-gold-member'>
![]()
Stay updated, free articles. Join our Telegram channel

Full access? Get Clinical Tree