5 Energy systems and requirements
Introduction
“The food is by no means ready to enter directly into the composition of the tissues of the body and add to its store of potential energy, but on the contrary, a very considerable amount of energy must be expended in the separation of the indigestible matters from the digestible and in the conversion of the latter into such forms as are suitable for the uses of the living cells in the body” (Armsby 1903).
Currently a variety of energy systems are available to calculate requirements for horses and to balance this with the provision of energy from feed. Each system has its strengths and weaknesses which has led to intensive and passionate discussion amongst scientists (Julliand & Martin-Rosset 2004). This chapter will give an overview of the main systems and discuss their practical application. The first section will try to provide a general understanding of the systems and their application and the second section will focus on more scientific details and an in depth discussion of systems. However, it is worth while to briefly reflect on why this area of nutrition science is so “exciting” and controversial.
Energy balance and defining energy units
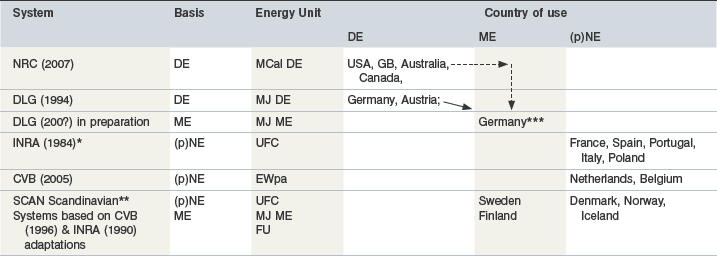
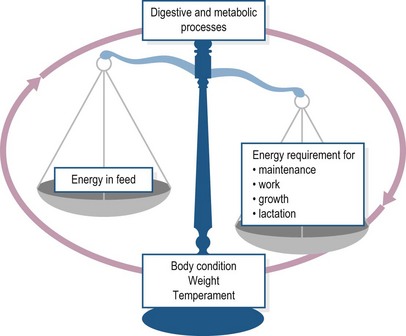
Current energy systems (Table 5-1) try and predict the requirements of an individual animal (whether these are described in terms of GE, DE, ME, NE or any other unit), and match these against the supply from feed, i.e. match supply with demand and maintain the balance as illustrated in Fig. 5.1. Both supply and demand will depend on, and vary according to, a host of influencing factors which affect the digestive and metabolic processes (see Fig. 5.2). The energy value assigned can be obtained in several ways, each of which take into account different metabolic and digestive processes. This leads to a distinction between the energy units used. However, as long as the same energy unit (e.g., MJ digestible energy [DE] or MJ net energy [NE]) is used within a particular system a good balance can be obtained. A detailed discussion of the advantages and the disadvantages of each unit can be found at the end of this chapter.
Table 5-1 Energy Systems for Horses Currently in Use, Their Basis and Energy Units Used.
The arrows predict the change in energy units that will occur (→) shortly (DLG 2011) and which may possibly occur ( ) in the next few years.
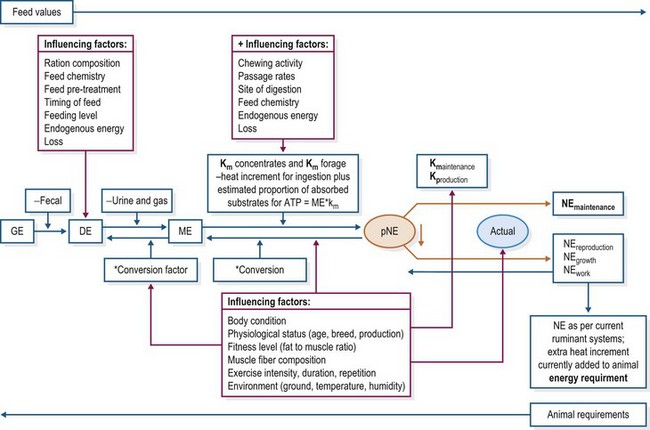
In equine NE systems there is distinction made between energy for maintenance, production and/or work for requirements only, whereas ruminant systems distinguish between maintenance (m) and production (p) (i.e., km and kp) only, but both for requirements and feed supply. Van Soest (1994) defined the net energy available from a feed for a given animal as being the energy value realized in the form of product. Such a product can be measured through the energy “content” of animal tissue (growth in kg) or milk output but is much harder to define in terms of “work” or “horsepower”. Current NE systems for horses therefore only determine the “product” at “maintenance” level with respect to food values – by estimating the end-substrates of food absorption which are then available for net use. With respect to requirements, the evaluation of the net energy used for work has been directly linked to oxygen consumption. This has resulted in the derivation of various equations which convert the ml of O2 used above maintenance into energy values (Coenen 2005, Pagan et al 2005). In summary, Fig. 5.2 illustrates how the energy from feed and the energy required by the horse can be assessed. In terms of feed energy we move from left to right → of the pathway, starting with GE. Requirements, however, can only start to be measurable, using currently available techniques, at the ME and NE point and move from right to left ← up to the point of DE. The figure also highlights in gray boxes some of the major factors that influence the actual energy value that can be derived from feed and that is available to the horse.
The key factors at the feed or animal level which influence the actual energy value provided or required are shown in the gray boxes in Fig. 5.2. Herein lies the main problem and challenge – our energy systems are trying to fit a dynamic living process (energy metabolism, metabolic processes, multiple interactions) into a static list of values for supply and demand/requirement. The challenges are compounded as the methods we have currently at our disposal to measure these values at a given (static) point in time are often indirect and require additional calculations/estimations. Nevertheless, the ongoing process of gaining new knowledge and understanding of energy metabolism and supply has allowed us to optimize and continuously improve feeding systems and practices for production across different species, whether “production” is defined as athletic performance, growth, weight-gain, or lactation. In addition, it has given us vital understanding of the involvement of nutritional factors in maintaining health and wellbeing in the horse.
Practical application of energy systems
In practice, the nutrition scientist can use the various formulas provided by each system to firstly calculate (a) feed values (Tables 5-2 and 5-3) and (b) energy requirements of horses (Tables 5-4, 5-5, and 5-6) and apply these to ration calculation and evaluation. They can then apply their knowledge of nutrient absorption and metabolic conversion in order to determine, as far as possible, the optimal chemical composition of the feed that should be provided for conversion into energy. This will vary according to the type and intensity of exercise and also needs to take into consideration the maintenance of good health and welfare.
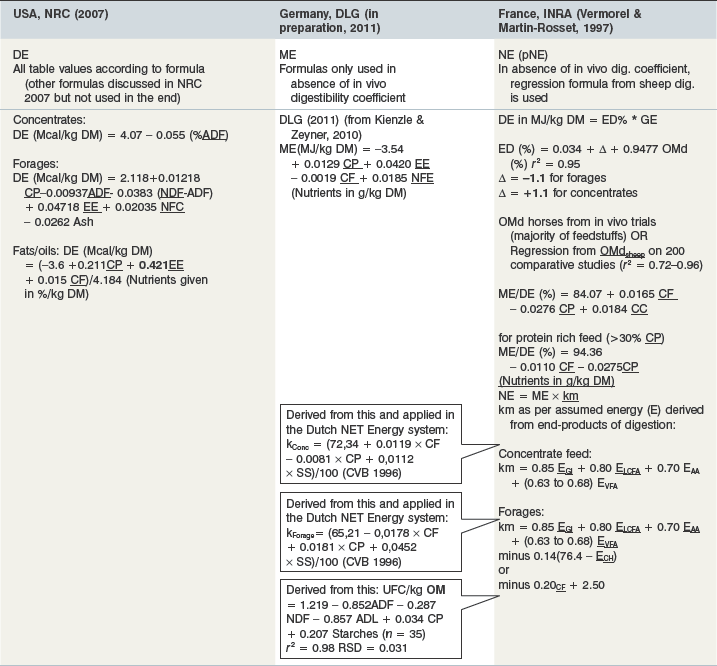
Table 5-2 Equations to Derive Feed Energy Values
CP = crude protein, CC = cytoplasmic carbohydrates (INRA 1997) = starch + watersoluble carbohydrates; SS = starches and sugars); NFC = nonfibrous carbohydrates [NFC = 100 − %NDF – % CP − % Ash]; NFE = nitrogen free extractives (1000 − CP − CF − Ash-EE – in g DM); NDF = neutral detergent fiber; ADF = acid detergent fiber; ADL = acid detergent lignin; Gl = glucose, LCFA – long chain fatty acids; VFA = volatile fatty acids; ECH = in vivo energy cost of eating.
Table 5-3 Average Feed Energy Values Per kg Product (Wet Matter/as Fed) Listed according to the 3 Most Common Systems (Wet Matter Adjusted according to a Common DM Denominator So Using Same DM Values)

Table 5-4 Equations from a Number of Systems to Calculate Maintenance Energy Requirements and example of how much hay (in kg WM) would fulfil Requirements of a 500 kg Horse at Maintenance
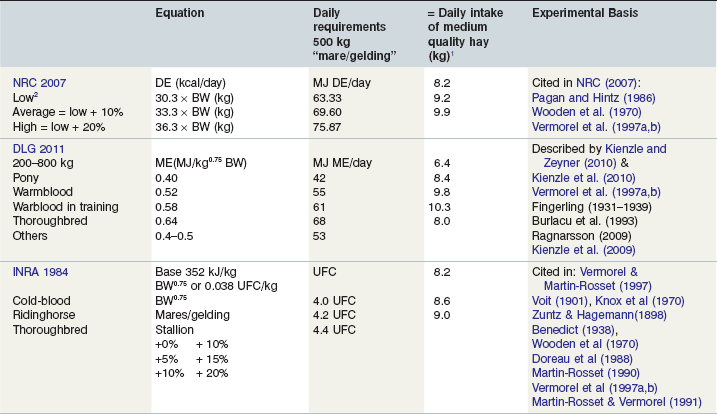
1 Using energy values given by each system in the tables for a medium quality hay as per Table 5-5 above (NRC: Mcal/kg WM = 1.86 Mcal DE; DLG:5.6 MJ ME; INRA: 0.49 UFC).
2 Low: Direct result from “stalled” horses in experiments, sedentary lifestyle; old horses (arthritic); stable rested; injured; small ponies; “good doers”; Average: normally moving around horses; walking in paddock; High: Highly strung; nervous; increased voluntary activity; young horses; stallions; “bad doers”.
Table 5-5 Energy Requirements for Broodmares and Youngstock
| System | Equation | Experimental basis |
|---|---|---|
| NRC 2007 Gestation <5 months gestation >5 months (PU = placental and uterine, G = gain) | DE (Mcal/day) As average maintenance (0.033BW) + (0.033 × 2 × (Fetal mass + PU mass) + [(0.03 × Fetal G × 9.4) + (0.2 × Fetal G × 5.6)]/0.6 | PU data from 5 studies; Fetal gain data from Meyer & Ahlswende (1976) and Guissani et al (2005) For calculation of PU and Fetal G see NRC (2007) |
| Lactation <700 kg (high maint.) >700 kg (average maint.) Milk value 1 month = 0.0324, 2 month = 0.0299, 3 month = 0.0271 4 month = 0.0244 | (0.0363*BW) + (Milk production × 500)/600 (0.0333*BW) + (Milk production × 500)/600 Milk Prod = Milk Value × (month of lactation − 1) × BW | Hoffmann et al (1998) Santos et al (2005) Martin et al (1992) Doreau et al (1992) |
| Foal Maintenance1–18 months (X = age in month) + Growth (ADG = average daily gain) ADG calculated (MBW = mature Bodyweight) | (56.5X−0.145) × BW + (1.99 + 1.21X − (0.021X2)) × ADG MBW* (6.97 × Exp (−0.0772 × Age))/(30.4 × 100) | Ousey et al (1997) Cymbaluk et al. (1990) Based on mean values of 18 studies cited in NRC (2007) including various breeds: Morgan, Warmblood, Quarter horses, TB, Belgian, Arab, ponies |
| DLG 2011 (in preparation) Gestation For conceptus, d = day of gestation (d 240–340) Lactation (in preparation) d = day of lactation (klactation = 0.6; conversion from NE to ME) Foal (in preparation) | MJ ME/kg Birthweight = 0.418 0.000508848 × e(0.0154d) plus maintenance kJ ME/kg BW0.82 = 141.3 × d0.1727 × e−0.00539d/0.6 plus maintenance in preparation | Presented in Coenen et al (2010a) Schmidt & Coenen (2010) Coenen et al (2010b) |
| INRA 1984* Gestation (For fetus: Y=%BW from Birthweight, a = chemical composition, GE, kproduction = 0.25; X = days of pregnancy) Lactation (GE = GE/kg milk, klactation = 0.65) Milk yield/100 kg BW 1 month = 3 kg GE = 2.4 2–3 month = 2.5 kg GE = 2.09 4 month = 2 kg GE = 1.98 Foal a = maintenance requirements, bG = calorific value of daily gain 1.4 = allometry coefficient of adipose tissue in total BW | NE (MJ/day) = (0.351 MJ/kg BW75) + (Y × a × GE × km/kp) UFC/day = NE/9.42 Y = −1.99 + 13.67 – 37.38X2 + 45.51X3 − 18.32 NE (MJ/d) = (0.351 MJ/kg BW75) + (kg Milk × BW/100 × GE × km/kl) UFC/day = NE/9.42 NE (UFC/kg BW0.75/day) NE = a + bG1.4 | Described in Martin-Rosset et al (2006a) Doreau et al (1991, 1992) Described in Martin-Rosset et al (2006b) Doreau & Boulot (1989) Doreau et al (1992) Described in Martin-Rosset & Ellis (2005) |
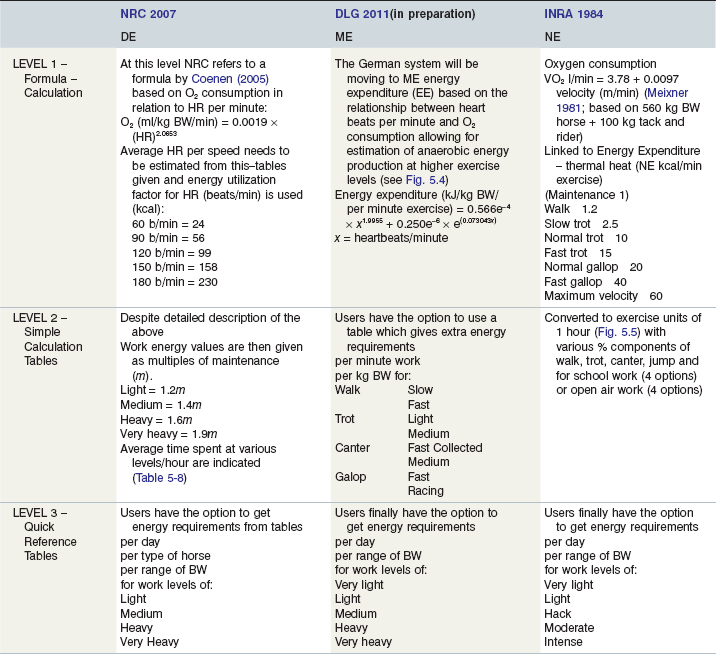
Table 5-6 Summary of Various Levels of Calculations and Tables Used to Estimate Energy Requirements for Work per System
The various equations can be used to derive table values, per system, which in turn can be applied to energy balance calculations (Table 5-3). This highlights that the values in the tables themselves cannot be compared directly as they are given in different units within a system.
The more applied nutritionist will tend to use tables, which give pre-estimated or measured values according to the type, lifestage and work of the horse, etc., rather than use the calculations. An example of how these summary calculations work for maintenance in a 500 kg horse, on medium quality grass hay is given in Table 5-4. This highlights the fact that despite some differences in the theory behind each system and the units used the practical feed recommendations are fairly similar. However, it is essential to understand that systems and units cannot be “mixed” or easily converted unless all the measures from that particular system are taken into account. This is one of the reasons why INRA (1984), Finland (Austbo 2004) and the Dutch system (CVB 1996) introduced a final conversion factor which moved them away from Mcal and MJ units, as the temptation to compare DE Mcal with NE or ME Mcal would be there for the less knowledgeable lay person.
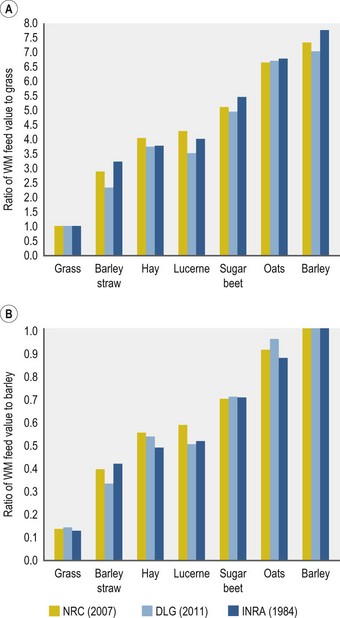
Taking the approach of comparing the energy of a feed in relation to another feed within the same system can give some idea of differences in feed evaluation between the systems. Figure 5.3 shows the wet matter energy ratio of feeds either in relation to grass energy values or to barley energy values. It is important to note that this is “as fed”/wet matter/product and the calculations stated above have been used rather than in vivo table values.
As can be seen the energy values of forages in relation to that of grass, are fairly similar between all systems. However, differences occur with respect to the concentrate feed. This is due to the French NE system giving concentrates a higher value possibly due to the systems’ equation’s inclusion of sugar and starch when estimating energy content (Fig. 5.3A
Stay updated, free articles. Join our Telegram channel

Full access? Get Clinical Tree


