22 Assessment of body condition and bodyweight
Introduction
Assessment of a nutritional program is facilitated by measuring the outcome or end result of its application. When assessing the energy balance of a particular nutritional program, it is necessary to monitor an individual’s alteration or stability of body mass. Excess consumption of digestible energy above what is required for maintenance, or a positive energy balance, is apparent by the accumulation of primarily adipose tissue in mature horses. Conversely, digestible energy intake below maintenance requirements, or a negative energy balance, would result in the loss of adipose and eventually muscle mass. Therefore, measurements of bodyweight and, if possible, lean and adipose tissue mass may be used to assess energy balance. The scoring of body condition, originally developed for production animals as an indicator of “flesh” (lean and adipose tissues) (Jeffries 1961), has become a commonly used tool for the assessment of body fat in horses and ponies (e.g., Henneke et al 1983). This method, however, has not been thoroughly validated for this purpose. Nevertheless, it offers a practical method for researchers and horse-owners alike to monitor overall nutritional status.
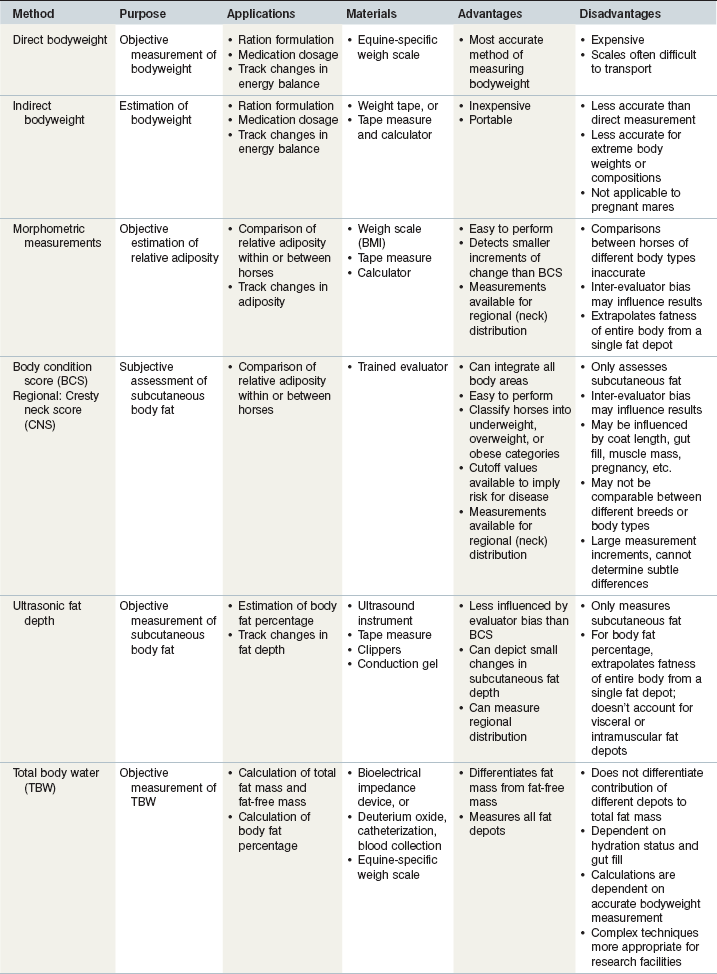
Bodyweight and body condition assessments are important tools for developing dietary rations that are appropriate for maintaining the optimal health of an individual horse. With these tools, it is possible to calculate digestible energy requirements, track changes in energy balance, and classify an animal’s condition (e.g., underweight or overweight). This chapter discusses methods of assessing bodyweight and body condition in live equidae. A range of methods applicable to both clinical and research settings is provided, with the advantages and disadvantages of each outlined (Table 22-1). Additionally, appropriate methods for the assessment of regional fat distribution and considerations for choosing an appropriate assessment method are summarized.
Methods of assessing bodyweight
Direct measurement
Bodyweight is most accurately measured in horses by use of a calibrated weigh scale. Various scale designs are available, with some more portable models available. It is important that the scale is properly calibrated and leveled in order to obtain an accurate weight measurement. Fluctuations in bodyweight of up to approximately 5 kg may occur with feed and water intake, defecation, urination, and hydration status (Webb & Weaver 1979). Therefore, it is important to weigh at the same time of day with respect to feeding and exercise, in order to minimize the influence of normal daily variability on measurements.
Indirect measurement
Given that scales are relatively expensive to purchase, they are often only used at larger institutions and are usually not available in a small farm setting. Therefore, calculations have been developed for estimating bodyweight based on measurements of body size. The simplest and most practical application of estimating bodyweight is the use of commercially available weight tapes, which estimates bodyweight from girth circumference. Weight tapes are easily used by placing the tape at the base of the withers and running it around the girth circumference just behind the elbow and forelimb (Fig. 22.1). The measurement is taken while the horse is standing square and at the time of exhalation, so that additional lung volume is not included in the calculation. The accuracy of this technique is decreased for horses at the extreme ends of the scale, and may not be applicable for certain classes of horses, including pregnant mares, growing foals, and thin, fit horses (Gee & Harris 2005). Although accuracy of weight tapes is increased when height-specific tapes are used (Ellis & Hollands 2002), more accurate methods of estimating bodyweight include calculations that contain variables of height or length (Ellis & Hollands 1998).
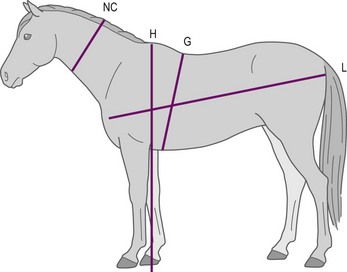
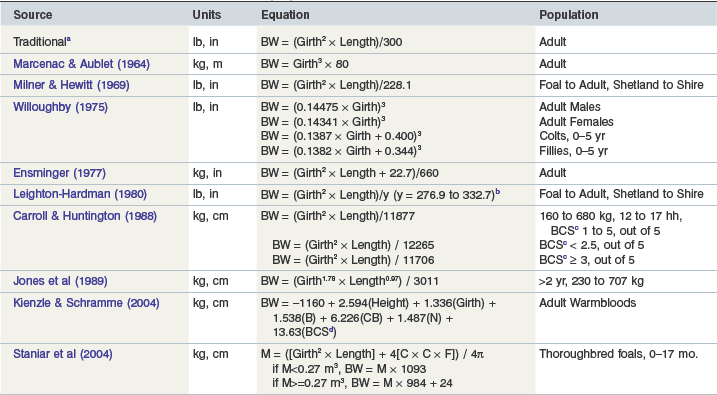
Many formulas have been described for estimating bodyweight in horses (Table 22-2). In order to improve accuracy, equations have been developed for specific types of horses, including Warmbloods (Kienzle & Schramme 2004) and Thoroughbred foals (Staniar et al 2004). When using weight formulas, it is important to make certain that measurements are taken according to the method from which the original equation was calculated. For example, girth circumference may be measured over the highest point of the withers (Carroll & Huntington 1988, Ensminger 1977), behind the slope of the withers (Fig. 22.1; Leighton-Hardman et al 1980, Milner & Hewitt 1969), one inch behind the highest point of the withers (Staniar et al 2004), or around the abdomen at the point of the umbilicus (Jones et al 1989). Additionally, some formulas use the body length from the point of buttock (tuber ischium) to the point of shoulder (head of humerus) (Fig. 22.1; Carroll & Huntington 1988, Leighton-Hardman et al 1980, Staniar et al 2004), while others use the length from the point of buttock to elbow (olecranon) (Ensminger 1977, Jones et al 1989), or from the point of shoulder to the point of hip (anterior part of trochanter major) (Milner & Hewitt 1969).
Table 22-2 Formulas for Estimating Bodyweight (BW) from Morphometric Body Measures in Horses
a As referenced in Milner & Hewitt (1969)
b y-value dependent on body condition and breed
c Body condition score, scale 0–5 according to Leighton-Hardman (1980)
d Body condition score, scale 1–9 according to Kienzle & Schramme (2004)
A widely used equation that has been evaluated in ponies and light breed horses (Reavell 1999) was developed by Carroll and Huntington (1988), and is applied as bodyweight = girth2 × length/y, where y = 11 877 for measurements in metric units (cm and kg) or y = 330 for measurements in imperial units (in and lb). For larger horses, the equation of Jones et al (1989) was determined to be most accurate (Reavell 1999), although is awkward to use because of nonunity exponents: bodyweight (kg) = [umbilical girth (cm)1.78 × length (cm)1.05]/3011.
Methods of assessing body condition
The objective of assessing body condition involves the estimation of body composition, or more specifically the differentiation between, and relative quantification of, fat (adipose tissue) mass and fat-free (lean) mass (e.g., bone and muscle). In humans, the “gold standard” for body composition assessment is hydrostatic weighing. This technique is based on Archimedes’ principle and requires the subject to exhale completely and remain submerged underwater for ~10 seconds (Jensen 1992), which cannot be applied to horses for obvious technical reasons. Other accurate methods of body composition assessment used in humans and small animals include computed tomography and dual energy X-ray absorptiometry (DEXA). Due to size restrictions, these methods have not been applied in horses.
Dissection and carcass analysis have been used for validation of methods, such as estimation of body fat percentage from ultrasonic fat depth in horses (Westervelt et al 1976, Kane et al 1987), but their clinical usefulness is limited given that these techniques are not appropriate for live animals. Further, the estimation of body fat content from ultrasonic fat depths appears to be dependent upon the exact anatomical location of scanning and may also be dependent upon several factors including age, breed, sex, physiological status, previous nutritional history and season (Dugdale et al 2010). In reality, the more accurate methods of assessing adiposity are often substituted by less accurate, more practical methods.
Assessment of body condition score (BCS)
Several BCS scales have been developed specifically for use in horses. The 0–5-point scale was first described by Leighton-Hardman (1980) and later adapted by Carroll and Huntington (1988). This BCS system assesses subcutaneous fat deposition in 3 body areas (neck, back and ribs, and pelvis) on a scale of 0 (very poor) to 5 (very fat). Each area is scored separately, then the pelvis score is adjusted by 0.5 point if it differs by 1 or more points from the back or neck scores to obtain the overall BCS.
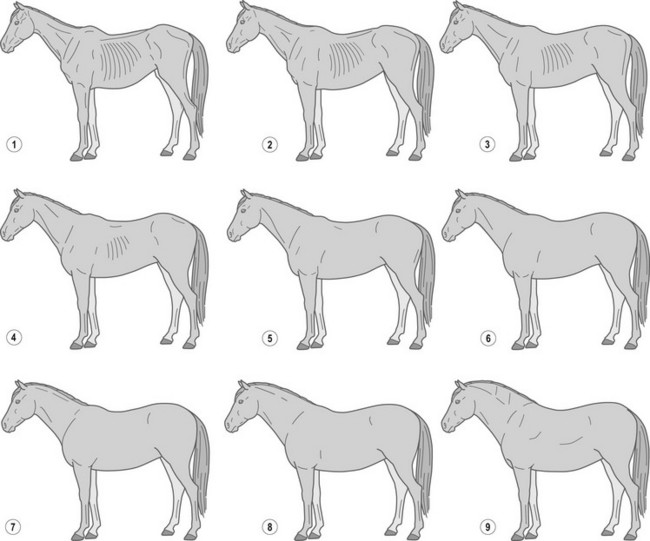
A widely used BCS system, developed by Henneke et al (1983), has a broader range of numerical increments and encompasses more bodily areas for evaluation. This system involves scoring six areas of the horse’s body (neck, withers, back, tailhead, ribs, and behind the shoulder) (Fig. 22.2) to categorize body condition on a scale from 1 (poor) to 9 (extremely fat) (Table 22-3, Fig. 22.3). Each body area is scored separately, and then scores are averaged to obtain the overall body condition score. The Henneke BCS system, originally developed for use in Quarter Horse broodmares, may be most appropriate for use in mature light breed horses (e.g., Quarter horses, Thoroughbreds and Arabians) that share similar body type and patterns of fat deposition. Application of the BCS system to Thoroughbred geldings has been described (Suagee et al 2008), and alterations in the BCS system have been developed to increase its suitability for Warmblood breeds (Kienzle & Schramme 2004). However, the application of the Henneke BCS system to classes of equidae with unique conformation or fat deposition patterns, such as ponies, draft breeds, or young horses needs to be performed and interpreted with caution.
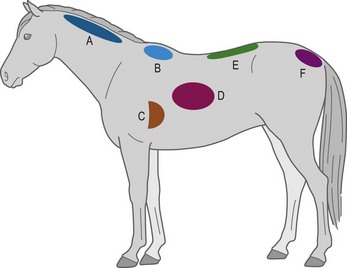
Figure 22.2 Location of subcutaneous adipose depots over the six bodily areas assessed by body condition scoring, according to Henneke et al (1983).
A, neck; B, withers; C, behind the shoulder; D, ribs; E, topline; F, tailhead.
Table 22-3 Description of Individual Body Condition Scores
| Score | Condition | Description |
|---|---|---|
| 1 | Poor | Animal is extremely emaciated. Spinous processes (part of vertebrae that projects upward), ribs, tailhead, hooks (tuber coxae; hip joints), and pins (tuber ischii; lower pelvic bones) projecting prominently. Bone structure of withers, shoulders, and neck easily noticeable. No fatty tissue can be felt. |
| 2 | Very thin | Animal is emaciated. Slight fat covering over base of the spinous processes, transverse processes (portion of vertebrae that projects outward) of lumbar (loin area) vertebrae feel rounded. Spinous processes, ribs, tailhead, hooks, and pins are prominent. Withers, shoulders, and neck structures are faintly discernible. |
| 3 | Thin | Fat is built up about halfway on spinous processes, transverse processes cannot be felt. Slight fat cover over ribs. Spinous processes and ribs are easily discernible. Tailhead is prominent, but individual vertebrae cannot be visually identified. Hook bones appear rounded, but are easily discernible. Pin bones are not distinguishable. Withers, shoulders and neck are accentuated. |
| 4 | Moderately thin | Negative crease along back (spinous processes of vertebrae protrude slightly above surrounding tissue). Faint outline of ribs is discernible. Fat can be felt around tailhead (prominence depends on conformation). Hook bones are not discernible. Withers, shoulders and neck are not obviously thin. |
| 5 | Moderate | Back is level. Ribs cannot be visually distinguished, but can be easily felt. Fat around tailhead begins to feel spongy. Withers appear rounded over spinous processes. Shoulders and neck blend smoothly into body. |
| 6 | Moderately fleshy | May have slight crease down back. Fat over ribs feels spongy. Fat around tailhead feels soft. Fat begins to be deposited along the sides of the withers, behind shoulders and along neck. |
| 7 | Fleshy | May have crease down back. Individual ribs can be felt, but with noticeable filling of fat between ribs. Fat around tailhead is soft. Fat is deposited along withers, behind shoulders and along neck. |
| 8 | Fat | Crease down back. Difficult to feel ribs. Fat around tailhead is very soft. Area along withers is filled with fat. Area behind shoulder is filled with fat and flush with rest of the body. Noticeable thickening of neck. Fat is deposited along inner thighs. |
| 9 | Extremely fat | Obvious crease down back. Patchy fat appears over ribs. Bulging fat around tailhead, along withers, behind shoulders and along neck. Fat along inner thighs may rub together. Flank is filled with fat and flush with rest of the body. |
Adapted from Henneke et al (1983).
Regardless, Kohnke’s modification (1992) of the Henneke BCS system has been applied to pony breeds in research studies and clinical situations (Freestone et al 1992, Treiber et al 2006, Carter et al 2009c, Dugdale et al 2010). However, it is unknown whether the relationship between BCS and actual adiposity is similar between horses and ponies. Recent work on pony cadavers has shown an exponential association between BCS, as assessed using the Henneke or Carroll and Huntingdon systems, and body fat content (Dugdale et al 2011a). There was, however, a linear association between BCS (both systems) and overall “flesh” (total somatic soft tissues) content (Dugdale et al 2011a). This work supported the exponential relationship described between BCS (INRA system of 0 to 5) and body fat content in 20 French Sport horses (Martin-Rosset et al 2008). Once bony landmarks become obscured by superficial adipose tissue, adequate descriptors to differentiate “obese” from “super-obese” animals are lacking.
Morphometric measurements
Bodyweight alone is uninformative for assessing relative adiposity or body condition, unless it is put into context by relating it to the size of the animal. For example, a 400 kg, 13 hh pony would have a drastically different body condition than a 400 kg, 16 hh horse. Body mass index (BMI) aims to adjust bodyweight for body size by dividing the weight of an individual by a measurement of body size. In humans, BMI is calculated as bodyweight/height2. This index has been applied to horses with moderate correlations (rs = 0.35 to 0.60) between BMI and BCS (Carter et al 2009a, Donaldson et al 2004). In other animals including cats, a BMI has been applied where body length is integrated into the adjustment for body size, calculated as bodyweight/(height × body length) (Hoenig & Ferguson 2002). When this BMI was applied to horses, it similarly correlates with BCS (rs = 0.37 to 0.50). Additionally, a simple bodyweight to height ratio has been demonstrated to be correlated to BCS (r2 = 0.58) and body fat percentage (calculated from rump fat thickness, see below) (r2 = 0.43) (Henneke et al 1983). However, all of the above correlations are relatively weak, suggesting that one-off measures will not necessarily be accurate and precise predictors of actual body fat content.
Additional morphometric measurements that are useful for assessing relative body condition include the use of a body circumference in relation to body size. This assumes that an increase in circumference is mainly caused by an increase in fat mass. To support this assumption, a ratio of girth circumference to withers height was correlated to BCS (r2 = 0.51) and body fat percentage (r2 = 0.44) in Quarter horses (Henneke et al 1983). When girth and abdominal circumferences were adjusted by withers height, body length, or bodyweight, it was found that the girth to withers height ratio was the strongest predictor of BCS in horses and ponies (rs = 0.64 and 0.83, respectively), with a greater predictability than both calculations of BMI (Carter et al 2009a
Stay updated, free articles. Join our Telegram channel

Full access? Get Clinical Tree


