Chapter 9 Echocardiography
INTRODUCTION
Echocardiography, including two-dimensional (2DE), M-mode and various Doppler modalities, have revolutionized equine cardiology. These technologies provide a better understanding of the normal physiology of the equine heart and an improved ability to diagnose and assess the severity of many forms of heart disease.1 A clear understanding of the principles of echocardiography, the technical ability to produce standard and consistent images and knowledge of common echocardiographic findings in normal and diseased animals are essential for the successful clinical use of echocardiography.
PHYSICS AND PRINCIPLES
Two-dimensional and M-mode echocardiography( ET)
ET)
2D echocardiograms are obtained by sweeping an ultrasound beam in an arc to produce sector frames that are updated with time (Figs. 9.1–9.7). While these images provide the best spatial information, they are limited by frame rate. M-mode echocardiograms show the structure of the heart in a one-dimensional view where location is displayed on the y-axis against time on the x-axis. Thus, the M-mode image shows motion of the cardiac structures and is not limited by frame rate. Most modern echocardiographic units allow the M-mode image planes to be guided from 2DE images.
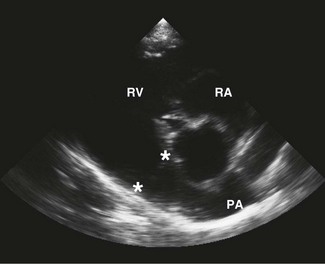
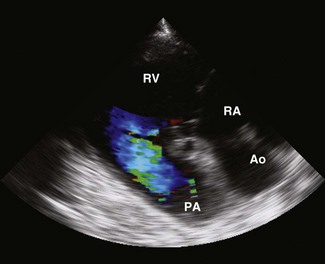
 ) and pulmonary artery (PA,
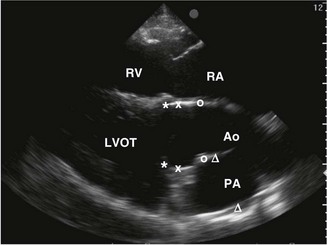
  ) are shown. RA, right atrium; RV, right ventricle; LVOT, left ventricular outflow tract.
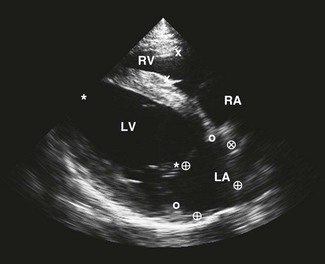
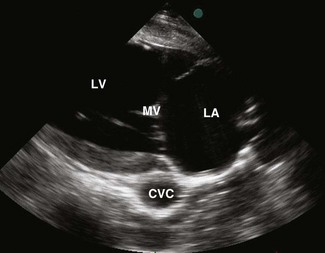
 ), left atrial (LA) length (
 ) and diameter (
 ) are shown. Note that subjectively the right atrium (RA) is smaller than the left atrium (LA) in this image plane.
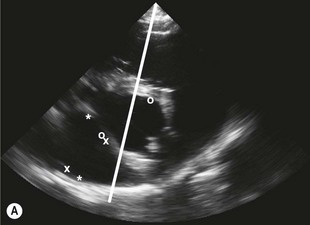
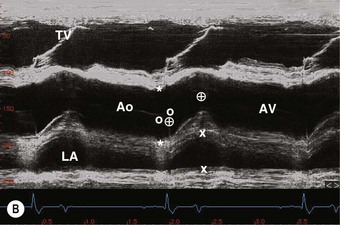
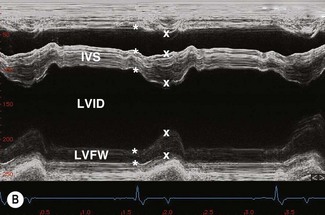
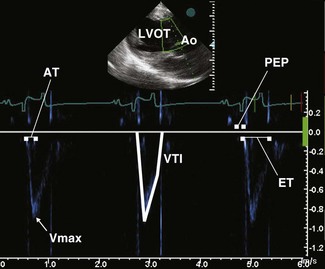
 ) are shown. The line indicates the cursor position to obtain an M-mode echocardiogram of the aorta. RA, right atrium; RV, right ventricle; Ao, aorta; LA, left atrium; PA, pulmonary artery. (B) An M-mode echocardiogram of the aorta obtained as indicated in A. The aortic valve (AV) has a box-like shape in systole. Landmarks to measure the Ao (*), LA (x), pre-ejection period (
 ) (the time from the Q wave to valve opening) and ejection period (the duration of valve opening,
  ) are shown. RV, right ventricle; TV, tricuspid valve.
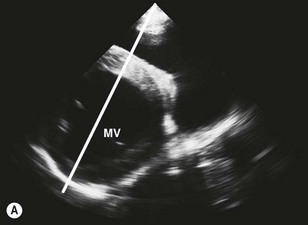
Doppler echocardiography( ET)
ET)
Doppler echocardiography is a noninvasive means of interrogating intracardiac blood flow, or in the case of tissue velocity imaging (TVI, also known as Doppler tissue imaging), movement of cardiac structures. It is based on the Doppler principle: the frequency shift that occurs when sound of a known frequency is reflected by a moving structure. In echocardiography the moving structure can be the blood cells or, with TVI, various cardiac structures such as the chamber walls or valves. When an ultrasound beam of any given frequency is directed into the heart, it is reflected at a different frequency determined by the velocity and direction of the moving blood cells or cardiac structures. Objects that are moving towards the interrogating ultrasound beam produce an increase in frequency of reflected sound (a positive Doppler frequency shift), whereas those moving away from the interrogating sound beam produce a decrease in frequency (a negative Doppler frequency shift). Quantification of the frequency shift allows the velocity of that movement to be calculated from the following equations2:

The Doppler shift (fd) is the difference between the received frequency (fr) and the transmitted frequency (ft). The velocity of the interrogated structure (v) is a function of fd, ft, the speed of sound in tissues (c) and the angle of interrogation (θ). Note: as θ increases the velocity estimate will become increasingly inaccurate; thus optimal data is obtained by aligning the interrogating ultrasound beam parallel to the blood flow under examination. ( RCT) Most echocardiographic units provide good-quality Doppler signals at depths of no more than 18–24 cm, which can present difficulties in the horse. Unfortunately, in horses the acoustic windows are limited and optimum alignment to flow can be difficult to achieve.3,4 Transoesophageal (TO) transducers can be placed directly over the heart to overcome some of these limitations.5 However, although there are clear clinical advantages in a range of clinical settings in human patients, TO echocardiographic equipment has to be custom-built for equine patients, it is expensive and it has only been used in anaesthetized horses, such that at the current time, its use has been restricted to research applications in horses.6–15
The simplest form of Doppler echocardiography is continuous wave (CW), a system where a continuous interrogating ultrasound beam is emitted from a piezoelectric crystal and a separate piezoelectric crystal receives the reflected sound. CW Doppler echocardiograms represent the velocity of blood cells moving in either direction along the entire path of the ultrasound beam displayed against time as a form of spectral display. CW is the most accurate in the detection of velocity as there is no limitation of aliasing; however, it provides limited spatial information2,16 (Fig. 9.8). CW signals are more intense than those from PW (see below).
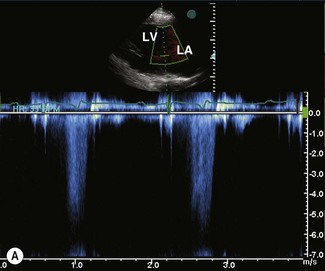
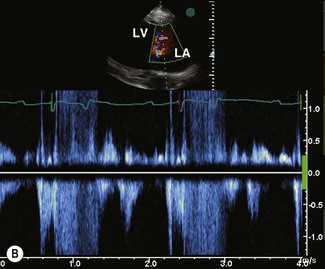
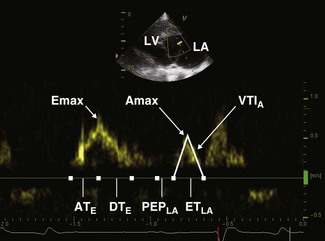
Pulsed-wave (PW) Doppler echocardiography overcomes the spatial limitations of CW by collecting Doppler data from an individual sampling site by emitting sound in pulses and measuring the frequency shift that occurs at an operator-determined location within the heart. PW is able to distinguish laminar flow, where all blood cells at one location are travelling at the same velocity, from turbulent flow, where multiple velocities will be detected at the same location. Turbulent flow is recognized on spectral PW because there is spectral broadening, i.e. a variety of velocities are depicted as a broad band rather than a tight envelope17,18 (see Fig. 9.8).
When PW information is generated from a single sampling site and displayed as a graph of velocity against time, this is also a form of spectral display. Flow towards the transducer is displayed above the baseline of the time/velocity spectrum and flow away from the transducer is below the baseline. PW is used in conjunction with 2DE such that the operator can select a particular location within the heart for investigation. All forms of PW Doppler echocardiography are limited by the fact that they cannot accurately define high velocities. This is due to a phenomenon known as aliasing. In spectral PW, aliasing is represented by displaying the signal on the opposite side of the base line (i.e. forward flow is displayed at increasing velocities above the baseline until it exceeds the aliasing point and is represented below the baseline; see Fig. 9.8). The velocity at which aliasing occurs is determined by the Nyquist limit, which is dependent on the frequency of emission of the ultrasound pulses (the pulse repetition frequency) and the frequency of the emitted sound. Many echocardiographic units are equipped with a high pulse repetition frequency function that is effectively an intermediate between PW and CW, allowing higher velocities to be recorded accurately with some ability to localize the sampling site.2,16
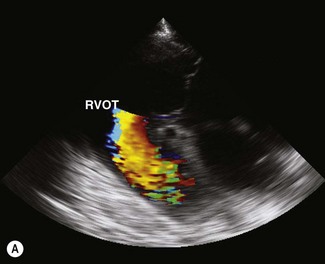
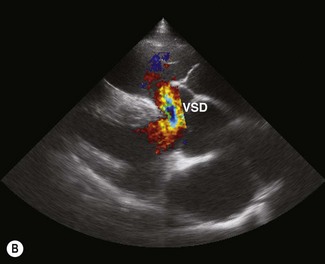
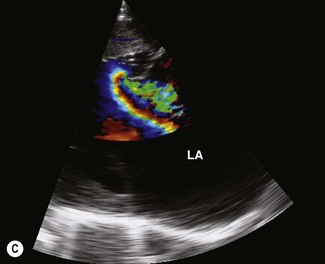
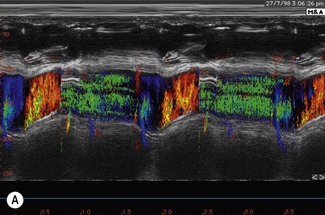
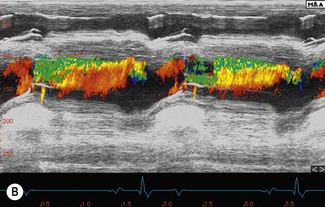
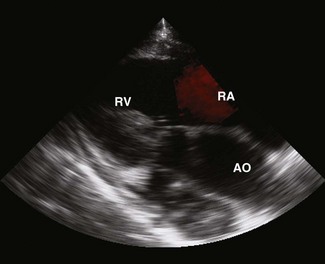
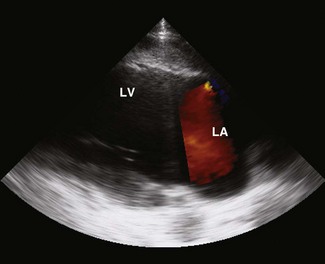
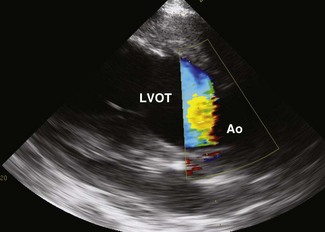
Colour flow Doppler (CFD) echocardiography is a more sophisticated form of PW Doppler technology. Instead of a single sampling site, multiple sites within the heart are examined simultaneously. Flow is colour coded and superimposed on a two-dimensional image of the cardiac structures to produce a map of intracardiac flow (Fig. 9.9). Colour M-mode images provide the most accurate assessment of timing of flow events (Fig. 9.10). In all forms of CFD it is conventional to display flow towards the transducer encoded as red and flow away from the transducer encoded as blue. The intensity or shade of the colour varies to depict the velocity of blood flow. High-velocity turbulent jets appear as a mosaic pattern of high-intensity colour17,18 (see Fig. 9.9). Some echocardiographic units add another colour, such as green, to display variance or turbulent flow (see Figs. 9.9 and 9.10). Where aliaising occurs, increasing velocities are indicated by moving through the colour sequence, thus rapid flow towards the transducer aliases from red, through orange and yellow to the blue shades, while rapid flow away from the transducer aliases from blue through turquoise and yellow to the red shades (see Fig. 9.9). In common with other ultrasonographic imaging modalities, CFD echocardiograms are updated many times per second to achieve a continuous, real-time image.2,16–18 However, at the depths required in equine echocardiography, the addition of CFD can result in very slow frame rates. This limiting factor is highly machine dependent. ( AR, RCT, VMD, VSD)
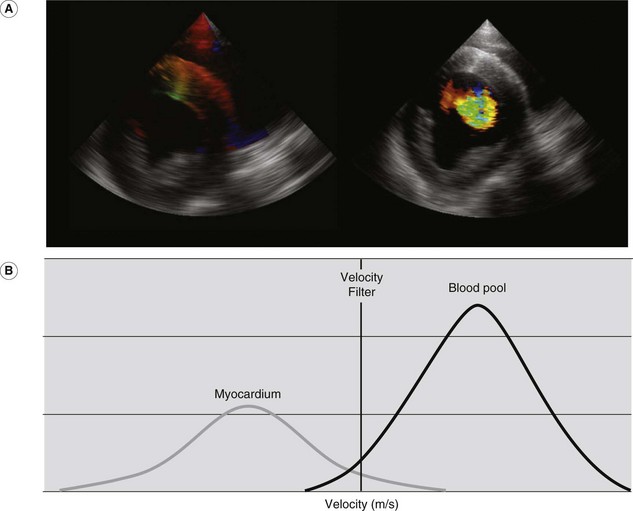
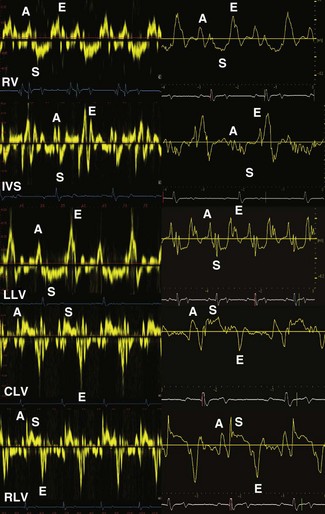
For conventional blood pool Doppler echocardiography, velocity filters are utilized to screen out low-velocity and high-amplitude signals that are likely to be due to the solid structures of the heart. In contrast, for TVI, velocity and amplitude filters are reversed and used to screen out high-velocity, low-amplitude signals that are likely to arise from the blood pool19,20 (Fig. 9.11). Two TVI functions are available, each measuring different velocities: spectral TVI (Fig. 9.12) provides an estimate of the maximal velocity within a given region whereas colour TVI produces a trace of the mean velocity within the sampled region of myocardium.21 TVI methods allow the velocity of individual areas of the myocardium to be determined.22 These modalities provide a direct measure of intramural velocities during cardiac relaxation and contraction and have the potential to objectively quantify regional, in addition to global, mechanical function.21,23
ECHOCARDIOGRAPHIC EQUIPMENT
Imaging the heart requires a sector scanning transducer and in adult horses a 2.0–3.5-MHz transducer is ideal; in foals 5.0–7.0 MHz may be more suitable. The relatively poor resolution of low-frequency transducers is more than compensated by their increased depth of penetration. The advent of harmonic imaging, with superior signal-to-noise, contrast-to-noise, spatial resolution and visualization of tissue at depth2,24 may often improve the quality of images that can be obtained in large and overweight adult horses. A depth display of at least 30 cm facilitates imaging of the entire heart from the right side of the chest and equipment is now available that can image to depths of up to 36 cm. To be suitable for echocardiography, ultrasound machines should be equipped with an ECG display. A cine-loop facility, which allows previous frames to be analysed at the time of the examination, is also extremely useful and is included in most modern echocardiographic units.
THE ECHOCARDIOGRAPHIC EXAMINATION
Indications for echocardiography
Echocardiography is indicated in the following situations:
• When a murmur (other than a functional murmur) is heard (i.e. valvular or congenital heart disease is suspected).
• When dysrhythmias are detected.
• When heart sounds are muffled (e.g. due to pericardial or severe myocardial disease).
• When clinical signs of congestive heart failure are detected.
• In horses with pyrexia of unknown origin.
• In horses with unexplained reduced athletic performance once musculoskeletal and respiratory disease has been excluded.
Preparation of patient
Echocardiography is best performed in areas of subdued lighting and where the horse can be safely restrained. Hair should be clipped from the axilla, except in horses with a very fine hair coat. The skin should be cleaned of grease and dirt using surgical spirit or soap and water and acoustic coupling gel applied. Horses should not be sedated unless absolutely necessary because this will alter some cardiac dimensions and indices of function. If sedation is required to clip the horse it may be necessary to clip the horse under sedation and scan at least several hours later. Detomidine and romifidine primarily affect 2DE and M-mode measurements of the left ventricle (LV) and aorta (AO) in systole, reducing wall thickness and increasing the diameter of the ventricular lumen and aortic root.25–27 One study has shown that detomidine can also increase the LV diameter in diastole.21 Detomidine will also affect Doppler echocardiographic indices of systolic function.26 Acepromazine appears to have less effect on echocardiographic variables27,28 but has been shown to increase the diameters of the pulmonary artery (PA), AO and interventricular septum (IVS) and decrease the diameter of the left atrium (LA) in diastole.27,28 If a horse has to be examined while sedated then structural information is still valid but the potential effects of sedation on the echocardiographic measurements should be taken into account.
Image planes( ET)
ET)
In order to perform a thorough echocardiographic examination, standardized image planes should be obtained in a methodical manner before lesion-orientated views are studied. These image planes and the transducer positions used to obtain them have been described previously29–31 and standardized views of 2D and M-mode image planes obtained from normal horses are shown in Figures 9.1–9.7 and cardiac anatomy is reviewed in Chapter 1. In brief, the right parasternal images are obtained by placing the transducer in the right fourth intercostal space (in most horses just under the triceps muscle), which is often facilitated by having the horse stand with its right fore in front of its left. The transducer should be tilted 5–10° from the vertical plane such that the ultrasound beam runs from a 1–2 o’clock position dorsally to a 7–8 o’clock position ventrally in long axis and from a 3–4 o’clock position cranially to a 9–10 o’clock position caudally in short axis. In short-axis images at the heart base, a slight further clockwise rotation will often help produce clearer images of the aortic valve. In this way, the ultrasound beam will traverse the heart along its true long and short axes. Ideally, the images should be obtained in a consistent manner, for example, starting by orientating the transducer towards the left shoulder to view the right atrium (RA), ventricle (RV) and PA, sweeping caudally to the four-chamber view, then scanning the heart in short axis from the apex to the heart base and finally obtaining an M-mode series from the base to the apex. Left parasternal images are made with the horse standing square and the transducer located in the fifth intercostal space (in most horses just behind the border of the triceps muscle), orientated vertically or slightly rotated 5–10° in a clockwise direction to around 1 o’clock directed straight across the horse, or slightly caudally to image the LA and LV and then sweeping cranially while rotating the transducer in an anticlockwise direction to around 10–11 o’clock to visualize the left ventricular outflow tract (LVOT, Figs. 9.1–9.7). Standard images for Doppler imaging correspond to those used for 2DE29–33 (Figs. 9.13–9.18). However, for imaging regurgitant jets, images must be selected so that the ultrasound beam can be aligned as closely as possible parallel to blood flow, and it is often necessary to supplement the standard images with lesion-orientated images optimized to align with regurgitant jets or intracardiac shunts.34–38
M-mode, 2DE and TVI assessment of cardiac dimensions and indices of cardiac function
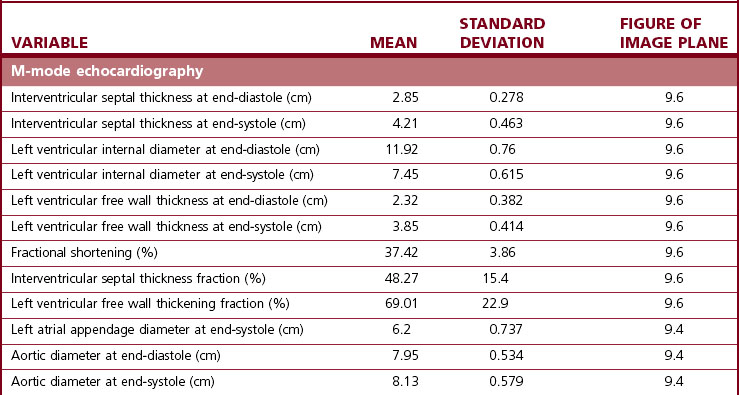
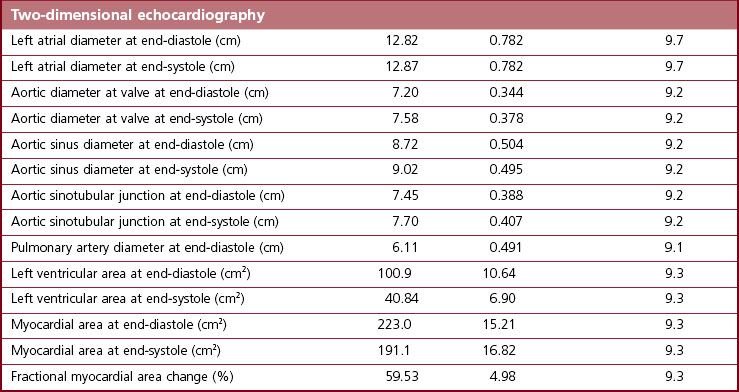
One of the principal advantages of echocardiography is that it allows measurement of the size of cardiac structures and, with M-mode echocardiography, accurate timing of their motion. When these measurements are combined, valuable functional data can be obtained. Guidelines for measurements are available to ensure repeatability.31,39,40 Strict adherence to these guidelines is mandatory if accurate measurements are to be made. It is extremely important that only perfect images are used for measurements. Measurements made from poor-quality images, and especially from images in the wrong anatomical plane, can be extremely misleading. Between three and five sets of measurements from different cardiac cycles should be made, with more if there is a dysrhythmia. Echocardiographic variables vary not only depending on the age and body weight of the horse but also between breeds and between different levels of fitness41–48 (see Chapter 3). A range of measurements for adult Thoroughbred horses is presented in Table 9.139 and adult Standardbred horses in Table 9.2,49 while a more limited range of measurements for mixed breed horses and ponies of a variety of sizes is listed in Table 9.3.50 Regression equations allowing prediction of cardiac sizes in Thoroughbred foals ranging from birth to 16 weeks of age are listed in Table 9.4.
< div class='tao-gold-member'>
Stay updated, free articles. Join our Telegram channel

Full access? Get Clinical Tree


