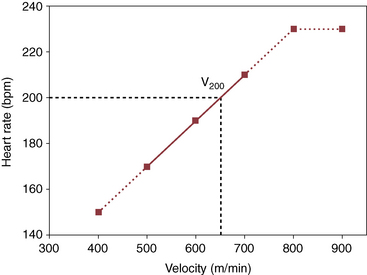
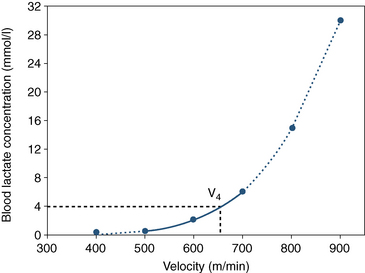
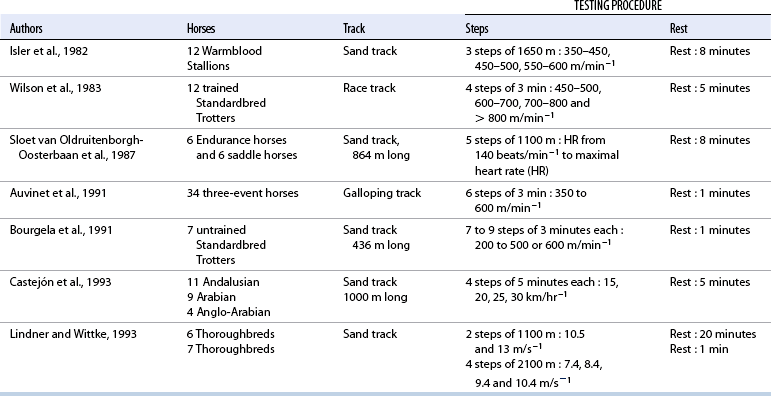
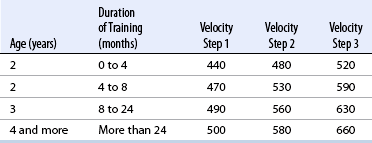
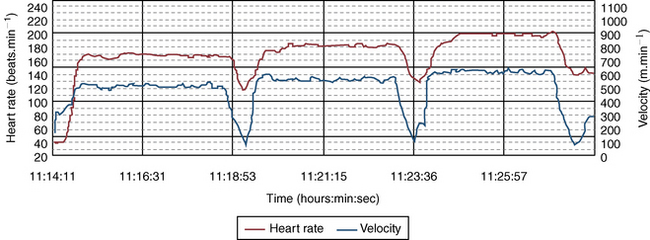
Chapter 29 Exercise testing provides a mechanism for evaluating a range of body systems under standard exercise conditions. Measurements of cardiorespiratory and metabolic functions during an exercise test provide information about the capacity and efficiency of key body systems involved in energy production. Thus, some conclusions may be drawn about the athletic potential, or lack thereof, of the horse based on measurements of oxygen transport or estimates of anaerobic capacity, depending on the duration and intensity of the competitive event. Additionally, changes in levels of fitness may be evaluated by using exercise testing because resting measurements of hematology or biochemistry provide little or no indication of improvements in fitness. Exercise testing is probably of most use from a clinical point of view to assess the effect on performance of abnormalities found on physical examination or to determine the reason(s) for reduced athletic capacity in horses that have no abnormalities on resting examinations. Whatever the reason for the testing, one important premise is that standardized procedures are followed so that the data derived from each test can be compared against subsequent tests for the same horse or with measurements from other horses of similar age and fitness level. One of the key issues in track exercise testing is the measurement of speed. For ridden horses, linear and temporal markers need to be located on the track for the rider to regulate the velocity and cadence of the horse. Velocity is then measured with a stopwatch. Also, velocity may be measured by the use of a GPS carried by the rider. In driven horses such as Standardbred Trotters or Pacers, velocity may be measured by using a tachometer placed on the wheel of the sulky connected to the meter or the GPS. HR response to exercise is an important indication of metabolic capacity. It may be easily measured and registered by means of two electrodes placed on the horse and connected to a heart rate monitor. HR response to graded exercise is linear, between 120 and 210 beats per minute (beats/min−1), as shown in Figure 29-1. Many factors such as exogenous factors (e.g., geometry and length of the track, environmental conditions), stage of training, and disease may influence the regression line of HR on work speed. However, the regression of HR on speed is very precise and reproducible when measured during a standardized exercise bout. Blood lactate concentration may be measured by taking blood samples at the end of the exercise period, from the jugular vein into tubes containing fluoride-oxalate. Lactate is a product of muscular metabolism and accumulates in muscle and blood at high intensities of exercise. The concept of anaerobic threshold, extrapolated from plotted curve of blood lactate concentration against speed has been defined as the level of work just below that at which metabolic acidosis occurs. The aerobic–anaerobic transition or onset of blood lactate accumulation (OBLA) has been defined empirically as 4 millimoles per liter (mmol/L−1) blood lactate concentration. At this level of activity, the initial increase in lactate production is followed by a steady state in which lactate utilization and lactate production are equal. At higher levels of activity, lactate production exceeds its utilization, and so it accumulates in blood (Figure 29-2). Numerous and varied testing procedures (Table 29-1) have been described for horses involved in different disciplines such as 3-day eventing, endurance, show jumping or racing (flat and Standardbred). Whatever the horse’s discipline, field exercise test protocols should always be rigidly defined to calculate meaningful fitness measurements and to limit variability. Following standardized procedures is of great importance as the data derived from each test can be compared with those from subsequent tests for the same horse or with measurements from other horses of similar age and training status. Results may vary according to the methodology used and with factors such as number and duration of steps, resting time between steps, and increment from one step to the next. • Velocity should be controlled and maintained as constant as possible during the exercise test. This is a requisite of the rider or driver and may be difficult to achieve. Regardless, the aim is to maintain a constant speed during each step of the test. • The duration of each step should be sufficient to provide a steady-state heart rate and blood lactate response. Generally 3 to 5 minutes are necessary for humans to reach a steady-state blood lactate concentration. In contrast, shorter steps may be possible in the horse. • Because an efflux of lactate from muscle to blood occurs following exercise, consistent periods between each step is essential. • The responses of HR and blood lactate concentration to speed are dependent on the age and training level of the horse. Various protocols have been described for Trotters. However, the example described here is a test of three steps each of 3 minutes, with a 1-minute rest between steps one and two. Depending on the age of the horse, the velocity of step 1 varies from 440 to 500 meters per minute (m/min−1) with the lowest speeds used for the two-year olds. The increment within each step varies from 40 to 80 m/min−1 (Table 29-2). The aim of the highest speed increment is to induce a blood lactate concentration greater than 4 mmol/L−1. From the measured variables HR, V (speed, or velocity), and blood lactate concentration, derived variables may be calculated to permit simple comparison of test results. Examples are described below. For comparison of blood lactate values between horses or in the same horse during training, the velocity at a blood lactate concentration of 4 mmol/L−1 (V4) generally has been used. V4 is considered a reference value for horses, as it is considered by many to be a good predictor of aerobic capacity. A high value for V4 (see Figure 29-2) is an indication of superior exercise capacity and is related to racing performance. In the 1990s, Evans et al. (2007) studied the relationship between the blood lactate response to exercise and performance in Thoroughbreds during a submaximal exercise test on a 5% inclined treadmill. These authors showed that the blood lactate concentration 2 to 5 minutes after exercise was correlated to racing performances as assessed by Timeform rating (r = −0.68 ; p<0.01). In another study undertaken in Sweden, it was shown that in a small group of Trotters, those first two to begin their racing careers were the ones that had the lowest lactate concentration after submaximal tests. In another study, Casini and Greppi (1996), studying 20 Trotters completing a field exercise test were able to compare 10 good performers and 10 poor performers, on the basis of best time. These authors found significantly higher V4 values in the first group and a negative correlation between V4 values and best time (0.61). Couroucé et al. (1997) also showed that 96% of horses with low V4 values according to their age were poor racing performers. Finally, Davie et al. (2002) studied the relationships between V4 values and earnings in a population of 16 pacers. A significant correlation was found between V4 values and log earnings and log earnings or start. Overall, the higher the V4, the fitter is the horse and the greater is its exercise capacity. A useful reference point for comparison of cardiovascular capacity in Standardbred horses, is the V200 (see Figure 29-1), which represents the velocity at an HR of 200 beats/min−1. According to many, even though individual variations may be found, at an HR of 200 beats/min−1, most Standardbreds are close to the point of onset of blood lactate accumulation (OBLA, blood lactate concentration of 4 mmol/L−1). A retrospective study carried out with 194 French Trotters that performed 1105 field standardized exercise tests on a sand training track, permitted calculation of V4 and V200 mean values (± standard deviation [SD]) according to age groups (Table 29-3). It was also shown that in most cases, the workload carried out at V200 is close to V4. For 1-, 3-, 4-, and 5 year-olds, no significant difference was seen between mean V4 and V200 values. In contrast, for 2- and 6-year-olds, a significant difference was seen between mean V4 and V200 values, V200 being lower for 2-year-olds and higher for 8-year-olds and those older. TABLE 29–3 V4, V200, and track testing: The track is an important variable to consider, as it may influence the calculation of V4 and V200. In a previous study, five French Trotters performed standardized exercise tests at two different tracks (a 1250-m sand race track and a 720-m sand training track) and on an uninclined treadmill during the same week to determine the influence of exercise surface on different measured variables such as V4 and V200 (Couroucé et al., 1999). No significant differences were found for the physiologic variables between the two tracks. In contrast, significant differences for these variables were observed between those occurring on the two tracks versus the those on testing on the treadmill, with horses showing lower HR and blood lactate responses on an uninclined treadmill (Table 29-4). TABLE 29–4
Clinical exercise testing
Indications for exercise testing
Track exercise testing
Overview of testing procedures
Standardized track-based exercise test for standardbred trotters
Testing procedure
Calculation of indices of exercise capacity
Velocity and blood lactate concentration
Velocity and heart rate
Age (years)
V4
V200
1
512a (± 21)
498a (± 39)
2
551a (± 29)
539b (± 40)
3
590a (± 41)
586a (± 37)
4
611a (± 26)
614a (± 34)
5
616a (± 26)
617a (± 31)
6 and more
626a (± 30)
641b (± 35)
Reproducibility
Interpretation of v4 and v200

![]()
Stay updated, free articles. Join our Telegram channel

Full access? Get Clinical Tree


Clinical exercise testing
Only gold members can continue reading. Log In or Register to continue

