Henry Stämpfli, Consulting Editor Olimpo Oliver-Espinosa * Laboratory data are discussed here in relation to case management. The focus is on interpretation of an abnormal finding in the typical clinical situation. An in-depth pathophysiologic explanation of these alterations is beyond the scope of this section. Should additional information be required, a textbook on veterinary clinical pathology should be consulted.1,2 All samples should be submitted with specific objectives in mind. In general, these objectives fall into one of the following categories: • Evaluating organ system involvement or functional impairment • Confirming a diagnosis or ruling out a disease condition • Directing therapy formulation • Assessing response to therapy The clinician must be aware of inherent limitations of laboratory evaluation in certain clinical settings. In general, veterinary diagnostic laboratories are preferred to general medical laboratories because human medical laboratories may be less familiar with animal diseases and the responses of animals to disease. There may also be differences in test methodology and interpretation. These species differences can cause confusion when results are evaluated on the basis of human criteria that may not apply to animals. Various desktop or portable handheld point-of-care devices are available to veterinarians for determination of serum chemistry, electrolytes, and acid-base balance. Many of these devices use self-contained strips, cartridges, or rotors and thus reduce errors associated with the maintaining, measuring, and mixing of reagents. In addition, some of these devices can use whole blood rather than serum or plasma. Some devices require refrigerated storage of reagent cartridges, which must then be warmed to room temperature for use. There are relatively few independently published data comparing the results obtained with these point-of-care devices and those obtained with standard laboratory procedures. A widely used handheld device (iSTAT) has been shown to yield comparable results for blood electrolyte concentrations and acid-base balance in dogs and horses.3 However, it was noted that the correlation between results from this device and from standard laboratory techniques was poor for sodium in the dog and for hematocrit in the horse. A study using the same handheld device in cattle, horse, and sheep showed that except for sodium concentration and hematocrit in horses and sheep, correlation was good or excellent for most variables reported.4 Portable point-of-care devices can provide rapid, accurate, and relatively inexpensive results. As technology continues to improve, wider and more general application of these devices in many large animal practice settings can be anticipated. Important requirements are the establishment of normal values with these devices for our large animal species of important age or production groupings as well as clear definition of the limitations and possible idiosyncratic reactions in certain species or clinical settings. Selection of specific laboratory tests fosters logically integrated thinking and concentrates on evaluation of the primary medical problems. However, the sophisticated autoanalyzers used by large commercial laboratories can perform a wide battery of tests quickly and efficiently with little additional cost. These panels may be broadly defined (e.g., a general large animal health panel) or may offer a more focused evaluation of a specific organ system (e.g., liver, kidney, or muscle). The clinician must ensure that the panel selected contains all the appropriate tests for a thorough evaluation of the individual patient’s medical problems. The following recommendations for diagnostic panels are intended to provide a clear indication of organ damage and/or dysfunction. The most directly applicable diagnostic procedures are listed under “Recommended,” and additional procedures that may be of benefit in certain circumstances are listed under “Optional.” The broadly based general chemistry panel should provide a balanced evaluation of the most likely medical problems. The muscle panel should detect active skeletal and cardiac muscle injury (rhabdomyolysis) and the degree of secondary renal damage. The possible causative factors are evaluated as optional procedures, depending on the history, clinical findings, or special circumstances. Muscle biopsy with special staining may be critical to the diagnosis of specific muscle diseases such as polysaccharide storage myopathy, immune mediated myopathy, and mitochondria myopathy. Special tests for muscle function and the genetic basis for some myopathies are discussed in the chapters on muscles and genetic tests (see Chapters 42 and 52). The liver panel should detect active damage to the hepatic parenchyma, involvement of the biliary system, and alteration in hepatic function. The kidney panel should provide a rough quantitative estimation of compromised renal function and should indicate the location and nature of the damage to the urinary tract. The gastrointestinal disease panel should include evaluation of acid-base status, fluid and electrolyte balance, and renal function, which are common complicating features of gastrointestinal diseases. Additional optional or special diagnostic procedures may be necessary in calves or foals with neonatal diarrhea, in horses with colic, and in ruminants with gastrointestinal stasis or displacement. The health status and productivity of dairy cattle, swine, and other food animals maintained in large confined groups involve a fragile balance between metabolic events, nutrition, agents of disease, management, and environmental factors. In these production units, the health status of the herd as a whole is of paramount importance. Subclinical disease or nutritional imbalance may contribute to suboptimal productivity. Most productivity problems in these settings are multifactorial. Defining and finding solutions to these problems can be a difficult and complicated task. Sequential assessment of weight gains, body condition scores, milk quality (fat and protein concentrations), and milk production are useful measures of the presence of subclinical production disorders but do not identify the cause. Metabolic profiling is a tool that has been used in some situations. Blood samples are drawn from a number of randomized individuals as representative of the group as a whole. Some have recommended the submission of pooled serum samples from representative individuals, much like the use of bulk tank tests as a reflection of the general level of mastitis in a herd. Sampling may be done routinely and sequentially (longitudinally). In dairy cattle this may be done during gestation or lactation but frequently focuses on the periparturient period when a combination of nutritional and metabolic events often contributes to costly production disorders. Metabolic profiles might include most of the parameters listed under the recommended general panel with the addition of magnesium, total cholesterol, nonesterified fatty acids (NEFA), and β-hydroxybutyrate (BOHB). BOHB, NEFA, and cholesterol may provide an indication of energy balance, whereas BUN, creatinine, total protein, albumin, and CK may be helpful in assessing protein status along with urea levels in milk. In certain settings, trace minerals or fat-soluble vitamin concentrations may be important indicators of underlying nutritional problems. Metabolic profiling is not a substitute for careful clinical examination, analysis of husbandry practices, and ration analysis, but it may play a useful role in some modern large-scale operations in which a variety of subclinical problems can quickly translate into financial disaster. One of the most commonly overlooked sources of variation in clinicopathologic data is the difference in results obtained by different laboratories. This can result in fivefold to tenfold differences in the normal range of certain enzyme activities among laboratories using similar but not identical methodologies. In the past there was marked variation in the units of measure used to express the activities of different serum enzymes. The standard method of representing serum enzyme activity is in international units per liter (IU/L), which is used in this text. Correction factors for converting the commonly used but older units of measure to international units are given in Table 22-1. The normal values given in Tables 22-2 and 22-3 are those currently used at the Ontario Veterinary College or are from the literature.2 It is always best and crucial to use normal values and reference intervals established for the species, age, and production type by the diagnostic laboratory to which samples are submitted. TABLE 22-1 Conversion of Conventional Units to International Units2 kPa, Kilopascal; Po2, partial pressure of oxygen; Pco2, partial pressure of carbon dioxide; Tco2, total carbon dioxide. There is relatively modest variation among species for most clinicopathologic parameters. Notable exceptions are plasma electrolyte concentration, erythrocyte potassium concentration in some breeds of sheep, and serum bilirubin concentration, which is higher in horses than in other species. Urea nitrogen (UN) is a less reliable indicator of renal function in ruminants and horses than creatinine because UN can be metabolized by the intestinal microflora. Donkeys and burros have a much higher GGT level than horses and cattle. Calves will have very high GGT levels compared with other species because of increased concentrations of this enzyme in bovine colostrum. Significant differences in hematologic parameters exist between hot- and cold-blooded horses. Hot-blooded horses include most of the athletic breeds of horses (Thoroughbred, Quarter Horse, Standardbred, and Arabian breeds). Cold-blooded horses include the pony and draft breeds. Cold-blooded horses have lower red blood cell (RBC) values both at rest and after exercise and maintain a slightly lower leukocyte count; they also have lower resting and fasting indirect bilirubin concentrations. Several important differences in hematologic and clinical chemistry exist between neonatal and adult animals within species. The effects of age have been studied most carefully in horses and cattle. In comparison to adult animals, suckling neonatal animals tend to have lower BUN, slightly lower total protein and globulin, moderately higher GGT and phosphate, and markedly greater alkaline phosphatase. Creatinine in foals can be a bit higher in well-muscled foals (up to 2.5 mg/dL) and occasionally very high (up to 8 mg/dL) shortly after birth and returning to normal values within 24 hours, and it is thought to be due to defective placental transfer.3 With the obvious exception of sex hormone concentrations, there are few recognized differences in clinical chemistry values between sexes. In most domestic animals the intact male tends to have a slightly higher erythrocyte count, hemoglobin concentration, and PCV than the female or neutered male. This sex-related difference has been demonstrated most clearly in the horse. Many factors influence the reliability and interpretation of results obtained by laboratory analysis. Sample collection and handling are very important factors. The sample collection site (e.g., jugular vein, mammary vein, tail vein, cephalic vein, lateral thoracic vein, ear vein or carotid artery, transverse fascial artery, metatarsal artery) can have an important effect on the results of tests such as blood gas evaluation, glucose, or ketones. The choice of anticoagulants depends on whether the samples are to be submitted for serum, plasma, or whole blood analyses. The specific sample requirements for the most commonly ordered clinical chemistry determinations are listed in Table 22-4. Serum is required for most chemistry parameters, and serum separator tubes work very well in most settings. There have been some indications that results of some serum hormone assays may be influenced by collection of blood in serum separator tubes. Sodium or lithium heparin is the anticoagulant of choice for most chemical determinations requiring plasma. Historically fluoride-oxalate was the anticoagulant of choice for blood glucose determination because it did halt glycolysis by the RBCs. However, fluoride may interfere with certain chemical procedures (specifically the glucose oxidase method for blood glucose determination) and should be used only for blood lactate determination or in selected circumstances in which glucose determinations are required and samples must be held for some period of time without refrigeration. Citrate is the anticoagulant of choice for clotting tests and blood typing. Ethylenediaminetetraacetic acid (EDTA) is the anticoagulant most often used for hematologic evaluation. Both citrate and EDTA are chelating agents, which may interfere with a wide variety of chemical analyses. TABLE 22-4 Recommended Anticoagulants for Hematologic or Clinical Chemistry Evaluation PT, Prothrombin time; PTT, partial thromboplastin time; T3, triiodothyronine; T4, thyroxine. Modified from Brobst DF, Parry BW. 1987. Normal clinical pathology data. In Robinson NE (ed), Current therapy in equine medicine, ed 2. Saunders, Philadelphia, PA. Samples should be submitted as soon after collection as possible, but circumstances may require storage of some samples for 12 to 24 hours. For collection of serum, whole blood should be allowed to clot before refrigeration. Serum should be separated from the RBCs immediately after clot formation and then kept refrigerated. Samples should be stored in clean containers free from exposure to sunlight, medications, or chemicals. If whole blood is left at room temperature for longer than 60 minutes, blood glucose will be falsely low as a result of RBC glycolysis. Storage of whole blood may result in in vitro hemolysis, with the potential for misleading increases in the serum or plasma enzymes AST and lactate dehydrogenase (LDH) and potassium and phosphorus concentrations as a result of hemolysis. In addition, failure to separate serum or plasma from the RBCs within an hour of collection may lead to leakage of erythrocyte potassium and a falsely elevated serum or plasma potassium concentrations. Stress, transportation, excitement, and handling produce physiologic responses in animals that affect a variety of hematologic and biochemical parameters. This is most evident in the horse, which shows marked increases in RBC mass and to a lesser extent plasma protein concentration in response to excitement, exercise, or catecholamine administration. The RBC count, hematocrit, and hemoglobin concentration can increase by as much as 50%, whereas plasma protein concentration may increase by 1 to 2 g/dL. Leukocytosis mainly seen as neutrophilia is induced as the marginating leukocyte pool is mobilized into the general circulation. Prolonged stress results in the release of endogenous corticosteroids, which produce the typical “stress response” in the leukogram. A similar leukogram is found in racehorses some 4 to 6 hours after racing. The combination of catecholamine and glucocorticoid release associated with stress, transport, and excitement, as well as with many gastrointestinal catastrophes, may result in markedly elevated blood glucose concentrations (up to 400 mg/dL). Modest elevations (twofold to fourfold increase) in muscle-derived enzymes occur in association with prolonged transport or endurance exercise. Large losses or compartmentalization of sodium-containing fluid accompanies many systemic disorders, particularly digestive problems such as diarrhea, colic, displacement of viscera, excessive sweat losses, and some urinary tract diseases. These forms of dehydration lead to decreases in plasma volume, which are indicated by moderate-to-marked increases in the PCV and TPP concentration. The concentration of other compounds dissolved in the plasma may also increase as a result of decreases in the plasma volume. The concentrations of compounds that are largely protein bound, such as calcium, are generally closely related to albumin concentration. More than 50% of serum calcium is bound to albumin. Increases or decreases in plasma protein concentration normally result in proportional changes in total serum calcium concentration, whereas the physiologically active ionized calcium may remain unchanged. Diseases that cause a reduction in effective circulating fluid volume often also cause alterations in renal function. This so-called prerenal azotemia results in moderate to marked elevation in BUN and creatinine. Although this is generally considered primarily a prerenal azotemia, real pathologic changes in the kidneys often are associated with the systemic processes initiated by these disorders. Longitudinal reevaluation of renal function (urinalysis, serum BUN, and creatinine) in these patients during the course of disease is important because it affects prognosis, response to fluid administration, and the potential for nephrotoxicity and systemic toxicity of a variety of chemotherapeutic agents used in such patients. Fasting laboratory data are important for evaluation of many disease conditions in human and small animal patients. Truly fasting conditions are rather difficult, given the large and complex gastrointestinal tract of most herbivores and are thus seldom used. The feeding of animals in relation to sample collection, however, can have an impact on the data obtained. Hay-feeding in horses is reported to affect sodium, potassium, and protein concentrations within the first few hours after feeding. Animals feeding on lush green pasture or large amounts of silage may have slightly different parameters from those fed high-concentrate rations. The anion-cation balance of the ration has an impact on relative serum electrolyte concentration, acid-base balance, and urine pH and urinary electrolyte excretion. Lactescent (cloudy) plasma may be observed in samples from nursing foals or calves. The fluid intake of the normal nursing neonate may range from 100 mL/kg/day to more than 250 mL/kg/day. This high fluid intake is reflected by a commensurately high output of urine with a low specific gravity and low osmolarity. The administration of certain medications may have an impact on some laboratory parameters. Tranquilization may be necessary for restraint and safe sample collection. The practitioner should be aware that tranquilizers often decrease RBC mass and plasma protein concentration. This is particularly true of the phenothiazine-derivative tranquilizers when used in the horse. Xylazine administered to large animals produces a modest catecholamine release, which may be evidenced by the slight sweating response seen in many horses sedated with this drug. Glucose concentration will increase modestly in response to the xylazine-induced catecholamine release. Repeated intramuscular injections with certain antibiotics (especially erythromycin and tetracycline) or other preparations that are locally irritating may produce slight-to-moderate elevations in muscle-derived serum enzyme activities. Intravenous administration of certain drugs and compounds such as dimethyl sulfoxide (DMSO) can produce intravascular hemolysis and hematuria. The amount of hemolysis in these circumstances is relatively small and of little consequence, except that it can cause confusion as to why hemoglobinuria occurred. PCV and TPP concentration are simple and convenient indicators of acute fluid alterations. Changes in the plasma volume generally are reflected by changes in the PCV and the TPP concentration. In dehydrated humans, changes in the PCV are believed to be the more reliable guide to changes in plasma volume because substantial protein fluxes into and out of the circulation have been shown to occur. However, in most animal species the range of normal for the PCV is much wider than for the TPP concentration. This is particularly true of horses, in which excitement, pain, or catecholamine release can produce variable mobilization of splenic erythrocytes, making it difficult to obtain a truly resting PCV. For these reasons, precise quantitative estimation of a change in plasma volume using these parameters is more complex and less reliable in large animal species. As plasma volume increases or decreases, the change in the PCV is always less than the change in the TPP concentration. However, a large disparity in the changes in the PCV and the TPP concentration in a patient with a history of loss of sodium-containing fluid and clinical evidence of reduced effective circulating fluid volume suggests blood or protein loss. Marked increases in the PCV with a normal-to-low TPP concentration frequently are encountered in animals with acute protein-losing enteropathies such as salmonellosis or equine toxic enteritis, or enterocolitis. In horses undergoing treatment for diarrhea, the excessive administration and retention of sodium-containing fluids is a key factor in the development of edema and hypoproteinemia. Blood loss generally results in a decrease in both PCV and TPP concentration with a lag time of up to 24 to 48 hours. The serum sodium concentration is a function of the exchangeable cation content (i.e., the exchangeable sodium [Na] in the extracellular fluid [ECF] volume plus the exchangeable potassium [K] in the intracellular fluid [ICF] volume relative to total body water). The ECF sodium content determines the ECF volume, whereas the ICF volume is a function of ICF potassium content. Changes in the sodium concentration reflect the net changes in this relationship and often do not represent accurately the changes in sodium balance. Changes in water balance are thus primarily responsible for changes in the serum sodium concentration and one should always consider the hydration status of the patient for sodium concentration interpretation. Hyponatremia is an indication of a relative water excess, whereas hypernatremia is an indication of a relative water deficit. Dehydration is defined as a loss of body water (fluid volume contraction). It occurs in a variety of clinical circumstances. The serum sodium concentration provides a means of categorizing dehydration in a physiologically meaningful way. Hypertonic dehydration, which occurs when water losses exceed the losses of sodium and potassium, is indicated by hypernatremia (free water loss or hypotonic fluid losses). The response of horses to feed and water deprivation is an example of this form of dehydration. Isotonic dehydration occurs with a balanced loss of water and electrolytes—that is, approximately 140 to 150 mEq of sodium plus potassium (Na + K) for each liter of water lost. Because the relative water balance has not changed, the serum sodium concentration remains unchanged despite the accumulation of what may have been a substantial body sodium deficit. The early stages of acute diarrhea and the dehydration of heavily sweating endurance horses are examples of isotonic dehydration. Hypotonic dehydration occurs when the losses of exchangeable cations (Na + K) exceed the net change in water balance; this condition is indicated by hyponatremia. Hypotonic dehydration often is seen in animals with subacute or chronic diarrhea that develop substantial water and electrolyte deficits but then replace part of the water deficit through water consumption. Fig. 22-1 shows the compartmental distribution of fluid between the ECF volume and the ICF volume in four situations. Hyponatremia results from retention of free water or excess loss of sodium. It is often but not invariably associated with conditions that cause sodium depletion such as vomiting, diarrhea, excessive sweat losses, and adrenal insufficiency. The fluid losses in these conditions are most often hypotonic or isotonic, and initial fluid and electrolyte deficits do not result in hyponatremia until water intake, renal water retention, or both disturb the balance between the remaining exchangeable cations and the total body water. The accumulation of sodium-containing fluid in body cavities or the gut lumen caused by ascites, peritonitis, or rupture of the bladder or by displacement, torsion, or volvulus of the gut is referred to as a third-space problem. When such accumulations develop rapidly, the plasma volume is reduced, and the serum sodium concentration subsequently may decrease as compensating renal responses cause water retention. Rupture of the bladder in neonatal foals is associated with marked hyponatremia and hypochloremia. As fluid intake continues and dilute urine accumulates in the abdomen, sodium, chloride, and other ions are drawn from the rest of the ECF into this accumulating fluid. No sodium or chloride has been lost from the body, and the observed decreases in the electrolyte concentration are caused by changes in the relative water balance (“water follows solute”). The neurologic signs seen in these foals are largely caused by the effects on the central nervous system of the rapidly developing and marked hypotonic hyponatremia. Progressively severe neurologic disturbances may be seen as the serum sodium concentration falls below 115 mEq/L and then below 100 mEq/L. The severity of the neurologic abnormalities is a function of both the rate at which hyponatremia develops and the absolute degree of hyponatremia. Neurologic disturbances can occur iatrogenically if excessive amounts of free water (usually given as 5% dextrose) are administered to patients with altered renal function. Mastitis results in an increased loss of sodium in the milk, and a low-grade mastitis problem in a dairy herd on a marginal dietary salt intake may result in sodium depletion and medullary washout. Decreased milk production, polyuria, hyposthenuria, and a low urine sodium level may be noted, although the serum sodium concentration may remain within the lower range of normal. The most common causes of hyponatremia are listed in Box 22-1. Marked hyperlipidemia or hyperproteinemia produces a falsely low sodium concentration value because lipid or protein occupies a significant volume in the serum or plasma sample and because sodium is present only in the aqueous phase. This potential cause of hyponatremia is indicated by an increase in the osmolar gap between measured and calculated osmolality. The use of direct ion-selective electrodes (direct potentiometry; all modern blood gas machines) for electrolyte determinations avoids this potential cause of a falsely low sodium concentration value. Marked hyperglycemia causes a reduction in the measured serum sodium concentration of approximately 1.6 mEq/L for every 100 mg/dL increase in the glucose concentration. Increases in the plasma glucose concentration generate osmotic forces that result in the movement of cellular water into the ECF, diluting the plasma sodium concentration. Hypernatremia can develop if water is lost in excess of sodium or if sodium is ingested in excess of water. Hypernatremia can occur in the initial stages of diarrhea, vomiting, or renal disease if water loss exceeds electrolyte loss (Box 22-2). When water losses are replaced by increased water consumption, enhanced renal water retention, or both, the serum sodium concentration decreases. Food and water deprivation in normal horses and cattle is associated with substantial reduction of renal and fecal output, but continued cutaneous and respiratory insensible water loss may result in hypernatremia (primary water loss). Hypernatremia may occur transiently as a result of sodium excess after administration of hypertonic saline or hyperosmolar sodium bicarbonate if water intake is restricted or impaired. Hypernatremia has been reported in calves fed an inappropriately mixed oral electrolyte replacement solution as their only fluid intake.5 The hypernatremia observed with salt poisoning in cattle and swine is the result of water restriction in animals that have been maintained on a high-salt intake. Potassium is the major intracellular cation. Between 60% and 75% of total body potassium is found within muscle cells and in bones. Only 5% is in the ECF and not always a reflection of total body potassium. The serum potassium concentration is influenced by factors that alter internal balance (the distribution of potassium between the ECF and the ICF) and those that change external balance (potassium intake and output). Potassium is higher in foals compared with adult horses. Generally, herbivores have a net positive intake in potassium, which is usually carefully regulated by the renal system. Serum potassium concentrations correlate relatively well with total body potassium content in cattle but not in horses. Changes in the serum potassium concentration occur in a wide variety of clinical circumstances and have profound neuromuscular effects that are largely the result of changes in cell membrane potential. The responses to dehydration and acid-base imbalance often complicate the evaluation of the potassium concentration. For example, calves with acute diarrhea often develop body potassium depletion because of excessive losses and inadequate intake, but the serum potassium concentration of these animals is usually normal to increased as the result of renal shutdown and the metabolic acidosis induced by dehydration, sodium depletion, and hypovolemia. Hypokalemia may become evident only as other fluid and electrolyte losses are replaced. Measuring the erythrocyte potassium concentration is relatively easy and has been suggested as an aid in assessing the need for potassium supplementation in racehorses with recurrent muscle disease or in alert downer cows early postpartum. However, experimental studies in horses indicate that the erythrocyte potassium concentration does not always accurately reflect potassium deficits. Hypokalemia increases resting membrane potential, resulting in muscle weakness, impaired urine concentration ability, and arrhythmias. Hypokalemia may result from depletion of the body’s potassium stores or from a redistribution of potassium from the ECF into the ICF space (Box 22-3). Hypokalemia is most commonly seen with altered intake and absorption and with excessive potassium losses from the gastrointestinal tract caused by vagal indigestion, torsion of the abomasum, ileus, or diarrhea. Excessive renal loss may result from mineralocorticoid excess, certain diuretics, or altered renal function, as reported in horses with renal tubular acidosis. Marked hypokalemia develops when reduced dietary intake caused by anorexia is associated with excessive potassium losses (e.g., causing muscle paresis in dairy cows early postpartum). Hypokalemia without potassium depletion results from the movement of extracellular potassium to the intracellular space. This form of hypokalemia occurs in response to an acute alkalosis and to the administration of insulin or glucose. Overzealous and rapid administration of sodium bicarbonate can produce an alkalosis with a profound and rapidly developing hypokalemia. Animals with moderate potassium deficits that are vigorously treated with sodium bicarbonate to correct a coexisting mild metabolic acidosis may be particularly prone to this problem. The initial response to catecholamine administration is a modest, transient increase in potassium caused by α-adrenergic stimulation, which is often followed by hypokalemia caused by β-adrenergic receptor responses. Pseudohypokalemia is seen in severe lipemia with potassium measured with indirect potentiometry (e.g., automated profile chemistry analyzers).
Clinical Chemistry Tests

Submission of Laboratory Samples
Veterinary Diagnostic Services
Selection of Procedures
General Panel.
Muscle Panel.
Liver Disease Panel.
Renal Disease Panel.
Gastrointestinal Disease Panel.
Metabolic Profiling
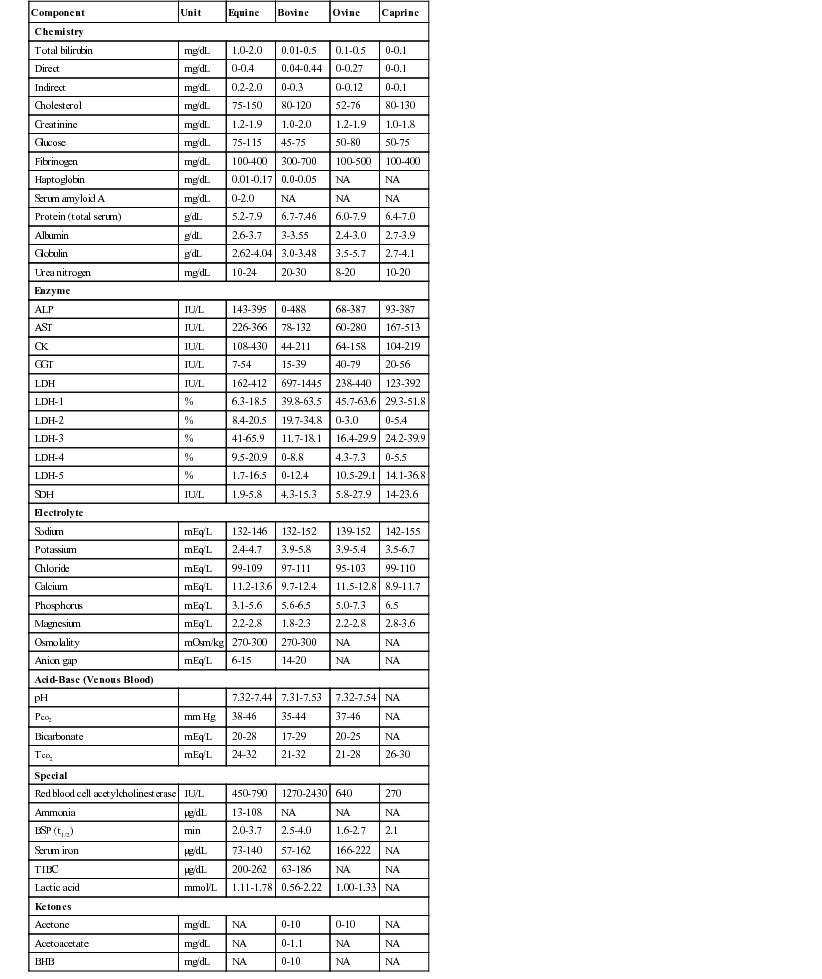
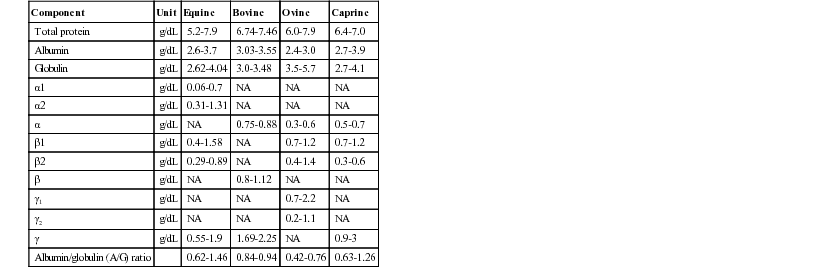
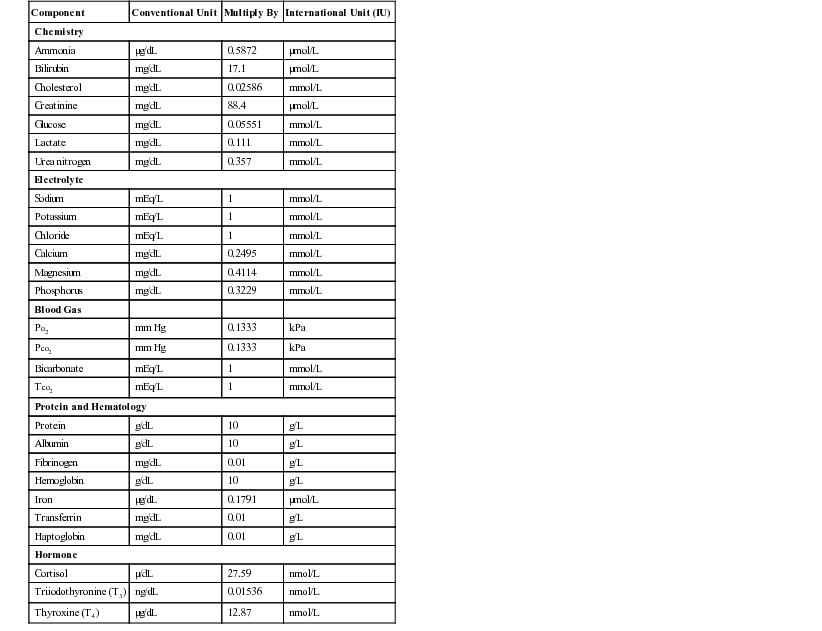
Sources of Variation in Normal Values
Laboratory
Component
Conventional Unit
Multiply By
International Unit (IU)
Chemistry
Ammonia
µg/dL
0.5872
µmol/L
Bilirubin
mg/dL
17.1
µmol/L
Cholesterol
mg/dL
0.02586
mmol/L
Creatinine
mg/dL
88.4
µmol/L
Glucose
mg/dL
0.05551
mmol/L
Lactate
mg/dL
0.111
mmol/L
Urea nitrogen
mg/dL
0.357
mmol/L
Electrolyte
Sodium
mEq/L
1
mmol/L
Potassium
mEq/L
1
mmol/L
Chloride
mEq/L
1
mmol/L
Calcium
mg/dL
0.2495
mmol/L
Magnesium
mg/dL
0.4114
mmol/L
Phosphorus
mg/dL
0.3229
mmol/L
Blood Gas
Po2
mm Hg
0.1333
kPa
Pco2
mm Hg
0.1333
kPa
Bicarbonate
mEq/L
1
mmol/L
Tco2
mEq/L
1
mmol/L
Protein and Hematology
Protein
g/dL
10
g/L
Albumin
g/dL
10
g/L
Fibrinogen
mg/dL
0.01
g/L
Hemoglobin
g/dL
10
g/L
Iron
µg/dL
0.1791
µmol/L
Transferrin
mg/dL
0.01
g/L
Haptoglobin
mg/dL
0.01
g/L
Hormone
Cortisol
µ/dL
27.59
nmol/L
Triiodothyronine (T3)
ng/dL
0.01536
nmol/L
Thyroxine (T4)
µg/dL
12.87
nmol/L
Species
Breed
Age
Sex
Factors Influencing Results or Their Interpretation
Anticoagulant
Specimen
Test or Procedure
Ethylenediaminetetraacetic acid (EDTA)
Whole blood
Complete blood count, cross-match, platelet count
Whole blood
Blood selenium
Plasma
Refractometric protein and fibrinogen
Peritoneal fluid
Fluid analysis
Bone marrow
Hematologic evaluation
Synovial fluid
Fluid analysis
Heparin
Whole blood
Blood pH, blood gases
Plasma
Electrolytes, osmolality
Synovial fluid
Mucin clot test
Fluoride and oxalate
Plasma
Lactate
Citrate
Whole blood
Blood typing
Plasma
Coagulation tests (PT, PTT, factor analysis)
None, serum separator tubes
Serum
Most chemistries, electrolytes, osmolality
Protein electrophoresis
Hormones (cortisol, T3, T4)
Immunoglobulins (IgG, IgM, IgA)
Fluid and Electrolyte Balance
Packed Cell Volume and Total Plasma Protein
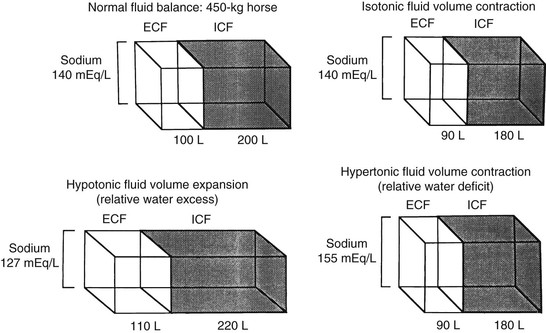
Serum Sodium
Hyponatremia.
Hypernatremia.
Serum Potassium
Hypokalemia.
![]()
Stay updated, free articles. Join our Telegram channel

Full access? Get Clinical Tree


Clinical Chemistry Tests
Chapter 22