Fig. 1.
Typical 4-h intake patterns of binge-eating resistant (BER) versus binge-eating prone (BEP) rats; N = 20/group. (a) When only chow is available the groups are indistinguishable by their intake (ns). (b) When PF is available with chow, BEPs consistently consume >40% more PF kilocalories than BERs (***p < 0.001). The effect is also observed with a smaller N = 8–10 rats/group (16, 17, 20, 21). Reproduced, with permission, from (5).
3.6.1 Effect of Acute Food Deprivation on BEP Versus BER Rats
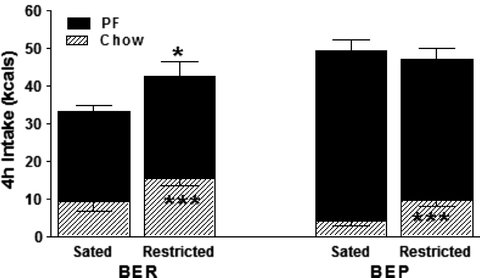
As shown in Fig. 2, a period of caloric restriction causes BERs to eat significantly more food then when sated. This increase consists of greater chow intake, which is typical of rats hungry from metabolic deficit (25, 31). BEPs, too, eat proportionally more chow than when sated and so appear to respond normally to hunger. Also, because hungry BEPs do not eat more total kilocalories than hungry BERs, it can be implied that they also have normal satiety. However, as also shown in Fig. 2, the amount of total kilocalories that BEPs eat under restricted conditions matches the amount of calories they take in under sated conditions. This behavior is clearly abnormal especially given the behavioral indices of normal hunger and satiety cues in these rats. The responses just described are observed in the 4th hour of feeding but can all be observed as early as after the 1st hour of feeding (5). Clinical binge eating also appears to be unaffected by hunger and satiety cues. Indeed, hunger is one of the weakest triggers of binge eating and binges are diagnostically defined as occurring in the absence of hunger (1, 32–34). In humans, a more potent trigger is stress (34–38).


Fig. 2.
Amount of chow and PF consumed by BEPs and BERs (N = 10/per condition) under calorically restricted or hungry versus ad libitum or sated conditions. BERs eat more total kilocalories after a period of deprivation,*p < 0.05, and both groups eat proportionately more chow kilocalories under food deprived than sated conditions, ***p < 0.001. However, BEPs eat as many kilocalories when sated as when they are hungry after a period of food deprivation (ns). Reproduced, with permission, from (5).
3.6.2 Effect of Stress on BEP Versus BER Rats
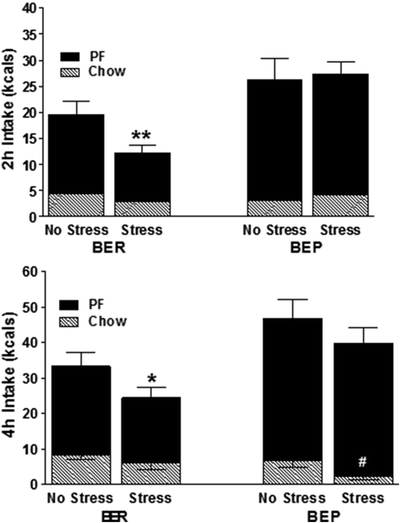
As seen in Fig. 3, at 2 h following foot shock, stressed BERs consume less food than when not stressed. This is the expected and normal response of rats to laboratory stressors (26, 27). However, stressed BEPs fail to display this normal hypophagia and in fact appear to be completely unaffected by shock. By 4 h, stress causes BERs to remain hypophagic. Notably, they are eating less PF, not less chow. By this time BEPs appear somewhat affected by the stress, but their decrease in intake is due to forsaking the healthy chow over PF. Their PF intake remains abnormally elevated. By 24 h, the intake of each group normalizes to match their counterparts’ intake under nonstressed conditions. The behavior of BEPs under stress resembles that of human binge eating in that stress triggers overeating versus undereating and is associated with increased consumption of PFs (34–37). In human binge eating, stress may actually make PFs more rewarding (38). Just how rewarding BEP rats find PF can be seen by how much punishment they are willing to tolerate for it.


Fig. 3.
Amount of chow and PF consumed by BEPs and BERs following foot shock stress or no stress (N = 10/condition). (a) In the first 2 h, only BERs show a normal anorectic effect to stress, **p < 0.01 versus unstressed BERs. At this time, BEPs are not affected by stress. (b) By 4 h, there is evidence of a stress-induced anorectic effect in BEPs but the decreased intake is on chow, not PF intake (#p < 0.05). Conversely, at 4 h, BERs forsake PF, not chow, when stressed (*p < 0.05). Reproduced, with permission, from (5).
3.6.3 Effect of Suffering Consequences for PF in BEP Versus BER Rats
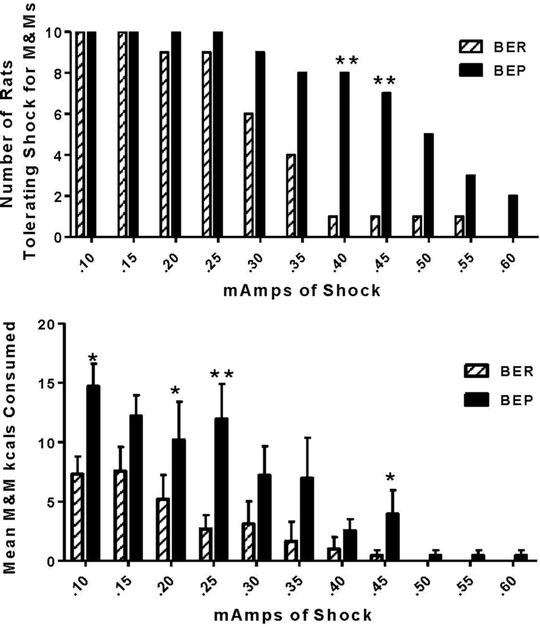
As shown in Fig. 4, BEPs make significantly more M&M® retrievals than BERs. This difference reaches significance at shock levels of 0.25 mA and higher. At 0.40 mA and higher, only one BER versus 8 BEP rats braved shock for M&M’s®. Only BEP rats continue to cross at 0.60 mAs (Fig. 4). As also seen in Fig. 4, the retrieved M&M’s® are consumed as evidenced by the 2-fold greater kcal intake of M&M’s® by BEPs versus BERs across all shock levels (16). In sum, the BEP rats’ willingness to tolerate increasing pain and anxiety associated with foot shock models the addictive-like nature of human binge-eating where motivation to binge-eat persists despite the mounting psychological and physical consequences directly associated with this behavior (1, 39–41).


Fig. 4.
(a) More BEP versus BER rats are willing to cross incrementing levels of foot shock to obtain M&M® candies; **p < 0.01; N = 10/group. (b) The retrievals are also consumed by the BEPs for a final greater intake of M&M’s® vs. BERs across all levels and statistically significant at some of the levels denoted by *p < 0.05; and **p < 0.01. Reproduced, with permission, from (16).
3.6.4 Effect of a High-fat Diet on the Propensity of BEP Versus BER Rats to Develop Obesity
When BEP and BER rats are fed a high-fat diet for 2 weeks, exactly half of the BERs and half of the BEPs develop obesity while the other half of each BEP and BER group resist weight gain. The obese-prone rats gain approximately 8.3% of initial body weight vs. a 1.9% gain by the obese-resistant rats (p < 0.01) (5). This is due to the obese-prone rats’ failure to decrease their normal volume of food when forced to eat the more calorie-dense high-fat diet. Importantly, BEPs are as likely to do this as BERs. Each group is also as likely to voluntarily restrict the amount of the high-fat diet which results in maintaining normal weight.
At the end, the DIO protocol yields four subgroups that can be used to investigate possible biological differences between bulimia nervosa, BED, non-binge-eating obesity, and healthy controls (see Table 1). For example, some individuals with bulimia or BED resist obesity through compensatory behaviors, including limiting caloric intake (1, 42). Similarly, the obese-resistant BEP rats reduce their volume of high-fat intake, thereby reducing total kilocalories consumed to maintain normal body weight. Not all human motivations to restrict caloric intake can be modeled in rats, but there may be a common physiology between bulimia nervosa patients and BEP-obese-resistant rats that enables them to reduce caloric intake amidst PF, a physiology possibly compromised in BEP-obese-prone rats and obese individuals with BED.
Table 1
Clinical conditions represented by the four subgroups that result from placing BEP and BER rats on a traditional diet-induced obesity (DIO) protocol
BER | BEP | |
|---|---|---|
Obese-Resistant | Healthy | Bulimia Nervosa |
These rats do not have a binge pattern on intermittent PF and when placed on a forced high-fat diet stay lean by voluntarily eating less | These rats have a binge pattern on intermittent PF but remain lean when placed on a forced high-fat diet by voluntarily eating less or by “compensating” for the increased calories | |
Obese-Prone | Frank obesity | Binge-eating disorder |
These rats do not have a binge pattern on intermittent PF but gain weight on a forced high- fat diet because they fail to adjust their intake for the additional calories of that diet | These rats have a binge pattern on intermittent PF and gain weight on a forced high-fat diet because they fail to compensate for the additional calories of that diet |
3.6.5 Effect of Developmental Factors on the Expression of BEP Versus BER Patterns
As is typical of the BEP/BER model in the author’s hands, Klump and colleagues found that roughly one-third of an initial group of thirty rats could be clearly classified as BEPs and one-third as BERs based on their significant difference in amount of PF intake (17). Of major importance is that when they observed PF intake patterns across time, they found that the onset of the BEP phenotype does not appear until mid-late puberty (P39-P58). This seminal change in PF intake occurred as chow intake during chow-only days, and body weights, remained the same for both groups. Only PF intake differed. The emergence of PF binge eating shortly after puberty was replicated in a separate squad of N = 36 rats that were exposed to more frequent feeding tests during puberty (three times per week vs. one time per week) (17). The results are a compelling parallel to the age of onset for eating disorders, which is after puberty (1, 2, 43). Results from the OVX study revealed that OVX caused an expected increase in general food intake and body weight across all hormone-depleted rats, regardless of BEP or BER status. However, the OVXed BEP rats still continued to eat significantly more PF than the OVXed BER rats (21). The fact that BEP/BER patterns remained stable despite removal of estradiol indicates that other—yet unknown—signals activated at puberty are needed to express binge eating. While these results were at first surprising given that the BEP pattern appears after and not before puberty, they are consistent with the fact that a significant number of men, and not only women, develop BEDs (2).
3.7 Troubleshooting and Guidelines if Altering Variables
3.7.1 Identifying BEP/BER Status
In the rare event that not enough rats meet the four-out-of-four or three-out-of-four feeding test criteria for consistency in PF intake, additional tests should be conducted. When choosing BEP rats, if, after selecting the most consistent eating animals, the choice must be made between selecting a rat that ate in the highest quartile three times and once in the lowest quartile versus a rat that ate three times in the highest quartile and once in the middle quartile, the latter should be chosen into the BEP group because the middle values are closer to the high end of intake. The same applies to selection of BER rats (middle intake is closer to the lowest tertile than the highest tertile). There is no specific amount of kilocalories that determine BEP or BER status. As pointed out by Klump et al., this also parallels the method by which clinical binge-eating was first defined; it was based on comparing women in the high vs. low ends of the binge eating distribution (1, 17).
3.7.2 Using Other Palatable Foods to Identify BEP/BER Status
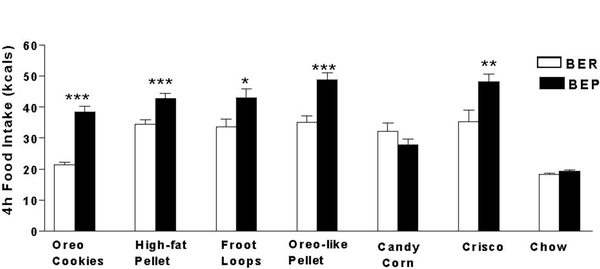
Most studies have used either Oreo cookies (5, 16, 20) or Betty Crocker® Vanilla Frosting (General Mills, MN) (17, 21). Figure 5 illustrates that rats first identified as BEP/BER with Oreos®, exhibit the same patterns of intake on other PFs, including high-fat pellets (Research Diets, Diet # D12266B, NJ), Oreo-flavored pellets (Research Diets, NJ), Froot Loops® (Kellogg, MI), Crisco® (Proctor & Gamble, OH) (5), and M&M’s® (16). Hence, it may be possible to identify BEP and BER rats with nonfat sugary (e.g., Froot Loops) or nonsugar fatty PFs (e.g., Crisco®) and not just mixed macronutrient PFs like Oreos® and frosting. Still, one is warned to first test any new PF. For example, Fig. 5 illustrates that one of the PFs tested, Candy Corn (Brach’s Confections, TN), failed to yield a significant difference between groups although it was still preferred over chow by both groups (5). Hence not all PFs may dissociate BEPs from BERs. It may be that some PFs produce negative alliesthesia more quickly than others and BEPs may be as sensitive to this as BERs. Salty snack foods have not been tested, but are predicted to discern BEP/BER groups given that rats find them rewarding (44).


Fig. 5.
The BEP/BER patterns generalize to other PFs including those containing mainly sugar (Froot Loops)®, mainly fat (Crisco)®, or combinations of both (cookies, pellets). All are preferred by both groups (N = 20/group) over chow but, with the exception of candy corn, BEPs eat significantly more of them than do BERs; *p < 0.05, **p < 0.01, ***p < 0.001. Reproduced, with permission, from (5).
3.7.3 Using Alternate Modes of Stress-Induction
If foot shock is not practical, there is no reason that other standard laboratory stressors, including immobilization, cold temperature or water exposure, social defeat, noise, or emotional stress, should not yield the same differences in responses to stress observed in the BEP and BER rats. A particular “human-like” stressor, to the extent that craving can be regarded as stressful, is to dangle the PF in front of the rats without allowing them access to it. This has been used successfully in replications of the author’s stress + dieting model of binge eating, which originally used foot shock (45).
< div class='tao-gold-member'>
Only gold members can continue reading. Log In or Register to continue
Stay updated, free articles. Join our Telegram channel

Full access? Get Clinical Tree


