Database search
Buffer 1
Buffer 2
Buffer 3
Buffer 4
Ixodida
62.9 %
48.2 %
44.4 %
82.0 %
Pecora
72.4 %
44.2 %
40.2 %
72.7 %

Fig. 1
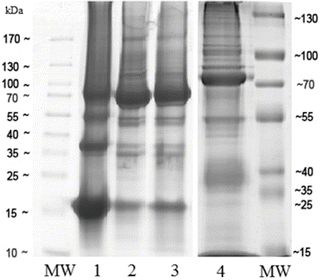
Representative one-dimensional SDS-PAGE gel showing protein band patterns in extracts prepared using different protein extraction buffers. (1) Proteins extracted with buffer 1. (2) Proteins extracted with buffer 2. (3) Proteins extracted with buffer 3. (4) Proteins extracted with buffer 4. MW: molecular weight markers (PageRuler Plus Prestained Protein Ladder, Scientific, San Jose, CA, USA). Twenty micrograms of soluble fractions are run on a 5 mm wide conventional 12 % SDS-PAGE gel performing electrophoresis at 180 V of constant voltage. Bands are visualized by staining with GelCode Blue Stain Reagent by manufacturer’s protocol
3.3 Protein Fractionation Method
In this extraction method, an additional step is introduced for sample processing, thus resulting in the fractionation of the crude extract into cytosolic (supernatant) and plasma membrane-associated (pellet) protein fractions:
1.
Extract the tick proteins following the same steps as in the previous method (Subheading 3.2, steps 1–6).
2.
After the centrifugation at 200 × g, additionally centrifuge the obtained supernatant at 12,000 × g for 20 min obtaining two fractions: cytosolic-enriched protein supernatant and crude plasma membrane-enriched protein pellet.
3.
Collect the supernatant and quantify the protein content with the BCA Protein Assay (Fig. 2a) (see Note 4 ).


Fig. 2
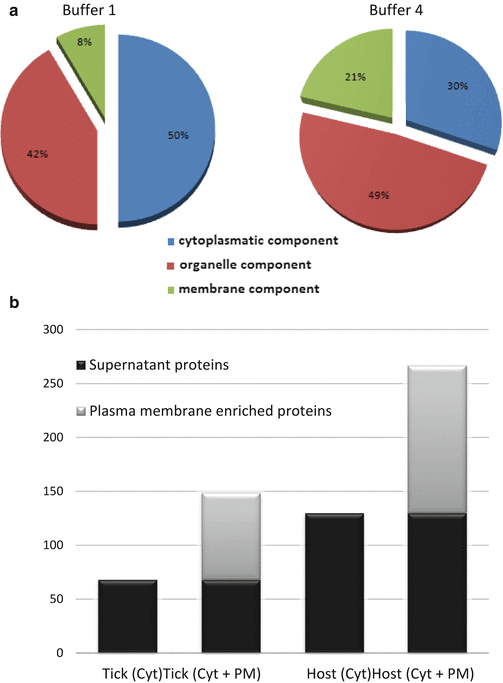
The subcellular distribution of the extracted proteins depends on the buffer used. (a) Subcellular distribution of identified tick proteins after extraction with buffer 1 and buffer 4. We observed that buffer 4, a more astringent buffer, allows the extraction of a greater number of internal organelle and membrane proteins. (b) Number of identified tick and host proteins in the different fractions obtained using the buffer 1. An average of 41 % increase in the number of tick proteins and up to 72 % for host proteins is detected when crude plasma membrane fraction is included in the analysis compared to the supernatant fraction only. Therefore, it is necessary to process both fractions, cytoplasmatic soluble, and plasma membrane pellet, obtained after detergent extraction and separated by ultracentrifugation, in order to characterize the entire proteome. Identification is performed using the SEQUEST algorithm of Proteome Discoverer 1.3 against Ixodida and Ruminantia databases for tick and host proteins identification, respectively. An FDR<0.05 for tick and an FDR<0.01 for host proteins identification are considered as cutoff. Abbreviations: Cyt, cytoplasmic soluble protein fraction; PM, plasma membrane protein fraction
4.
Resuspend the pellet containing the crude plasma membrane fraction directly in 100 μl of Laemmli sample buffer and leave on a vertical rotating shaker for 30 min to 1 h at 20 °C with vigorous shaking to enable solubilization.
3.4 Proteome In-Gel Digestion
1.
Precipitate 200 μg of protein extracts to be analyzed by adding four volumes of ice-cold acetone to one volume of sample. Vortex the mixture, incubate at −20 °C for at least 4 h, and centrifuge at 12,000 × g for 15 min at 4 °C. Discard the supernatant, air-dry the pellet, and resuspend in 100 μl of Laemmli sample buffer supplemented with 5 % β-mercaptoethanol.
2.
Apply the samples onto 1.2 cm wide wells in a 12 % SDS-PAGE gel.
3.
Stop the electrophoretic run as soon as the front enters 3 mm into the resolving gel, so that the whole proteome becomes concentrated in the stacking/resolving gel interface (see Note 6 ).
4.
Stain with GelCode Blue Stain Reagent for visualization of the unseparated protein bands, excise the gel-containing bands, cut into 2 × 2 mm cubes, and transfer into a microcentrifuge tube.
5.
Destain gel pieces, alternating 50 mM ammonium bicarbonate/acetonitrile (1:1, v/v) with neat acetonitrile, incubating for 10 min at room temperature with occasional vortexing until the gel pieces become white and shrink; remove acetonitrile; and dry gel pieces.
6.
Cover gel pieces with 60 ng/μl of sequencing grade trypsin at 5:1 protein/trypsin (w/w) ratio in 50 mM ammonium bicarbonate, pH 8.8, containing 10 % (v/v) acetonitrile and leave it in an ice bucket for 2 h to saturate them with trypsin. If all solution was absorbed, add 20–30 μl of 50 mM ammonium bicarbonate and digest overnight at 37 °C.
7.
Add trifluoroacetic acid to a final concentration of 1 % to stop the digestion.
8.
Desalt the samples using OMIX pipette tips C18 following the manufacturer instructions, vacuum dry, and store at −20 °C until the mass spectrometry analysis.
3.5 Reverse-Phase Liquid Chromato-graphy (RP-LC)-MS/MS Analysis
1.
Resuspend the protein digests in 0.1 % formic acid and analyze by RP-LC-MS/MS in an Easy-nLC II system coupled to an ion trap LCQ Fleet mass spectrometer (Thermo Scientific, San Jose, CA, USA).
2.
The peptides are concentrated (online) by reverse-phase chromatography using a 0.1 mm × 20 mm C18 RP precolumn (Thermo Scientific) and then separated using a 0.075 mm × 100 mm C18 RP column (Thermo Scientific) operating at 0.3 μl/min.
3.
Elution of peptides is done using a 180 min gradient from 5 to 35 % solvent B (solvent A, 0.1 % formic acid in water; solvent B, 0.1 % formic acid in acetonitrile). ESI ionization is done with nano-bore emitters stainless steel ID 30 μm (Thermo Scientific) interface (see Note 7 ).
4.
Peptides are detected in survey scans from 400 to 1,600 amu (1 μscan), followed by three data-dependent MS/MS scans (Top 3), using an isolation width of 2 in mass-to-charge ratio units, normalized collision energy of 35 %, and dynamic exclusion applied during 30 s periods (see Note 8 ).
3.6 Proteomics Data Analysis
Peptide identification from raw data is carried out using the SEQUEST algorithm (Proteome Discoverer 1.3, Thermo Scientific):
1.
Database search is performed against Uniprot-Ixodida.fasta (57,021 entries in January 2014), Uniprot-Pecora.fasta (67,200 entries in January 2014), and Uniprot-Alphaproteobacteria.fasta (2,480,730 entries in January 2014) (http://www.uniprot.org) for tick, host, and pathogen proteins identification, respectively.
2.
The following constraints may be used for the searches: tryptic cleavage after Arg and Lys, up to two missed cleavage sites, and tolerances of 1 Da for precursor ions and 0.8 Da for MS/MS fragment ions and the searches were performed allowing optional Met oxidation and Cys carbamidomethylation. Search against decoy database (integrated decoy approach) is done using false discovery rate (FDR) <0.01.
3.7 Hemoglobin Removal
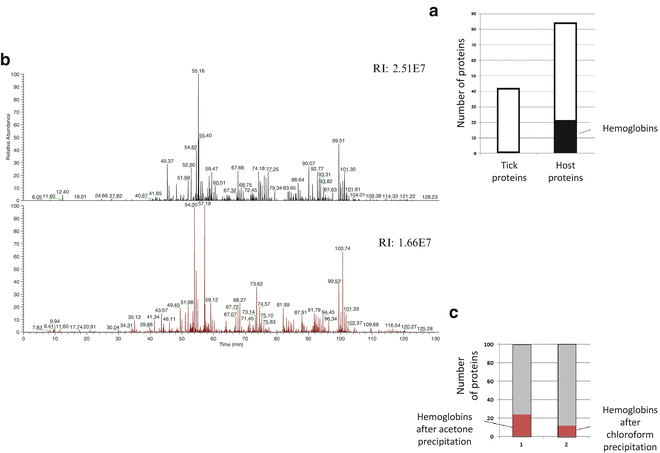
In ticks collected after feeding on a host, the major constrain for the successful protein identification is the large amount of the host proteins, predominantly blood. These proteins, such as hemoglobin, serum albumin, and immunoglobulins, are very abundant and mask the detection of vector and pathogen proteins. In engorged tick samples, a high abundance of host hemoglobin is detected within an average of 20 % of the total number of identified proteins (Fig. 3a) (see Note 9 ). We next describe the comparison of the efficacy of two methods for removal of these hosts proteins from tick samples: a method reported to remove hemoglobin from blood samples [18] with minor modifications and a conventional precipitation method with ice-cold acetone that was used as a control:


