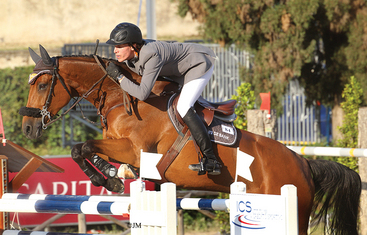
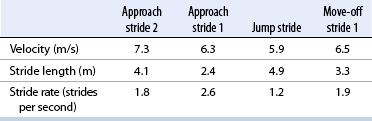
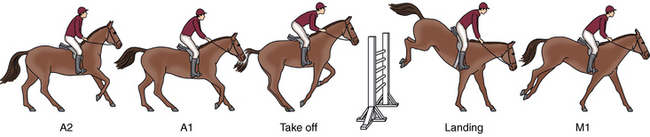
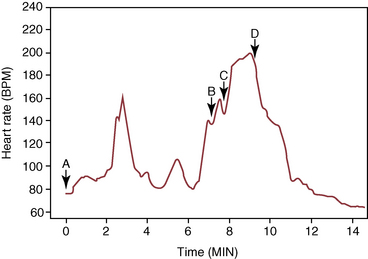
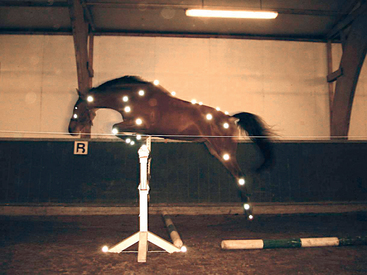
CHAPTER 25 The first Olympic show-jumping course consisted of 15 fences, some of which were combinations and some jumped twice for a total of 29 jumping efforts. The maximum dimensions were 1.40 m high and 4 m wide. Today, the maximum dimensions under the rules of the Fédération Equestre Internationale (FEI, International Equestrian Federation) are 1.70 m high (except in puissance, power, and skill or a high jump record) 2 m wide for a spread fence (except a triple bar, for which the limit is 2.20 m), and 4.50 m wide for the water jump (except when trying to establish a record) (Anon, 2011) (Figure 25-1). FIGURE 25-1 Henrik von Eckermann on Quibell (Quintero x Cento), Rome, 2012. (Photo courtesy Jacob Melissen.) A horse’s conformation undoubtedly affects its jumping ability, but data correlating specific conformational attributes to success in jumping competitions are limited. Typically, good jumpers are taller at the withers (Fabiani, 1973; Langlois et al., 1978; Neisser, 1976), compared with dressage horses (Muller and Schwark, 1979). The shoulder is preferably sloping and the forepastern has been shown to be significantly larger in elite jumping (and dressage) horses compared with other riding horses (Holmstrom et al., 1990). The ratio between chest girth and wither height tends to be relatively low in good show jumpers, as does the ratio between cannon circumference and wither height (Fabiani, 1973). A long neck is thought to be an advantage for jumping horses, possibly because this feature makes it easier for the horse to maintain balance over the fence (Holmstrom, 2001). Good width through the hip and gaskin, as viewed from behind, is desirable. The length of the pelvis has been reported to have a positive correlation with jumping ability and a forwardly sloping femur was also found to correlate to good jumping performance in the same study (Langlois et al., 1978). The latter feature has, by the way, been shown to have the strongest correlation to overall quality gait of all studied conformational variables (Holmstrom and Philipsson, 1993). Show jumpers have shorter backs compared with dressage horses, which is possibly related to the required suppleness in the dressage horse (Johnston et al., 2004). The stride in which the horse jumps the fence is called the jump stride (JS). It is characterized by a long suspension between liftoff of the LdH and impact of the TrF, during which the horse is airborne over the fence. The airborne phase is called the jump suspension; the hindlimb stance phases preceding the jump suspension constitute the take-off, and the front limb stance phases following the jump suspension are referred to as the landing. The strides preceding (approach strides) and following (move-off strides) the jump stride are named from the jump outward (see Figure 25-l). Starting three full strides before the jump, they are known as approach stride 3 (A3), approach stride 2 (A2), approach stride 1 (A1), and jump stride (JS), move-off stride 1 (M1), move-off stride 2 (M2), and move-off stride 3 (M3) (Clayton, 1989). The strides A1 and M1 are highly modified canter strides; Al initiates the upward movement of the forehand prior to takeoff, whereas M1 re-establishes the horse’s balance after landing. The horizontal velocity, stride length, and stride rate for strides A2, A1, JS, and M1 are shown in Table 25-1. The stride length is adjusted during the approach so that the take-off occurs at an appropriate distance from the base of the fence. In a study of four Grand Prix horses jumping vertical and square oxer fences with a height and width of 1.10 m to 1.40 m, no significant difference was found for the limb displacements from the base of the fence in strides A2, Al, JS, or MI (Clayton and Barlow, 1989). Therefore, the take-off distance was the same regardless of fence height or width, within the range tested, and any adjustments in stride were made prior to stride A2. The limb placed closest to the fence on the take-off side is usually the LdF in stride A1 (Clayton and Barlow, 1989). One study found a correlation between fewer penalties during a competitive round and the tendency to place the LdF closest to the base of the fence on the take-off side (Deuel and Park, 1991). During approach strides up to and including A2, the horse canters in a collected frame. The head and neck are elevated, the nose is ahead of the poll (Figure 25-2), and the TrH and LdF make impact almost synchronously. Compared with the preceding strides, Al is a short, quick stride (see Table 25-1), in which the horse’s motion is often described as “patting the ground.” Stride Al has a four-beat rhythm due to dissociation of the diagonal limb pair, with the LdH making impact before the TrF. The head and neck stretch forward and down as the horse lowers its center of gravity prior to initiation of the upward movement (see Figure 25-2). The front limbs are thrust forward in a strutting action, hitting the ground at a more acute angle than usual (Clayton and Barlow, 1989), which allows them to decelerate the forward movement of the body (Merkens et al., 1991). Consequently, the reduction in horizontal velocity during stride Al (see Table 25-1) is quite significant. The front limbs also provide a large vertical force that starts the upward movement of the forehand. Since the TrF exerts a higher peak vertical force (Merkens et al., 1991) and has a longer stance duration than the LdF (Clayton and Barlow, 1989), it makes a greater contribution to the upward impulse. A short suspension follows liftoff of the LdF (Clayton and Barlow, 1989; Merkens et al., 1991) and then the hindlimbs hit the ground to initiate the take-off. During the take-off, impact of the TrH may precede that of the LdH, but often the two hindlimbs are placed almost synchronously (Clayton and Barlow, 1989; Leach et al., 1984). Initially, the hindlimbs decelerate the forward movement, but then a large horizontal accelerative force is applied in the later part of the take-off (Merkens et al., 1991). The hindlimb stance duration is longer during take-off than in a normal stride, which allows the generation of a large impulse (Clayton and Barlow, 1989). Since the center of gravity lies ahead of the line of action of the force exerted by the hindlimbs against the ground, this force imparts angular momentum that causes the horse’s body to rotate forward around the center of gravity during the jump suspension. As a consequence of the angular momentum, the horse takes off from the hindlimbs and lands on the forelimbs. Some important mechanical characteristics of the jump, including the path of the center of gravity and the angular momentum, are established during the take-off and cannot be changed until the horse makes contact with the ground or some other object. Sometimes, horses bank a fence (push off the top of a solid fence) or make adjustments such as dropping the hindlimbs between the rails of an oxer in an attempt to compensate for a take-off that is mechanically inappropriate. The TrF makes impact first with an almost vertical orientation, quickly followed by the LdF, which has a more acute angulation to the ground (Clayton and Barlow, 1989). Both forelimbs experience high peak vertical forces as they absorb the concussion of landing. The TrF, which has a very short stance duration at landing, provides some horizontal propulsion to assist in moving the horse away from the jump, whereas the LdF reverses the direction of rotation of the trunk around the center of gravity. The trunk continues its downward trajectory as it passes over the front limbs. In the short suspension that follows landing, the hindquarters swing underneath the trunk. The TrH is placed further from the fence than the TrF but closer than the LdF (Deuel and Park 1991; Clayton and Barlow, 1989). In contrast to the fairly predictable position of the TrH, that of the LdH is quite variable. Sometimes, it lands adjacent to the TrH; other times the two hindlimbs are widely separated. The LdH placement seems to depend on the horse’s balance during landing and move-off. Stride M1 covers a short distance, but the stride rate is approximately the same as that of stride A2 (see Table 25-1). It has a distinct four-beat rhythm due to dissociation of the diagonal limbs with the LdH preceding the TrF (Clayton and Barlow, 1989). In the subsequent move-off strides, the horse re-establishes a normal stride pattern. The majority of show-jumping competitions require a minimum speed in the range of 325 to 400 meters per minute (m/min), although the average speed during a round may be considerably faster when time is a deciding factor. Heart rate recordings have shown that the exercise intensity is greater than would be expected from the average speed because large amounts of energy are expended in overcoming the body’s inertia during take-off and landing. The warmup for a show jumping competition involves a moderate exercise intensity at an average heart rate of 96 beats per minute (beats/min) (Lekeux et al., 1991), but with peak values as high as 173 beats/min (Barrey and Valette, 1993). The heart rate peaks each time the horse jumps a practice fence, and a direct correlation seems to exist between heart rate and fence height, which may be related to a faster speed of approach to the larger fences (Barrey and Valette, 1993). When the horse waits at the in-gate, the heart rate is in the range of 71 to 93 beats/min. During a competitive round, the heart rate rises steadily as the horse progresses around the course (Art et al., 1990; Lekeux et al., 1991), as shown in Figure 25-3, reaching peak values as high as 205 beats/min. The fact that the heart rates are so high confirms that show jumping is a strenuous sport despite the relatively slow average speed. It has been suggested that the energy expended by a show jumper is equivalent to that expended during galloping the same distance at a speed of 600 m/min (22 miles per hour [mph]) (Lekeux et al., 1991). The onset of blood lactate accumulation occurs at heart rates in excess of 150 to 160 beats/min (Persson, 1983), so it is not surprising that show jumping is associated with a marked elevation in blood lactate (Art et al., 1990; Covalesky et al., 1992; Lekeux et al., 1991). Significant alterations also have been recorded in the packed cell volume, which rises to as high as 60% from a resting value of around 35%, and the red blood cell count, which has been shown to increase to 9.49 × 10⁶ from a resting value of 5.8 × 10⁶ because of the ejection of red blood cells from the spleen (Barrey and Valette, 1993). A rise in plasma cortisol from a resting value of 67.6 millimoles per liter (mmol/L) to 118.7 mmol/L has been found after a show-jumping competition (Lekeux et al., 1991). Cortisol levels reflect adrenal activity and physiologic stress, and during exercise, the extent of the rise is related to the duration of the workout, the intensity of the workout, or both. The cortisol increase in show jumpers is less than in Thoroughbred racing (higher intensity exercise) or Endurance racing (longer duration exercise). During competitions, experienced jumpers have significantly smaller increases in plasma cortisol than inexperienced jumpers, suggesting that horses become conditioned to the psychological stress of the show environment (Clayton, 1989). Show jumping is associated with reductions in plasma calcium (Ca2+), chloride (Cl–), and bicarbonate (HCO3–), an increase in sodium (Na+), and no change in potassium (K+) concentrations (Art et al., 1990; Clayton, 1989). Total plasma protein increases, and this finding, together with the increased plasma Na+, is indicative of a reduction in plasma volume because of a net movement of fluid out of the extracellular compartment. Metabolic acidosis occurs because of the increased HCO3–, and this is associated with the substantial increase in lactic acid. Marked increases in the activities of lactate dehydrogenase, creatinine kinase, and aspartate aminotransferase have been found, but not in gamma glutamyl transferase following jumping competition (Art et al., 1990; Clayton, 1989 ). In show jumping (and dressage), horses reach their peak performance at approximately 10 to 16 years of age. This means that unlike in racing, the time lapse between birth and the final evaluation of the athletic capacity of the animal is very long and that substantial investment has to be made before return on it, if any, can be expected. In a long-term (5 year) study, Santamaría and coworkers (2002; 2004a; 2004b) investigated two possible cost-effective ways to raise show jumpers. The first question they asked was whether good predictors for future jumping ability could possibly be found through the analysis of jumping technique at foal age, which would make earlier selection possible. The second question was whether jumping performance could be improved by starting training much earlier than the usual age of 3 years, thus taking better profit from the time before the horse is broken. To answer these questions a cohort of 40 Warmblood foals was selected after weaning at age 6 months and divided into two groups. One group was raised in the classic way (free paddock exercise or group housing in open front stalls, depending on the season) until they were broken at age 3 years; the other group was subjected to a training program consisting of specific jumping training two times a week combined with a more general exercise regimen to ensure physical fitness for the jump training. The foals in this group started training at age 6 months and continued until age 3 years when they were joined with the other group to be broken and to receive a common exercise program to prepare for work under the saddle. After a 6-month rest period, 30 of the now 4-year-olds (15 from each group, the 5 worst horses from each group had been culled because of constraints of economy) were trained in a single group as show jumpers for an entire year. Kinematic examinations using an infra-red–based automated gait analysis system (ProReflex®, Qualisys AB, Gothenburg, Sweden) were performed at ages 6 months (Figure 25-4), 4 years, and 5 years while free jumping and at 5 years also when ridden. As an outcome parameter for jumping performance, a puissance competition was held at the end of the experiment during which horses had to jump fences up to 1.50 m; in the preceding year, they had been trained using obstacles with a maximum height of 1.20 m. At the end of the puissance competition, performance was characterized as good (faultless), moderate (able to finish the contest but with faults, refusals, or both) and bad (unable to finish the competition) (Figure 25-5).
Training show jumpers
Conformation and show jumping
Biomechanics of show jumping
Approach
Take-off
Landing
Move-off
Physiologic demands of show jumping
Predictability of jumping performance and the effect of early training on jumping ability
< div class='tao-gold-member'>
![]()
Stay updated, free articles. Join our Telegram channel

Full access? Get Clinical Tree


