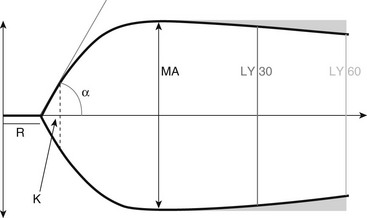
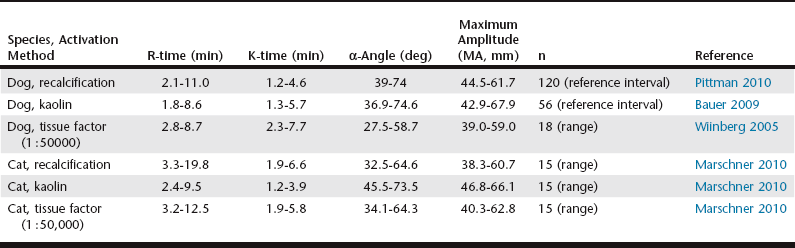
Chapter 15 The thromboelastograph generates a qualitative tracing, as well as quantitative values to describe the clot (Figure 15-1). The R-time is the time in minutes from when that blood is placed in the TEG until initial fibrin formation. Reaction time generally reflects coagulation factor levels but does not always correlate with prothrombin time (PT) and activated partial thromboplastin time (aPTT). The K-time measures in minutes the time it takes from initiation of clotting for a TEG tracing to reach a predetermined level (20 mm) of clot strength. The α-angle measures in degrees the rate of fibrin buildup and cross-linking as a function of amplitude and time. Both K-time and α-angle are affected by the availability of fibrinogen, factor XIII, and to a lesser degree platelets. The maximum amplitude (MA, measured in mm), the widest part of the TEG tracing, is a direct result of fibrin production and platelet function and represents the final clot strength. Another measure of clot firmness is the elastic shear modulus (G, in dynes/second/cm2) and is calculated from the MA using the equation: Figure 15-1 A generalized TEG tracing showing the most commonly reported values and how they relate to the tracing. R, R-time or reaction time, the time to the formation of the first fibrin strands; K, K-time, the time from the R-time until the tracing reaches 20 mm in width; Angle, α-angle, a measure of the rate of clot formation; MA, maximum amplitude, the widest part of the tracing, corresponding to the final clot strength; LY 30 and LY 60, the ratio of the amplitude at 30 and 60 minutes following the generation of MA to the MA; these parameters represent the speed of clot dissolution or fibrinolysis. In addition to clot production, the TEG also demonstrates fibrinolysis; the percent decrease in the amplitude of the tracing 30 and 60 minutes following the MA is indicated as the lysis parameters (CL 30 and LY 30 and CL 60 and LY 60, respectively, measured in %). Lysis parameters are a measure of clot stability. Table 15-1 lists normal values for TEG parameters that have been reported in the literature. TABLE 15-1 Survey of Reference Intervals or Experimental Ranges Generated for TEG in Dogs and Cats Using Various Activation Methods* *All samples rested at room temperature for 30 minutes prior to initiation of the test, with the exception of the canine kaolin–activated samples, which rested for 1 hour.
Thromboelastography
Thromboelastography
< div class='tao-gold-member'>
Thromboelastography
Only gold members can continue reading. Log In or Register to continue

Full access? Get Clinical Tree


