2 The Complete Blood Count, Bone Marrow Examination, and Blood Banking
General Comments and Selected Techniques
Complete Blood Count
This chapter discusses how conclusions are derived from information in the CBC and bone marrow examination, in addition to describing selected hematologic techniques. Explanations about interpretation are brief, because detailed discussions about the use of diagnostic tests for erythrocytes (i.e., red blood cells [RBCs]), leukocytes (i.e., white blood cells [WBCs]), and platelets are presented in Chapters 3, 4, and 5, respectively, and in other references.16 Technical comments emphasize the basic tests used in small clinics, but they may include more advanced techniques when they clearly illustrate a basic hematologic principle.
CBC results should be evaluated systematically. The first step involves identifying which test results are abnormal. Appropriate scientific terms should be used to describe the abnormalities (Box 2-1). Adjectives such as “mild, moderate, or marked” are applied to reflect the magnitude of the change, which aids in interpretation. Although these adjectives are subjectively based on clinical experience, some published guidelines are available. Greater deviations from reference values allow more confidence that the change is truly a disease change and serious than do mild deviations in results.
Box 2-1 Definition of Selected Hematologic Changes
| HEMATOLOGIC CHANGE | DEFINITION |
|---|---|
| Anemia | Decreased red blood cell (RBC) mass, clinically noted by decreased packed cell volume (PCV) |
| Polycythemia | Increased RBC mass in body (increased PCV) |
| Polychromasia | Increased number of polychromatophils |
| Poikilocytosis | Increased variation in RBC shapes |
| Microcytic | Increased number of small RBCs |
| Macrocytic | Increased number of large RBCs |
| Normocytic | RBCs are of normal size |
| Hypochromic | RBCs have lower hemoglobin (Hgb) concentration (lower mean corpuscular Hgb concentration [MCHC]) |
| Normochromic | RBCs have normal MCHC |
| Spherocytosis | Increased number of spherical (i.e., small and dense-appearing) RBCs |
| Echinocytosis | Increased number of RBCs with many spiny projections |
| Acanthocytosis | Increased number of RBCs with a few elongated, blunt projections |
| Schistocytes | Small RBC fragments |
| Rouleaux | Clumping of RBCs into linear formations resembling stacks of coins |
| Autoagglutination | Immune aggregation of RBCs into grapelike clusters |
| Heinz bodies | Precipitated Hgb resulting from oxidation |
| Thrombocytopenia | Decreased number of platelets |
| Thrombocytosis | Increased number of platelets |
| Leukocytosis | Increased number of white blood cells (WBCs) |
| Leukopenia | Decreased number of WBCs |
| Neutrophilia | Increased number of neutrophils |
| Neutropenia | Decreased number of neutrophils |
| Left shift | Increased number of immature neutrophils (nonsegs) |
| Right shift | Increased number of hypermature neutrophils (hypersegmentation) |
| Toxic neutrophils | Neutrophils with degenerative changes in their cytoplasm |
| Reactive lymphocytes | Lymphocytes with morphologic evidence of immunologic activation |
| Monocytosis | Increased number of monocytes |
| Monocytopenia | Decreased number of monocytes |
| Lymphocytosis | Increased number of lymphocytes |
| Lymphopenia | Decreased number of lymphocytes |
| Eosinophilia | Increased number of eosinophils |
| Eosinopenia | Decreased number of eosinophils |
| Basophilia | Increased number of basophils |
| Basopenia | Decreased number of basophils |
| Bicytopenia | Decrease in two cell lines (RBCs, WBCs, or platelets) |
| Pancytopenia | Decrease in three cell lines (RBCs, WBCs, and platelets) |
Test results outside reference intervals for a given species are usually considered abnormal. However, reference values are often not optimal because they are difficult and expensive to establish for each laboratory, and should be revised every time a lab changes instruments or methods. Reference intervals are usually derived from limited numbers of adult animals not segregated by age, sex, or breed (see Chapter 1). These factors can be significant. For example, a general adult reference interval for canine packed cell volume (PCV; hematocrit; Hct) is 37% to 55%. St. Bernards, however, tend to have PCVs that range from 35% to 40%, whereas the PCVs of greyhounds typically range from 52% to 60%; therefore what is normal in these two breeds hardly overlaps. Prominent age-related changes also occur. At birth, canine RBCs are very large, with a mean corpuscular volume (MCV) of about 95 femtoliters (fl). The MCV decreases to adult values by 2 to 3 months of age. At 5 to 6 weeks of age, puppies normally have a PCV around 30%, a plasma protein around 5.3 g/dl, and 3% to 4% reticulocytes. Puppy values could be confused with a regenerative, blood loss anemia if compared with adult reference intervals. Detailed references with information on breed, age, instrument, method, and other variables that affect interpretation should be on hand.16
The second step in evaluating abnormal results is to group abnormal data within the CBC. For example, a low PCV (i.e., anemia) should be linked to tests of bone marrow erythropoiesis, such as reticulocyte count and polychromasia, and observations on RBC morphology (see Chapter 3) to describe the anemia. Additionally, severe thrombocytopenia, hypoproteinemia, and icterus, often aid in diagnosis of the cause of anemia. The mental process of formulating a good description frequently suggests a diagnosis. For example, deciding an anemia is severe, erythroid regeneration is marked, and identifying moderate to many spherocytes in the smear and autoagglutination in the EDTA blood, clearly leads to a diagnosis of immune-mediated hemolytic anemia (IMHA). Total leukocyte count should be linked with the differential leukocyte count and WBC morphology (see Chapter 4). For example, severe neutropenia with more immature neutrophils than mature neutrophils and marked toxic change, usually indicates gram-negative infection or septicemia. A leukopenia with only lymphopenia and a normal number of leukocytes indicates a chronic stress/steroid process and not inflammation.
The third step in interpretation involves drawing hematologic conclusions from related sets of CBC results (Box 2-2). For example, with anemia one should determine the degree of RBC regeneration by reticulocytes and polychromasia, note RBC morphology, and consider plasma protein concentration and platelet count. If there is a deficiency of one cell type (e.g., thrombocytopenia), then one should check for leukopenia, neutropenia, and nonregenerative anemia to judge bone marrow production of all cell lines.
Box 2-2 Hematologic Conclusions That May Be Drawn from Hematologic Data
| HEMATOLOGIC CONCLUSION | HEMATOLOGIC DATA |
|---|---|
| Regenerative anemia | Anemia with appropriate reticulocytosis |
| Nonregenerative anemia | Anemia with no or insufficient reticulocytosis |
| Hemolytic anemia | Strongly regenerative anemia with additional evidence, such as hemoglobinuria, normal to high plasma protein, and one of the causes of hemolytic anemia |
| Blood loss anemia | Regenerative anemia with normal to decreased plasma protein, evidence of iron deficiency, or proof of blood loss |
| Immune-mediated hemolytic anemia | Moderate to marked spherocytosis, autoagglutination, and/or positive direct Coombs test |
| Oxidant-induced hemolytic anemia | Large numbers of Heinz bodies, eccentrocytes, or pyknocytes |
| Fragmentation anemia | Large number of keratocytes, schizocytes, or acanthocytes (dogs) |
| Iron deficiency anemia | Microcytic hypochromic anemia with variable RBC regeneration |
| Inflammation | Leukocytosis, neutrophilia, left shift, eosinophilia |
| Stress or steroid reaction | Lymphopenia and eosinopenia; often neutrophilia, and occasionally monocytosis |
| Excitement/epinephrine response | Lymphocytosis, leukocytosis, neutrophilia, and perhaps polycythemia, especially in cats |
| Toxemia | Significant number of very toxic neutrophils |
Magnitude of Hematologic Abnormalities
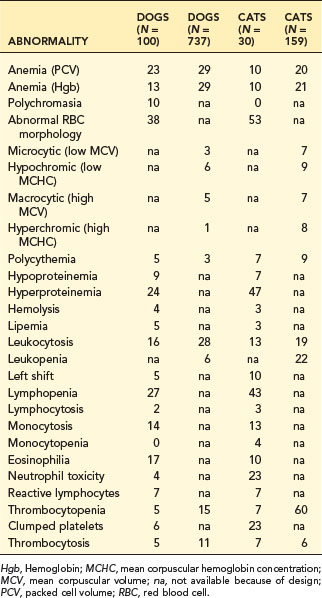
The magnitude of a change has great diagnostic significance and must be evaluated. Anemia in sick animals is often mild. For example, in Table 2-1, 29% of 737 blood samples indicated anemia; however, 55% of the anemic dogs had mild anemia (i.e., PCV 30% to 37%). Mild anemia is often not a primary hematopoietic disease but secondary to other problems such as inflammatory disease, malignancy, hepatic failure, or renal disease. Diagnostic effort should pursue the primary disease. Severe anemia (i.e., PCV <20% in dogs), however, should be evaluated as a primary hematologic problem. An exception is in pancytopenia, where life span of different cells becomes important. RBCs have a long life span compared to neutrophils and platelets, so anemia in pancytopenia can be mild or unapparent early, while neutropenia and thrombocytopenia may already be moderate to severe.
Frequency of Abnormalities
Numerous hematologic abnormalities are detected by routine CBC testing. The frequency data in Table 2-1 were from two surveys of CBC results from consecutive patients at Michigan State University. The larger survey was a computer search of quantitative values. The smaller survey was a manual search of records that included subjective observations.
Anemia occurred frequently (10% to 29% of hospital patients); thus diagnosis of the cause of anemia is important (see Chapter 3). Hyperproteinemia also is a frequent finding in dogs and cats that may be the result of dehydration, inflammation, and immune stimulation (see Chapter 12).
Left shift and leukocytosis, indicating inflammation, was moderately frequent (5% to 10%) in these hospital populations of dogs and cats. The greater frequency of toxic changes in feline neutrophils (23%) is due to the propensity of cats to form Döhle bodies (a very mild form of toxic change; see Chapter 4).
Quantitation Techniques
Sample Submission
Ethylenediaminetetraacetic acid (EDTA) is the best anticoagulant to preserve cell detail. Heparin can cause poor staining with a diffuse blue background. Formalin or formalin fumes cause poor staining of Wright-stained blood smears, resulting in a blue background. One must keep formalin away from blood and cytology smears, both in the laboratory and in packages sent to referral laboratories. Formalin fumes can affect smears without direct contact. A citrate-based anticoagulant that reduces aggregation of feline platelets (Diatube-H; Becton Dickinson, Oxford, UK) was associated with good cell detail on smears.8
Microhematocrit
PCV, hemoglobin concentration, and RBC count are equivalent methods to estimate RBC mass in the properly hydrated patient. Microhematocrit is more precise and technically easier than a manual RBC count and provides additional useful information over Hgb determination and RBC count. Gross examination of plasma in the microhematocrit tube allows detection of icterus, hemolysis, or lipemia (Figure 2-1). The microhematocrit can even be used to screen for heartworm disease, because actively moving microfilariae are concentrated in the plasma just above the buffy coat. Plasma protein concentration can be quantified using a refractometer on plasma obtained from one or two microhematocrit tubes.
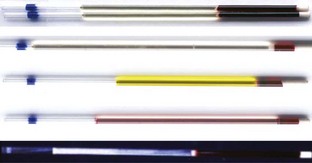
PCV is determined by centrifuging anticoagulated blood in a microcapillary tube to separate cells from plasma. Microhematocrit tubes are filled about two-thirds to three-fourths full. After centrifugation in a special microhematocrit centrifuge, RBCs are well packed at the bottom. WBCs and platelets appear as a thin white line (i.e., buffy coat) between RBCs and plasma (see Figure 2-1). The volume of blood that is packed RBCs (PCV in % or L/L) is determined. Microhematocrit tubes that contain heparin may be used for direct collection of non-anticoagulated blood. To calculate PCV, one divides the length of packed RBCs by the total length of the packed RBCs, buffy coat, and plasma. The clay plugging the bottom of the tube should not be included. Various microhematocrit reading devices are available.
Hemoglobin Concentration
Note
Under most circumstances Hgb, RBC count, and PCV are essentially equivalent measures of RBC mass.
Total Cell Counts
Hemocytometer
A hemocytometer is a transparent glass chamber that holds a cell suspension for microscopic cell counting. The hemocytometer is 0.1 mm deep and is divided into subunits by a grid with a precise 3-mm by 3-mm surface area (Figure 2-2). The surface area of the grid used in a procedure thus determines volume of the hemocytometer containing the cells counted. One can mathematically determine the number of cells in a cubic millimeter (i.e., mm3; see Figure 2-2) based on this volume. One should understand these calculations so that the hemocytometer can be used to count cells in other fluids such as cerebrospinal and synovial fluid. In the United States, cell numbers are reported in cells/µl, which equals cells/mm3. This was likely because originally cells were counted in a hemocytometer designed to represent portions as mm3. Most other countries report hematologic cell concentrations in cells × 109/L. A liter contains 1 million (106) µl; therefore a liter would have a million times more cells than 1 µl (see Chapter 1).
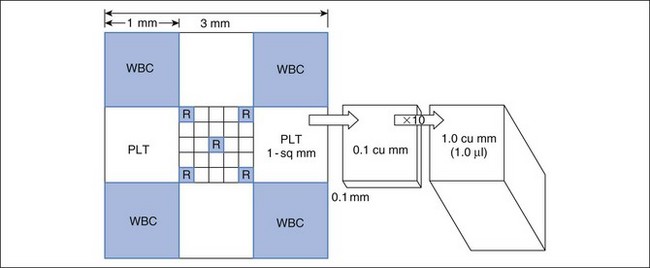
FIGURE 2-2 Dimensions of a hemocytometer. The hemocytometer grid consists of 9 mm2 and it is 0.1 mm deep. The central 1 mm2 is additionally divided into 25 squares. The areas usually used for erythrocyte, leukocyte, and platelet counts are indicated by R, WBC, and PLT, respectively. To determine the cells in 1 mm3 (which is equal to 1 µl), conversion factors for RBCs, WBCs, and platelets are listed in Table 2-2.
The blood (or other fluid) must be diluted so that the number of cells in the chamber is easy to count. A dilution system with plastic containers is easiest. Becton Dickinson (BD) discontinued the Unopette System and now recommends, as an alternative, similar products made by Bioanalytic GmbH (www.bioanalytic.de). The amount of dilution needed to provide a reasonable concentration of cells in the chamber varies with expected concentration of cells in blood (or other fluids such as abdominal fluid). Erythrocytes in blood are very numerous, so blood is greatly diluted (e.g., 1 : 200). Note that manual RBC counts are so inaccurate and time consuming that a manual RBC count is not recommended. A microhematocrit is more practical if one does not have an automated hematology instrument. A microhematocrit is even useful for bloody fluids such as abdominal fluid to estimate the amount of hemorrhage. WBC dilution is usually 1 : 20 and platelets are diluted 1 : 100. The reciprocal of the dilution (i.e., 1/dilution) is used in calculation of the final conversion factor (Table 2-2).
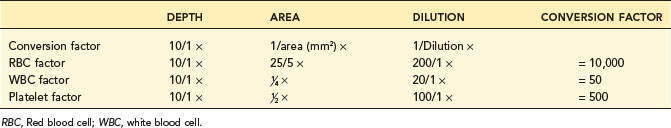
The portion of grid in which cells are counted varies for each cell type and even type of counting chamber. For WBC counts in the United States, the outer four squares are counted (see Figure 2-2). For platelets, two squares (2 mm2) are counted. The reciprocal of the area is used in calculating the final conversion factor. Because the hemocytometer is only 0.1 mm deep, counting 1 mm2 represents one tenth of 1 mm3.
To convert cell counts to number/mm3, cell count must be adjusted for the portion of 1 mm3 counted and the dilution of the blood sample (see Table 2-2). The WBC factor of 50 is based on adjustments for depth of the hemocytometer (0.1 mm), area counted (4 mm2), and dilution factor (1 : 20). A different factor can be determined if one chooses to vary from the standard approach.
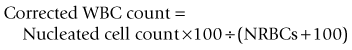
Erythrocyte Indices
Mean corpuscular volume (MCV) in femtoliters (fl):
Mean corpuscular hemoglobin (MCH) in picograms (pg):
Mean corpuscular hemoglobin concentration (MCHC) in g/dl:
Note that these mean values require a large percentage of abnormal RBCs for the MCV or MCHC to be drawn out of the reference interval. Therefore MCV and MCHC often give a misleading picture of the true presence of macrocytic hypochromic or microcytic hypochromic RBCs. For example, only 8.3% of blood samples of 6752 dogs with regenerative anemia had both increased MCV and decreased MCHC despite the fact that regenerative anemia (increased reticulocytes) is truly macrocytic and hypochromic.2 Use of MCV and MCHC usually gives the wrong morphologic classification of the animal’s anemia.
Automated Hematology Cell Counters
Impedance Counters
Platelet-erythrocyte histograms should be inspected for adequate separation between the platelet and erythrocyte peaks to avoid errors. The histogram should show two peaks and indicate which cell types were counted as platelets or RBCs by the impedance instrument (Figure 2-3). There must be a clear separation “valley” between the RBC and platelet peaks. This valley and a dashed line correctly placed between RBC and platelet peaks assures that the counts were accurate. A frequent error is that there is overlap in the size of platelets and RBCs so that the instrument cannot correctly determine the division between them.
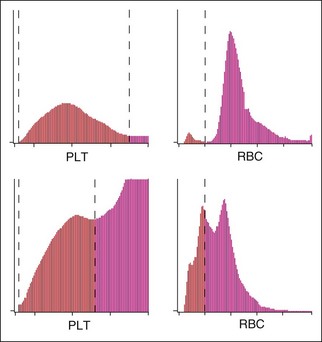
Newer impedance instruments provide additional information, such as three to four cell differential leukocyte counts, mean platelet volume (MPV), platelet distribution width (PDW), and reticulocyte count, and they may identify the presence of NRBCs.4
Laser Light Scatter Cell Counters
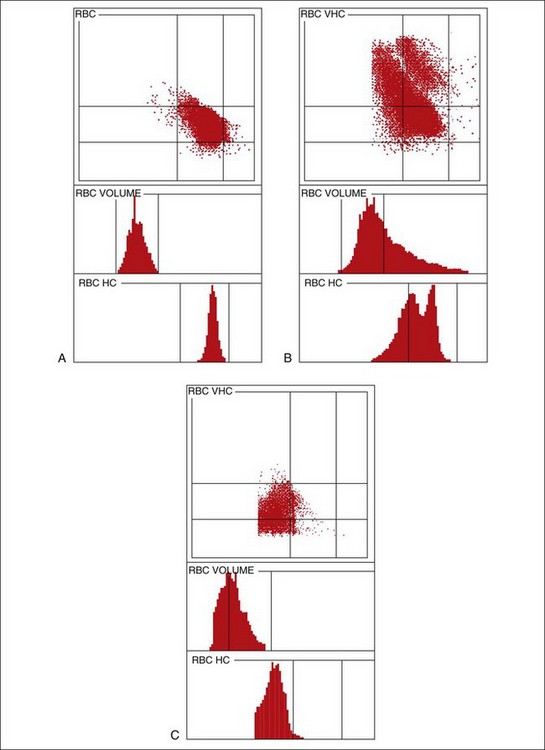
Newer automated hematology analyzers often use a laser detection system in a flow cytometer to measure size and internal complexity of cells based on light scatter at different angles.7 Stains are added to help differentiate types of leukocytes or reticulocytes. Two veterinary instruments designed for large referral laboratories are the Advia 120/2120 (previously the H-1; Siemens Medical Solutions) and the Sysmex XT-2000iV (Sysmex Corporation, Kobe, Japan). The Sysmex reports both laser (optical; PLT-O) and impedance (PLT-I) platelet counts. These newer instruments provide abundant information about each cell type. The RDW numerically describes the variability in RBC size (anisocytosis), and the hemoglobin distribution width (HDW) describes variability in Hgb concentration (see Chapter 3). Tvedten prefers interpreting the morphology of the graphics rather than many numerical results such as RDW, HDW, and several others.
Graphic displays of cells aid in diagnosis and detection of laboratory errors.13 The Advia measures and reports the volume and Hgb content of each erythrocyte analyzed (Figures 2-4 and 2-5). The Advia system is the most sensitive and specific way to correctly classify anemia as normocytic normochromic, macrocytic hypochromic, or microcytic hypochromic. As described in RBC indices, the use of MCV and MCHC more often gives an incorrect classification than the true type of anemia. RBC cytograms illustrate normal and abnormal RBC populations based on cell size and Hgb concentration. The Advia 120/2120 automated reticulocyte analysis provides not only the absolute and relative reticulocyte counts but even mean reticulocyte volume, which may aid in judging the response of a dog with iron deficiency to treatment. The color-coded reticulocyte graphics in Figure 2-5 show at a glance that the anemia in the dog was clearly regenerative. Advia 120/2120 and Sysmex XT-2000iV reticulocyte analysis works well for canine reticulocytes. The Advia and Sysmex instruments detect mainly the aggregate-type feline reticulocyte but do not detect even great changes in punctate reticulocytes.
Stay updated, free articles. Join our Telegram channel

Full access? Get Clinical Tree


