Practical Pharmacokinetics of Anesthetic Drugs
Physiologic Concepts
Following the administration of a drug formulation to an animal, blood and tissue concentrations change over time as a result of three processes: (1) absorption, (2) distribution, and (3) elimination (Figure 43-1). These processes occur simultaneously, with each dominating at a different time following administration. Initially, absorption dominates, adding drug to the body and resulting in rising drug concentrations in blood and other tissues. Later, distribution and elimination dominate, with both removing the drug from the systemic circulation, resulting in decreasing blood concentrations and ultimately subsiding effect(s).
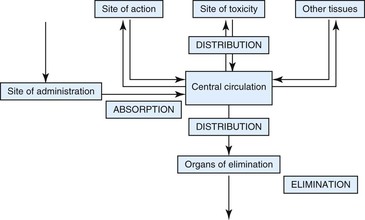
Figure 43-1 Schematic representation of pharmacokinetic processes responsible for changing plasma drug concentrations.
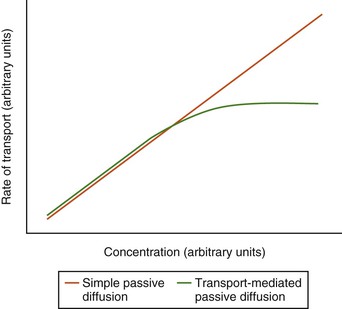
Absorption, distribution, and elimination require that drug molecules be transported across a series of membranes and spaces. In addition, elimination may require that the drug be metabolized. Differences in the rates of these processes result in variations in the time–concentration profiles observed for different drugs and animals. The barriers across which drugs must move are composed of lipophilic cellular membranes, aqueous interstitial spaces, and, in some membranes (e.g., capillary endothelia and intestinal epithelia), narrow aqueous-filled channels between cells. Most drugs pass through these membranes by simple diffusion from areas of higher concentration to areas of lower concentration. The rate of drug penetration is, therefore, determined by the magnitude of the concentration difference across the membrane, the surface area of the membrane, and the ease with which the drug can penetrate through the membrane. The last is quantitatively expressed as permeability, which is affected by the molecular size, lipophilicity, and the charge of the drug. Active and passive carrier-mediated transport processes may be involved for some drugs, resulting in the rate of transport approaching a maximum value at high concentrations (Figure 43-2). Since saturation of active transport processes is uncommon at concentrations typically used for treatment, this phenomenon will not be considered further for the purposes of this chapter.
Pharmacokinetic Parameters and Dosage Regimens
A parameter may be defined as a quantifiable characteristic of a system that is used as input for a predictive model. In pharmacokinetic modeling, parameters are quantitative estimates of the rate and extent of distribution, elimination, and absorption, which are used to predict plasma drug concentrations for specific drug dosages in individuals or groups of animals. These pharmacokinetic parameters are estimated by fitting a pharmacokinetic model to observed data and are then used to construct dosage regimens that will achieve a specified target plasma concentration. Examples of target concentrations include the minimum inhibitory concentration (MIC) (or a multiple thereof) for antimicrobial drugs or, in the case of drugs used to induce anesthesia, concentrations associated with the desired depth and duration of anesthesia.
Single Intravenous Dose
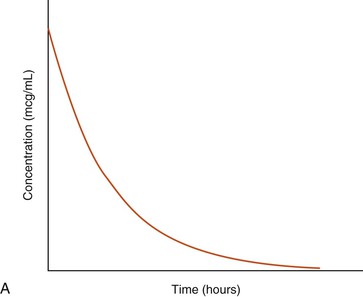
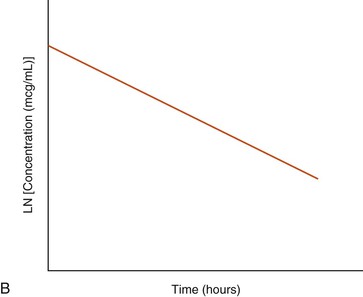
A graphic representation of the time–concentration data for a hypothetical drug following IV administration is shown in Figure 43-3. Note that the relationship between the x (time) and y (concentration) variables becomes linear if the y-axis is transformed to a logarithmic scale. Also, note that the concentration declines over time at a constant rate (see Figure 43-3). The data may, therefore, be described using a simple monoexponential mathematic equation that is conventionally referred to as a one-compartment pharmacokinetic model (see Equation 1). Drugs that can be described using a one-compartment model typically equilibrate rapidly between blood and tissues. This makes it possible to describe their disposition as the drug being injected into a single compartment of uniform liquid with the dose distributing instantaneously and homogeneously throughout this compartment and the drug being eliminated from the compartment immediately after injection.
Stay updated, free articles. Join our Telegram channel

Full access? Get Clinical Tree


