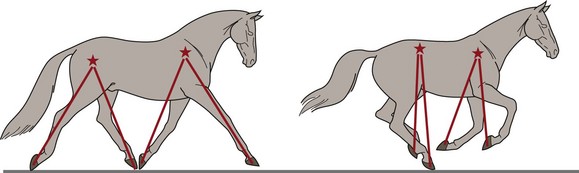
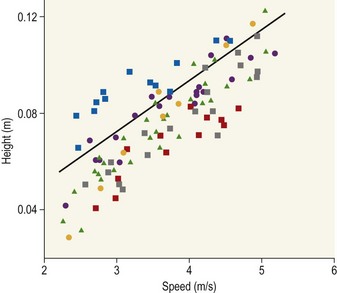
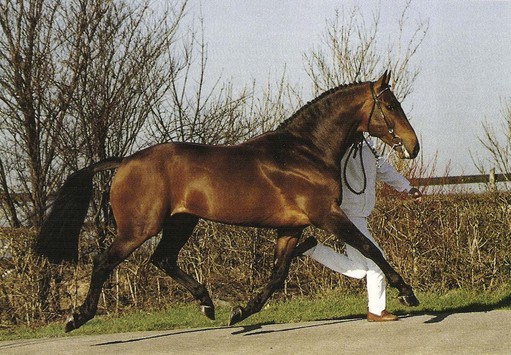
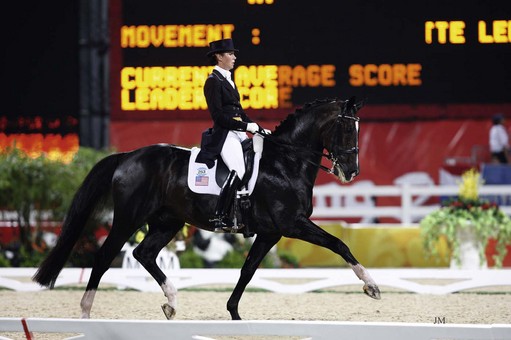
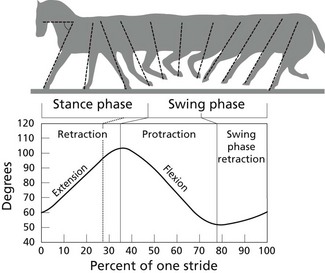
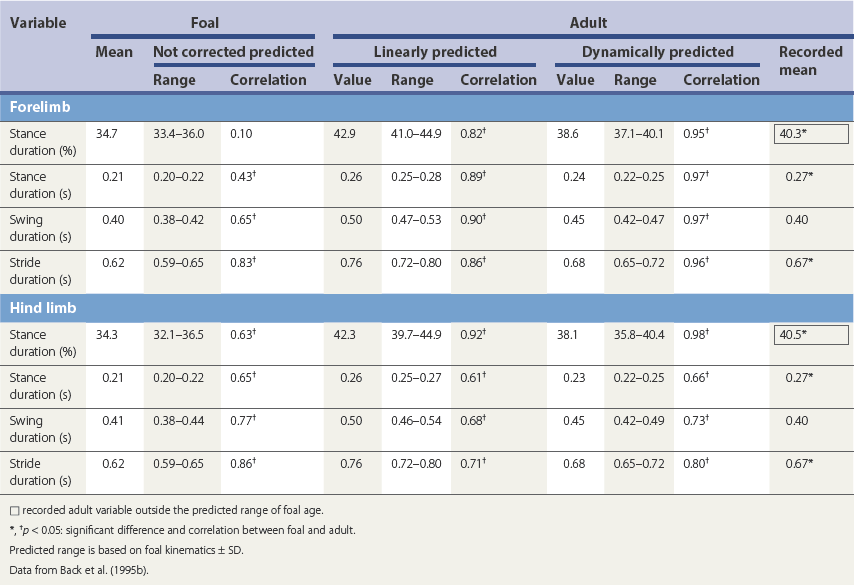
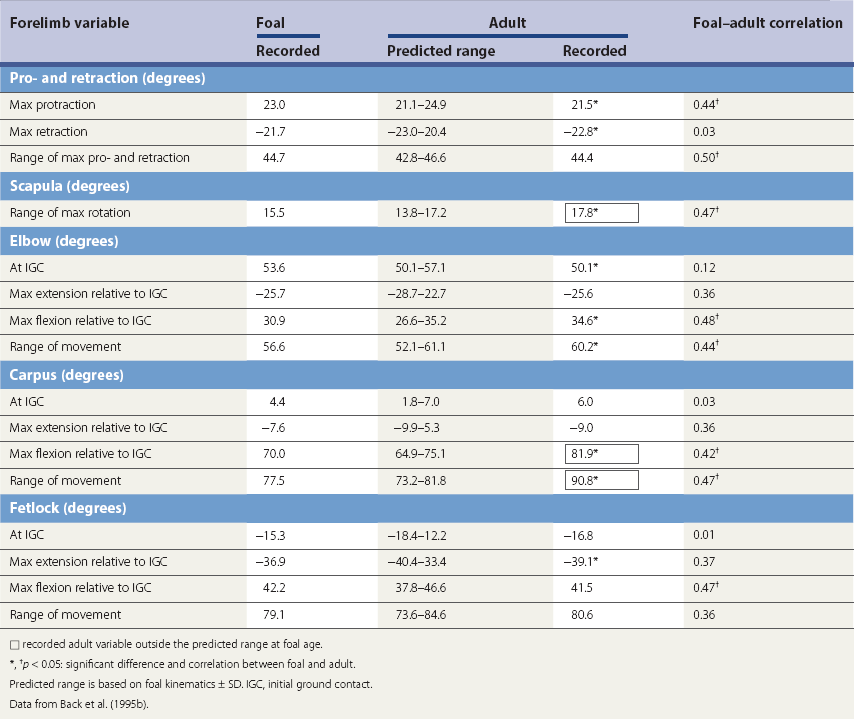
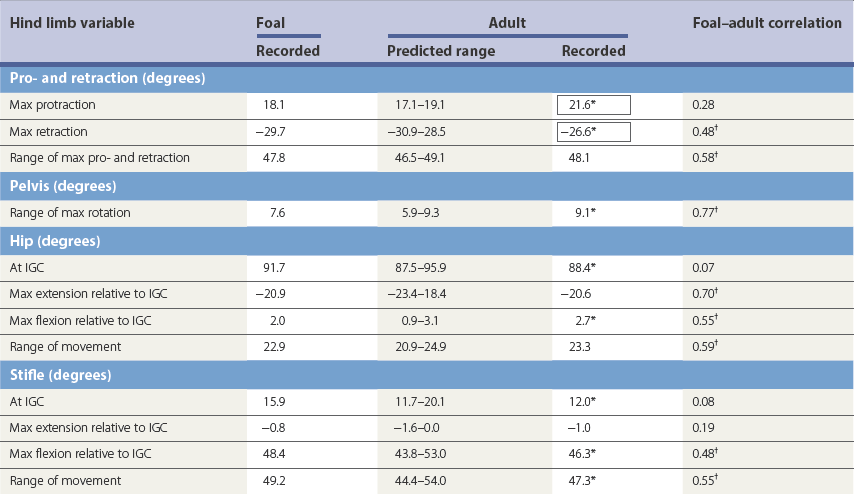
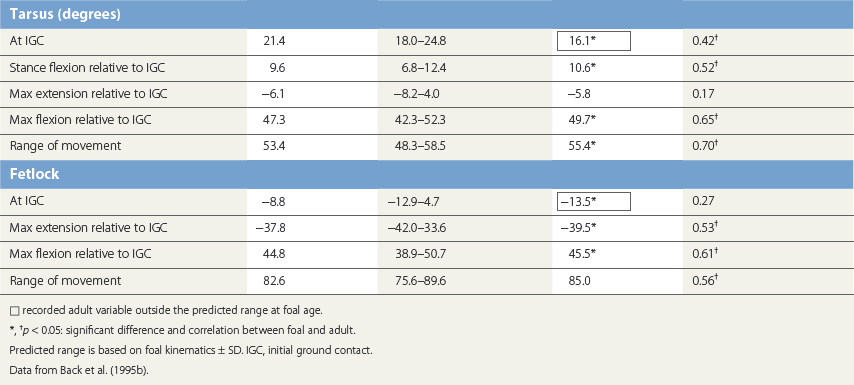
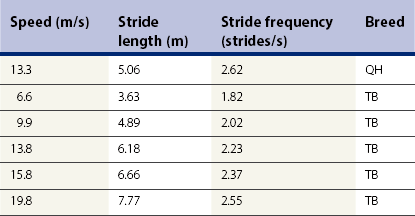
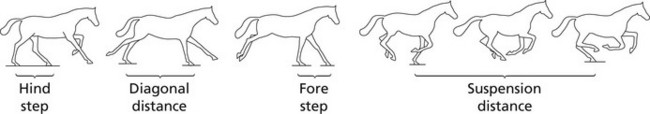
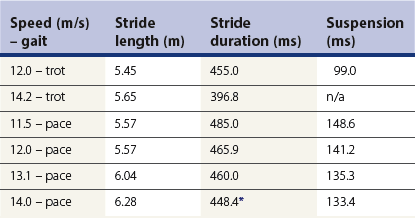
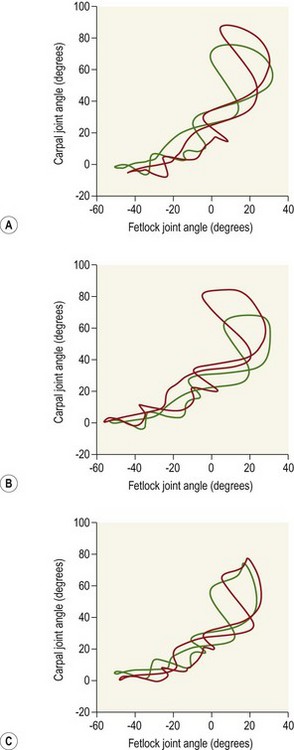
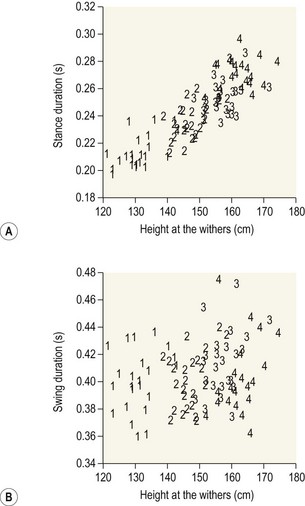
Chapter 14 Speed is the determining factor in racing, and is also a desirable characteristic in many other sports. Horses change speed by altering the spatial and temporal relationships between the limbs to produce different gaits and to vary the extension within a gait. Each horse has an optimal speed within a gait at which the metabolic cost is minimized; slower and faster speeds both result in a higher metabolic cost (Hoyt & Taylor, 1981). It has been suggested that transitions between gaits may be triggered by energetic cost (Hoyt & Taylor, 1981) or musculoskeletal forces (Farley & Taylor, 1991). Whatever the reason, horses naturally select particular speeds at which to make transitions between gaits. Within any gait, speed is the product of stride length and stride frequency. In sprinting races, a high stride frequency is the prime requirement; the ability to take longer strides becomes increasingly important as the distance of the race increases (Deuel & Park, 1990). Stride length has been reported to show a rapid and fairly linear increase with speed, whereas stride frequency increased more slowly and in a non-linear manner (Dušek et al., 1970; Leach & Cymbaluk, 1986). In Thoroughbreds galloping at 13.7–19.8 m/s which is approaching maximal speed, Seder and Vickery (2003) reported a linear increases in stride length and stride frequency. Stride length increases with effective limb length. The forelimbs are generally considered to rotate around a point close to the tuber spinae scapulae and the attachment of serratus ventralis, though the precise point of rotation may vary between individuals. The hind limbs rotate around the hip joint in the symmetrical gaits (walk, trot, pace) and around the lumbosacral joint in the asymmetrical gaits (canter, gallop). The advantage of moving the rotation point to the lumbosacral joint is that it increases the effective limb length (Fig. 14.1). Interestingly, a necropsy study showed that 32% of Thoroughbreds had maximal range of motion in flexion–extension at the joint between the fifth and sixth lumbar vertebrae rather than at the lumbosacral joint, and 8% had evidence of sacralization of the sixth lumbar vertebra (Stubbs et al., 2006). Moving the effective lumbosacral articulation more cranially might confer an advantage in terms of further lengthening the hind limb. In the symmetrical gaits, particularly the walk, lateral bending of the vertebral column may enhance stride length, whereas in the asymmetrical gaits dorsoventral flexion and extension make a larger contribution to stride length (Hildebrand, 1962). In horses, the thoracolumbar spine is fairly rigid to provide support for the large body mass and facilitate transmission of propulsive forces from the hind limbs. The need for spinal stability is a priority in gaits that have a suspension phase, which include the racing trot, pace and gallop. Thus, the need for stabilization predominates and intervertebral motion makes a relatively small contribution to stride length in racehorses with the exception of the lumbosacral joint. This is in contrast to smaller animals, such as cats, that make use of a more flexible thoracolumbar spine to increase stride length. For more information on vertebral kinematics, the reader is referred to the chapter on neck and back movements (Chapter 10). Stride frequency describes the rate at which the limbs are protracted and retracted. The ability to cycle the limbs rapidly is favored by having a high percentage of fast-twitch fibers in the extrinsic muscles, which influences both the rapidity with which the limbs are moved and the ability to generate large forces and impulses during the stance phase. Stance duration is negatively correlated with the diameter of the muscle fibers (Rivero & Clayton, 1996), whereas stride length is positively correlated with the percentages of type I and type IIa muscle fibers, and negatively correlated with the percentage of type IIb muscle fibers in Standardbreds. Stride frequency is positively correlated with the percentage of type IIa muscle fibers (Persson et al., 1991). Stance duration has a negative correlation with the percentage of type IIb muscle fibers (Roneus et al., 1995) that is indicative of an ability to generate high ground reaction forces (GRFs) and so create the necessary impulse over a shorter period of time. During locomotion, energy is used to move the horse’s center of mass and to cycle the limbs back and forth. For sprint races, energy expenditure is relatively unimportant, but as race distance increases beyond the capacity of the anaerobic energy production systems, energetic efficiency has a greater effect on the ability to maintain submaximal speed over a distance. Factors that contribute to locomotor economy include the masses and inertial properties of the limb segments, kinematics, storage and release of elastic strain energy and inter-segmental transfers of kinetic energy (Cavagna et al., 1977). Protraction and retraction of the limbs uses energy and several mechanisms are employed to improve energetic efficiency. The limb is folded during protraction, which brings the distal limb closer to the pivot point, thereby reducing its inertia. The amount of joint flexion and limb folding increase with speed with a consequently higher hoof flight arc (Clayton et al., 2002) (Fig. 14.2). Storage and release of elastic strain energy greatly reduce the metabolic energy requirement (Alexander, 2002). In the first half of the stance phase, the elastic elements are stretched, thereby storing elastic energy. As the body mass rolls over the limb, the elastic tissues recoil, releasing the stored elastic energy, which assists in protracting (e.g. biceps brachii) and raising (e.g. superficial digital flexor tendon) the limb. During trotting the fetlock, carpal, elbow and shoulder joints show elastic behavior in the soft tissues that cross these joints (Clayton et al., 1998). The elastic contributions are relatively small at the walk (Clayton et al., 2000) but are much larger during trotting and in cantering and galloping. In the asymmetrical gaits, the elastic lumbodorsal fascia may also contribute to gait efficiency through elastic energy storage and release as the spine flexes and extends (Minetti et al., 1999). The Quarter Horse is the elite equine sprinter and was named for its ability to sprint over a distance of a quarter mile. The most important qualities of a sprinter are rapid acceleration and a high maximal speed. In sprinters speed is more strongly influenced by stride frequency than stride length (Deuel & Lawrence, 1986). This is in contrast to middle distance Thoroughbreds in which speed is altered primarily by changes in stride length (Ratzlaff et al., 1985). Comparing Quarter Horses and Thoroughbreds galloping at 15 m/s, the stride length of the Quarter Horses is shorter by 1.0–2.0 m (Deuel & Lawrence, 1986), with a correspondingly higher stride frequency. The stride variables of 2-year-old Quarter Horse fillies galloping at a mean speed of 13.3 m/s are shown in Table 14.1. Table 14.1 Mean values for stride variables of galloping Quarter Horses (QH) and Thoroughbreds (TB) Data for Quarter Horses from Deuel and Lawrence (1986) and data for Thoroughbreds are from Ischii et al. (1989) and Seder and Vickery (2003). There is no significant covariance between stride frequency and stride length in galloping Quarter Horses, so these variables are regarded as independent factors within the time domain and space domain (Deuel & Lawrence, 1986). As speed increases, stride frequency is increased by shortening the single support periods of the trailing hind limb and leading forelimb, and the duration of the suspension. Linear regression analysis of the data predicts that at 14.9 m/s, overlap between the leading hind limb and trailing forelimb approaches zero. Interestingly, at approximately this speed, two of four horses in the study showed strides with an extended suspension (i.e. a period of suspension between lift-off of the leading hind limb and ground contact of the trailing forelimb) of 4.0–8.0 ms duration (Deuel & Lawrence, 1986). At a constant stride frequency, stride length is adjusted by increasing the distances between footfalls of the trailing and leading forelimbs and between the leading forelimb and the trailing hind limb. In Quarter Horse foals there is a significant correlation between stride length and mass (Leach & Cymbaluk, 1986). Small foals prefer to change speed by adjusting stride length, whereas foals with larger dimensions prefer to adjust their stride frequency. Two-year-old Quarter Horse fillies show a leading limb preference; approximately twice as many strides were recorded on the right lead versus the left lead in spite of the horses being cued for the left and right leads an equal number of times. The horses either picked up the right lead during the transition or changed from the left to the right lead (Deuel & Lawrence, 1987a). Both speed and stride length were significantly longer on the left lead than the right lead, but stride frequency did not differ between the two leads. The trailing forelimb had a longer stance duration and a shorter period of overlap with the leading forelimb on the left lead, which was interpreted as a sign of an increased reliance on the right forelimb for support. The hind limbs, however, did not show any linear or temporal asymmetries between the left and right leads. The effect of urging by the rider was studied by having the rider use a whip on the shoulder of the leading forelimb in rhythm with the stride. Use of the whip did not change the speed, but the horses maintained their speed with a reduced stride length and a higher stride frequency during urging. Also, the stance duration of the forelimbs was reduced (Deuel & Lawrence, 1987b). Thoroughbreds race over short to middle distances, mostly in the range of one to two miles, though shorter and longer races exist. Over the shorter distances, the requirements for acceleration and speed are similar to those for Quarter Horse racing, but as the distance increases stamina assumes more importance. In this breed high maximal speeds are achieved primarily as a result of having a long stride length (Leach et al., 1987). Top class Thoroughbreds galloping at racing speed have had their stride lengths measured at 7.38 m for Secretariat and 6.66 m for Riva Ridge (Pratt & O’Connor, 1976). However, individual horses vary in terms of their preference to increase stride length or stride frequency as they approach top speed. In general, for Thoroughbreds galloping at submaximal speeds, stride length tends to show a decreased rate of increase whereas stride frequency tends to show an increased rate of increase (Yamanobe et al., 1992). Stride lengths and stride frequencies for Thoroughbreds galloping at a range of speeds are shown in Table 14.1 (Ishii et al., 1989). A study of part-Thoroughbred horses galloping on a variety of surfaces (sand, turf, woodchips, dirt) showed a linear relationship between stride length and speed, with stride length increasing from about 3.5 m at 6 m/s to around 7.5 m at 19 m/s. At the same time, stride duration decreased from 580 ms at 6 m/s to 440 ms at 19 m/s. The reduction in stride frequency was achieved through a large reduction in the swing phase from 200 to 100 ms, and a smaller reduction in the stance phase from 400 to 350 ms (Hellander et al., 1983). Stride length at the gallop comprises the sum of four inter-limb distances: the hind step, the diagonal step, the fore step and the suspension distance (Fig. 14.3). Alterations in stride length are associated with greater changes in the diagonal distance and the suspension distance than in the hind and fore steps (Ishii et al., 1989). The suspension distance shows the greatest increase at moderate speeds but has a tendency to level off as maximal speed is approached, whereas the diagonal step shows an increasing rate of increase at higher speeds. Lengthening of the diagonal step is a consequence of an increased propulsive force from the hind limbs but there may be an associated increase in forelimb braking force, which, in turn, limits the suspension distance (Yamanobe et al., 1992). Fig 14.3 Interlimb distances in the gallop. The sum of the interlimb distances is the stride length. The temporal variables for the gallop stride include periods of single support when one limb only is in the stance phase, periods of overlap when two or more limbs are in the stance phase simultaneously and one or more suspension phases when the horse is airborne. Duration of the suspension phase is highly correlated with stride duration. For Thoroughbreds galloping at 15 m/s, the suspension phase occupies 28% of stride duration (Leach et al., 1987). The stance phase durations of the four limbs differ significantly from each other, with the leading hind limb and trailing forelimb having shorter stance durations than the contralateral limbs. Overlap is longest between the two hind limbs, shortest between the two forelimbs, and of intermediate duration between the leading hind-trailing forelimb pair. As galloping speed increases there is a marked reduction in all the overlap durations, with overlap between the leading hind and trailing forelimbs decreasing linearly down to about 50 ms (Hellander et al., 1983). Comparison between the extended canter of horses trained for dressage with horses trained for racing reveals that, at the same speed, there is no difference in stride length or stride frequency, but the racehorses had significantly shorter stance durations and overlap times (Clayton, 1993), which may be a consequence of race training. Following 8 weeks of high-intensity training on a treadmill, the stance duration of galloping Thoroughbreds was reduced by 8–20% (Corley & Goodship, 1994). These changes can be ascribed to greater muscular strength; the ability to generate higher ground reaction forces allows the necessary impulses to be created during a shorter stance phase, and the greater forces project the horse into a prolonged suspension phase. Race training also results in increases in stride duration and stride length (Leach et al., 1987). The advanced placements (time between footfalls) change in such a manner that, at faster galloping speeds, the hind limbs act more in unison with each other while becoming more dissociated from the forelimbs. Thus the rhythm becomes more like a rabbit hop. As the advanced placement between the leading hind and the trailing forelimbs increases, the distance between placements of these limbs also increases. Dissociation of the actions of the hind limbs and forelimbs causes a greater reliance on spinal flexion and extension. Thoroughbreds traveling at speeds greater than 13.5 m/s may show a short extended suspension between lift-off of the leading hind limb and contact of the trailing forelimb. A third suspension, between lift-off of the trailing forelimb and contact of the leading forelimb, has also been recorded occasionally. The percentage of Thoroughbreds showing multiple suspension phases increases with speed from 27% of horses at 15.5 m/s, to 50% at 17.0 m/s, and 70% at 19.5 m/s. The duration of these suspension phases also tends to increase with speed (Seder & Vickery, 2003). The head and neck, which comprise approximately 10% of body weight, move in synchrony with the limbs. The neck is actively extended and lowered during the hind limb stance phases with the head reaching its lowest point during the propulsive phase of the leading hind limb (Bramble, 1984). This movement may counteract the tendency of the forequarters to rise as a result of hind limb propulsion (Pratt, 1983). Elevation of the head and neck begins as the trailing forelimb contacts the ground, continues through the forelimb stance phases and peaks at lift-off of the leading forelimb. During acceleration, the initial increase in speed is due to a rapid increase in stride frequency accompanied by a relatively slow increase in stride length (Hiraga et al., 1994). Stride frequency peaks within a few strides after leaving the starting gate, whereas stride length requires 25–30 strides to reach its maximal value. The diagonal distance increases relatively rapidly to reach maximal length within the first few strides. The airborne distance increases linearly after the first few strides until the 20th stride. Forelimb step length and the hind limb step length tend to level off after the 20th stride. Hind step length is very short in the initial strides during which the horses use a half bound before establishing a leading limb for the hind limb pair. The majority of horses use a rotary sequence of limb placements (crossed lead) during the initial acceleration before establishing the normal transverse sequence (Kai & Kubo, 1993; Hiraga et al., 1994). Horses tend to hold their breath for 3–4 s immediately after leaving the starting gate after which they settle into a breathing rhythm that is synchronized with the stride cycle (Kai & Kubo, 1993). Vertical ground reaction forces have been studied at racing speed in horses galloping round a 0.8-km track with well-banked turns and wearing instrumented shoes on all four feet (Ratzlaff et al., 1987). On the straightaway the greatest vertical force was exerted by the leading forelimb, followed by the leading hind limb, trailing hind limb and trailing forelimb. On the banked turns, the greatest vertical force was exerted on the leading forelimb, followed by the trailing forelimb, leading hind limb and trailing hind limb. It is not surprising, therefore, that the majority of racing injuries occur in the leading limbs, especially the leading forelimb. An early modeling study indicated that each forelimb would support 170% body weight when galloping at 14 m/s (Kingsbury et al., 1978). Subsequent modeling studies, however, have estimated widely different forces in the superficial and deep digital flexor tendons (Brown et al., 2003; Swanstrom et al., 2005b). A detailed musculoskeletal model for dynamic simulation of the Thoroughbred forelimb during the stance phase when galloping at 18 m/s (Swanstrom et al., 2005a) indicated peak vertical ground reaction force of 210% body weight combined with longitudinal forces of 30% body weight (braking) and 63% body weight (propulsion). This model also predicted palmar flexion angles of 148° for the distal interphalangeal joint and 169° for the proximal interphalangeal joint during the first one third of stance and 262° for the metacarpophlangeal joint just before midstance. Angular ranges of motion for these joints were 50° (distal interphalangeal joint), 16° (proximal interphalangeal joint) and 54° (metacarpophalangeal joint). Peak strains in the superficial digital flexor tendon (4.9%) and suspensory ligament (8.5%) occurred prior to midstance, whereas strains in the deep digital flexor tendon (2.8%) and the accessory ligament of the superficial digital flexor tendon (8.8%) peaked around midstance. The accessory ligament of the deep digital flexor tendon had peak strain of 7.1% around the start of breakover. Transection of the accessory ligament of the superficial digital flexor tendon, which is used to treat superficial digital flexor tendonitis, resulted in increased force and strain in other soft tissues, increases in metacarpophalangeal joint extension and distal interphalangeal joint flexion, and a reduction in ground reaction force (Swanstrom et al., 2005a). Fatigue implies a decrement in performance shown by reductions in stride frequency and running speed. Stride length may increase or decrease depending on the horse. The absolute duration of both the stance and suspension phases of the stride increases, with suspension occupying a greater percentage of stride duration. Footfall of the leading hind is followed more closely by that of the trailing forelimb, and overlap between these two limbs increases during fatigue (Leach & Sprigings, 1979). Since the stride and respiratory cycles are synchronized in galloping horses, it has been suggested that the changes in limb coordination associated with fatigue may be related to the respiratory demands. Prolongation of the suspension phase increases the duration of the inspiratory phase of the respiratory cycle, which may be advantageous as the horse becomes fatigued (Leach & Sprigings, 1979). Analysis of racetrack patrol videos (Ueda et al., 1993) has shown that breakdown injuries often occur immediately after a lead change (47% cases), use of the whip (38% cases) or an oblique movement of the horse across the track (21% cases). An important consideration in Thoroughbred training is the need to stimulate skeletal adaptation without causing injury to the bones and joints. It has been suggested that the training regime should incorporate short sprints on a relatively frequent basis (every 3–6 days) to stimulate bone adaptation, especially with regard to the prevention of bucked shins (Moyer & Fisher, 1991). However, the distance of the sprints must be limited because horses that accumulate extensive distances at high speeds are more likely to suffer a fatal skeletal injury (Estberg et al., 1995). Many complete fractures of the long bones are preceded by incomplete fractures (Stover et al., 1992) indicating that they are a consequence of repeated limb trauma during training and racing. Material properties of the track surface affect both performance and lameness. On a harder surface there is a reduction in stride duration, whereas on a more compliant surface stride duration increases (Fredricson et al., 1983). This offers at least a partial explanation for the fact that faster race times are recorded on firmer track surfaces. However, there is a price to pay in terms of soundness. The incidence of lameness in Thoroughbreds that are in race training increases with the hardness of the track surface (Cheney et al., 1973). One of the factors that affect hardness is the composition and depth of the cushion. Hardness is reduced as the cushion gets deeper, but if the cushion depth is too deep (greater than 10 cm), the footing becomes insecure. Surface moisture content tends to vary, whereas the moisture content of the compacted cushion is more constant (Clanton et al., 1991). There also tended to be more compaction around the starting chutes than in other areas of the track. Next to the rail, track surface was softer than the surface toward the middle of the track. Dynamic properties of the track, such as hardness, rebound, deceleration rate, rebound rate and penetration, can be assessed with a track-testing instrument. Accelerometers have been attached to the hoof wall for dynamic testing of the track surface (Barrey et al., 1991; Ratzlaff et al., 2005). Lower peak acceleration of the hoof, which increases locomotor efficiency by allowing a smoother transition from braking to propulsion, is achieved by having a deeper cushion or by reducing the dry density of the cushion (Ratzlaff et al., 2005). Hoof-mounted accelerometers (Ratzlaff et al., 2005) indicate wide variations in acceleration from stride to stride on the same surface. Track surface composition and characteristics have a profound effect on the loading conditions of the horse’s limb, with the shear strength of the granular material being particularly influential. Therefore, selection of soil for structure may be more important than the addition of soil amendments that alter damping characteristics (Reiser et al., 2001). Many racing surfaces are a composite of sand, rubber granules and fibers coated with a wax. Horses trained and raced more slowly when the surface reached a temperature of 43-46 degrees at which the lower molecular weight components of the wax melt (Peterson et al., 2010). In one study, a synthetic racing surface was shown to have lower peak accelerations, mean vibrations and peak ground reaction forces than turf or dirt surface (Setterbo et al., 2009). Track maintenance also affects the mechanical properties of the track (Peterson & McIlwraith, 2008). Racing Standardbreds are divided into two groups according to the gait they perform during racing. The tendency to trot, in which the diagonally opposite limb pairs move together, or to pace, in which the lateral pair of limbs move together, has been shown to be genetically determined (Andersson et al., 2012). The offspring of pacers almost always pace, whereas about 20% of the offspring of trotters are pacers (Cothran et al., 1987). A good trotter should have a high maximal speed with a stride frequency in excess of 2.4 strides/s and a stride length greater than 5.45 m. It has been suggested that trotters achieve a high racing speed by selecting an optimal stride length then accelerating to the wire by increasing their stride frequency (Barrey et al., 1995). Different studies vary in their findings regarding the relationship between speed, stride length and stride frequency. Barrey et al. (1995) found that both stride length and stride frequency increase linearly with speed, whereas Drevemo et al. (1980a) found speed to be moderately correlated with stride length but not correlated with stride duration. The latter study also found a close correlation between stride duration and swing duration. Swing duration, which occupied about 75% stride, had much more effect on overall stride duration than stance duration, which occupied only about 25% of stride. The treadmill study of Weeren et al. (1993) also found that stride length contributes more than stride frequency to an increase in speed, with the swing duration remaining constant at all speeds. The temporal and linear stride variables of 30 Standardbreds trotting on a racetrack were studied using a camera car driven parallel to the horse as a pacemaker (Drevemo et al., 1980a). With the pacemaker car moving at 12 m/s, the actual speed of the individual strides varied from 11.3 to 12.4 m/s. The values of the stride variables are shown in Table 14.2. There was very little intra-individual variation (Drevemo et al., 1980b; Kobluk et al., 1989), indicating that each horse has a stable locomotion pattern that is repeated regularly with only minor deviations. The variation between individuals was two to three times greater than that within horses. Depending on the variable being studied, the coefficients of variation were of the order of 8–12%, though the variability within horses was about 60% less than that between horses. Table 14.2 Mean values for stride variables of Standardbred trotters and pacers *In the original paper the stride duration is given as 499.4 ms, and the stride frequency is 2.23 strides/s. Apparently, the value for the stride duration is a typographical error. Data for trotters moving at 12.0 m/s from Drevemo et al. (1980a and 1980b) and at 14.2 m/s from Barrey et al. (1995). Data for pacers from Wilson et al. (1988b). Good trotters show a short stance phase duration, especially in the forelimbs (Bayer, 1973). The stance phase has been subdivided at the instant when the metacarpus is vertical in the forelimbs or when the hoof is vertically beneath the hip joint in the hind limbs (Drevemo et al., 1980a). The early part was named the restraint phase and the later part was named the propulsion phase. Although the names suggest that these terms define functional phases of the stride, it should be noted that they are defined kinematically and so the implied functional relationship to the longitudinal ground reaction forces is an approximation only. Using this definition, the restraint phase accounts for the initial 40–45% stance, and is slightly longer in the hind limbs than in the forelimbs. The propulsive phase is significantly longer in the right hind than in the other limbs, which has been interpreted as an indication of sidedness. The duration of the forelimb propulsive phase is negatively correlated with speed. Diagonal dissociation is a term that encompasses the dissociation of the diagonal pair at contact with the ground (diagonal advanced placement) and at lift-off (diagonal advanced completion). Dissociation of the movements of the diagonal pair of limbs results in a short period of single support between the periods of bipedal support and periods of suspension. Duration of the diagonal dissociation is significantly longer at lift-off than at contact, with the forelimb acting in advance of the hind limb both at contact and lift-off in the majority of horses. For a given diagonal, the duration of the dissociation at contact and lift-off are highly correlated. When the forelimb precedes the hind limb, diagonal advanced placement is inversely correlated with the distance between the diagonal limb pair during bipedal support (diagonal length). When the hind limb precedes the forelimb, the diagonal advanced placement is directly correlated with the diagonal distance (Drevemo et al., 1980b). About 25% of trotters showed highly significant differences between the left and right diagonal dissociations. The mean duration of diagonal limb support at a speed of 12 m/s was 99 ms, with highly significant differences between the left and right diagonals in four out of 30 horses. Diagonal length, which is the distance between the diagonal limb pair during their stance phase, had a high coefficient of variation on the right diagonal, and the values for the left and right diagonals differed significantly in five out of 30 horses. The mean duration of the suspension phase was 99 ms, with 66% of the horses showing no significant difference between the left and right sides. The left and right suspensions were strongly correlated with the length and duration of the left and right hind steps, respectively. There was also a moderate correlation between suspension and stride duration (Drevemo et al., 1980b). For Standardbreds trotting on a treadmill, the swing phase trajectories of the fore hooves are quite different from those of the hind hooves. The fore hooves are lifted higher but show less lateral deviation than the hind hooves in which the limbs swing wide to avoid interference. The hoof movements as seen in the frontal plane seem to be characteristic of the individual animal (Weeren et al., 1993). Drevemo et al. (1987) analyzed temporal kinematic variables in ten Standardbreds trotting at 4 m/s on a treadmill at the ages of 8, 12 and 18 months. After scaling the data to height at the withers, a decrease in relative stride length was found. The kinematic stride variables of trotting Standardbreds show good reproducibility in the short term during both overground (Drevemo et al., 1980c) and treadmill (Weeren et al., 1993) locomotion. A 5-month training period did not result in any significant changes in temporal parameters, but other aspects of the stride kinematics did change. In the forelimb there was more flexion of the elbow, more overextension of the carpus and a decrease in fetlock flexion after training. In the hind limb there was an increase in overextension of the fetlock (Weeren et al., 1993). A longer training period of 3 years was associated with significant increases in stride length, stride duration and swing duration. The increase in stride duration resulted almost exclusively from the longer swing duration (Drevemo et al., 1980c). The peak vertical ground reaction force in the forelimb of a Standardbred trotting at a relatively slow speed of 8 m/s was 99% body weight and occurred around 50% stance. The braking longitudinal force had a maximal value of 6.4% body weight at 15% stance, while the propulsive component peaked at 75% stance with a value of 9.2% body weight. The forelimb longitudinal force changed from braking to propulsive around 40–50% stance (Quddus et al., 1978; Chateau et al., 2009). By definition the trot is a symmetrical gait, which implies that the movements of the left and right limbs are out of phase by 50%, with the left and right steps being equally spaced in time. In the 30 horses studied by Drevemo et al. (1980b), the kinematic variables for the entire group were symmetrical on the left and right sides. However, many individuals showed left–right asymmetries when trotting at high speeds, especially in the hind limbs. Six of 30 horses had significant asymmetries between the fore steps, while 12 out of 30 horses had significant asymmetries between the hind steps (Drevemo et al., 1980b). Some individuals had such marked asymmetries that, rather than trotting, they showed a transitional type of gait with a galloping motion of the hind limbs, which is known as the traquenard. The asymmetries detected at racing speed by slow motion analysis are often not apparent during a clinical examination when the horse trots at a slower speed. Detection is important, though, because an asymmetrical gait is thought to be associated with poor performance (Dalin et al., 1985) and the development of locomotor pathology (Rooney, 1969). Even 8-month-old Standardbreds that have not yet been trained show some differences between the kinematics of the left and right limbs (Drevemo et al., 1987). The fact that asymmetries are present at such a young age is strong evidence for congenital laterality or sidedness. Furthermore, when the same horses were re-evaluated at 18 months of age the differences between the left and right sides were even more pronounced in horses that had been trained, but not in those that were not trained in the interim. An asymmetric appearance of the hindquarters has been associated with poor racing performance (Dalin et al., 1985). Five hundred Standardbreds in race training were evaluated for symmetry in the height of their tubera sacrale. The left tuber sacrale was lower than the right one in nine horses, and the right tuber sacrale was lower than the left one in 30 horses. The asymmetric horses had significantly larger body size than the 461 horses that did not show asymmetry. The asymmetric horses had lower total earnings, a lower number of races per horse and fewer good racing records. It was concluded that horses in which the height of the tubera sacrale is asymmetrical are less likely to become successful racehorses. Lameness is a common problem in racing horses, and gait asymmetries that arise due to defects in the geometrical design of the racetrack were identified as a predisposing factor. Dalin et al. (1973) showed that when horses trot on a track with under-banked semi-circular turns the gait becomes asymmetrical at high speeds with the horses changing to a galloping motion in the hind limbs. To overcome the tendency to slip sideways on the turns, the horse leans into the turns and places the feet at an angle, using friction against the track surface to overcome the centrifugal force. The left limbs are adducted and placed on the ground closer to the horse’s midline, which is associated with a lateral landing of the left hooves and medial deviation of the fetlock throughout the stance phase. Thermographic evaluation revealed that, after the horses performed at speed around inadequately banked turns, the left fore fetlock became warmer than the right one. The traditional racetrack design of two straights joined by under-banked semi-circular turns is obviously not optimal for either performance or soundness of the horses. Fredricson et al. (1975) made suggestions for improving the geometric design of racetracks. They recommended the use of wide sweeping turns to reduce the horse’s tendency to slide outwards and to facilitate adequate banking; on tighter turns the amount of banking required is so great that the surface material cannot be stabilized. Only the inner half of the track needs to be banked sufficiently for maximal speed; the middle and outer lanes can be less steeply banked to accommodate moderate and slow speed training. It has also been observed that gait asymmetries are most prevalent as the horse enters and leaves the turns. Therefore, the intercalation of a transitional curve between the true curve and the straight is highly recommended (Fredricson et al., 1975). A study relating conformation to performance in Standardbred trotters (Magnusson, 1985) showed that traits associated with superior racing performance included height at the withers and large girth circumference around the point of the withers, which was indicative of prominent withers and a large area for attachment of the locomotor muscles. In contrast, girth circumference at the lowest point of the back had a negative correlation with performance. Outward rotation of the limb axes, which is typically regarded as a conformational fault, had a positive effect on racing ability. Conformational features that had a negative influence on performance included tied in at the knees and hocks, narrow hooves and greater width/circumference of the forelimbs. Overall it was concluded that the better performing horse was a lightweight, gracile type with tall withers, with open angles at the shoulder and stifle joints and normal-sized hooves. The pace is a symmetrical gait in which the lateral pair of limbs move more or less synchronously. The ability to pace is genetically determined (Andersson et al., 2012). Slow motion studies have shown that ground contact of the hind hoof precedes that of the front hoof (Crawford & Leach, 1984; Wilson et al., 1988a), unlike the racing trot in which the front hoof usually precedes the hind hoof. At racing speed the dissociation is about 30 ms, which represents 7% of stride duration. With this amount of dissociation, the pace can be considered a four-beat gait (Wilson et al., 1988a). The stride lengths and stride durations of Standardbreds pacing at a range of speeds between 11.5 and 14.0 m/s are shown in Table 14.2. Pacing speed increases primarily as a result of an increase in stride length with minimal change in stride frequency (Wilson et al., 1988b). Lengthening of the stride is a result of covering a greater distance during the suspension phases, without much change in the distance between the lateral pair of limbs during stance. Although the overall stride rate does not show much change with speed, overlap time is reduced and single support time is increased as a consequence of having longer diagonal advanced placements and diagonal advanced completions. These changes in timing create a distinctly four-beat gait. The best discriminators between speeds were stride length and overlap time, while the variables that limited pacing speed were stride rate and suspension time (Wilson et al., 1988b). Although the pace is generally described as a symmetrical gait, many pacers show temporal asymmetries between the left and right sides. Gait variables that show left–right asymmetries include stance duration, suspension, overlap, diagonal dissociation and single support (Crawford & Leach, 1984). The primary requirement for an endurance horse is economy of movement, but the stride variables that contribute to energetic economy have not yet been evaluated. During a race an endurance horse takes many thousands of strides. Horses that maximize transfers of angular momentum between limb segments reduce their mechanical energy expenditure and so use less metabolic energy to cover a given distance. Prolonged endurance training of 8 months’ duration resulted in significant reductions in stride and stance durations in association with an increase in the percentage of Type IIA muscle fibers and a decrease in the percentage of Type IIX muscle fibers, which was interpreted as an indication of more efficient propulsion associated with an increase in muscle fatigue resistance and strength (Rivero et al., 2001). In one study, stride length increased during the course of an 82 km endurance ride. Compared with pre-race values, stride length at the walk increased to 115% at 41 km and 123% after 82 km. The length of the trot stride increased to 151% at 41 km and 149% after 82 km compared with pre-race values (Lewczuk & Pfeffer, 1998). It was suggested that the increase in stride length was due to warming up during the course of the race. A different study that evaluated the effects of fatigue found that speed decreased from 4.55 to 4.03 m/s during an 80 km race due to a reduction in stride length without any change in temporal variables (Wickler et al., 2006). This is in contrast to horses exercised to exhaustion at a similar speed (4.5 m/s) on a treadmill with 6% incline, in which the constant speed was maintained using longer stride lengths and shorter stride frequencies (Wickler et al., 2006). Sport horses are selected by horsemen, often at a young age, with one of the important selection criteria being visual appraisal of their gait patterns. The definition of ‘good gait’ or ‘good action’ is, however, rather subjective (Smythe, 1957), and always leads to discussion between experts (Oliver & Langrish, 1992). Observational gait analysis seems to be a convenient technique to quantify gait (Krebs et al., 1985), but it should be standardized by using a uniform scoring system to improve reliability between judges (Eastlack et al., 1991). Many of the Warmblood registries use such a system to score gait quality (e.g. van Veldhuizen, 1991). The most important gait for selection of sport horses is the trot (Podhajsky, 1981; Clayton, 1994a). Podhajsky (1981) suggested that the ideal gait and speed to train a horse overground under saddle is the trot at 3.75 m/s, which is between the speeds recorded for the working and medium trot (Clayton, 1994a; Sloet & Clayton, 1999). At a speed of 4.0 m/s horses of all ages move on a treadmill at a comfortable though demanding trot that can be used to evaluate stride characteristics (Back et al., 1994a). The same speed has been used to analyze the gait of Standardbreds and Thoroughbreds (Drevemo et al., 1987; Herring et al., 1992). Standardization of speed is important because many kinematic variables are speed dependent, with the relationship being closer for linear than temporal variables (Galisteo et al., 1998). Modern kinematic analysis equipment has also been used to assess the quality of movement in elite dressage and show-jumping horses during competition (Leach et al., 1984; Deuel & Park, 1990, 1991; Clayton et al., 1995, 1996; Colborne et al., 1995; Burns & Clayton, 1997; Clayton, 1997a; Hodson et al., 1999) and to compare the quality of the overground trot scored by a judge with kinematic variables measured during treadmill locomotion (Back et al., 1994b). In the latter study the judge used a linear scoring system, in which the trot was rated on three criteria: length, strength and suppleness. The measured kinematic variables included forelimb and hind limb stride and swing durations, scapular rotation, forelimb maximal fetlock extension, forelimb maximal retraction, hind limb maximal protraction, maximal stifle flexion and maximal tarsal flexion. The kinematic variables correlated very well with the judged score and allowed the subjective terms used by horsemen to be quantified. Sport horses with good gaits move with longer stride lengths and a lower stride frequency (Knopfhart, 1966). The lower stride rate and, hence, longer stride duration in horses with a better trot were associated with longer durations of both stance and swing phases in the forelimb (Back et al., 1994b; Morales et al., 1998a, 1998b). Although the trot is described as a two-beat gait in which the diagonal limb pairs make contact and lift-off simultaneously, slow motion analysis has shown that there is usually a period of dissociation with either the fore or hind hoof making ground contact and lift-off earlier. The time between contact or lift-off of the diagonal limbs is called diagonal dissociation, with the more specific terms diagonal advanced placement (time between fore and hind contact) and diagonal advanced completion (time between fore and hind lift-off) also being used. Positive values are assigned if the hind limb acts in advance of the forelimb, and negative values are assigned if the forelimb acts in advance of the hind limb. A positive dissociation at contact is associated with good movement and a well-balanced horse (Holmström et al., 1994b; Morales et al., 1998a, 1998b). The magnitude of the positive dissociation at contact tends to increase with training due to greater elevation of the forehand as the degree of collection and self-carriage improve (Tans et al., submitted). The forelimb has been likened to a pendulum rotating around the proximal scapula, with better moving horses showing more retraction in the forelimbs and more protraction of the hind limbs (Fig. 14.4). To increase stride length, an increased scapular movement is obligatory (Spooner, 1977). Therefore Smythe (1957) and Spooner (1977) both stressed the importance of having enough space between the elbow and the ribs to facilitate the sliding movement of the proximal forelimb over the rib cage. The spring-like action of the fetlock joint is valued as a method to reduce impact shock (Smythe, 1957; Alexander, 1988; Gray, 1993), to give smoothness of action (Gray, 1993) and to store elastic energy (Clayton et al., 1998). The action of the fetlock contributes to the appearance that the horse moves in a graceful, floating manner (Oliver & Langrish, 1992). Much of the expression in the trot is judged from the forelimb movements during the swing phase (Fig. 14.5). At the position of maximal forelimb protraction, expressive movers have greater flexion of the elbow and more elevation of the carpus (Fig. 14.5) (Holmström et al., 1994b). This type of movement is indicative of the horse controlling the motion of the distal joints during protraction rather than relying on inertial forces and anatomical constraints to determine the joint position in maximal protraction. With regard to conformation, a sloping shoulder facilitates forward and upward movement of the limb during the swing phase, so conformation of the shoulder may play a role in gait quality (Holmström et al., 1990). After the limb reaches its maximally protracted position, it is retracted before making ground contact (Fig. 14.6). This period, which is known as the swing phase retraction, has a longer duration in the forelimbs of horses that receive high trot scores (22% of stride duration) than for those with low trot scores (10% of stride duration). The fore hoof trajectory reaches a height of 20–25 cm during midswing in horses with a high gait score, whereas horses with lower gait scores do not raise the hoof as high and the flight arc peaks earlier in the swing phase (Holmström et al., 1994b). Better moving sport horses have more protraction of the hind limbs, shown as more forward placement of the hind hoof relative to the tuber coxae as a result of the combined actions of the joints of the hind limb (Holmström et al., 1994b). When horses show a combination of large ranges of hind limb protraction and simultaneous forelimb retraction, the trot has the appearance of greater ‘suppleness’ in lateral bending of the body, which is one of the visual indicators in horses with a good gait (Back et al., 1994b). Stifle and tarsal joint flexion, which are closely related through the reciprocal apparatus (Weeren, 1990), support protraction with greater flexion being indicative of superior action in the hind limb (Spooner, 1977; Alexander & Trestik, 1989; Oliver & Langrish, 1992; Back et al., 1994b; Morales et al. 1998a, 1998b). During the stance phase, horses with high gait scores show greater inclination of the pelvis, flexion of the hock and extension of the fetlock joints as the limb accepts weight. This is associated with a significantly larger angular velocity during tarsal flexion between 20 and 55% stance and during tarsal extension between 75 and 85% stance. In the later part of the stance phase, the limb is retracted faster in good movers (Holmström & Drevemo, 1997). Maximal hoof height occurs soon after lift-off in the hind limb and does not differ with gait quality (Holmström et al., 1994b). Although European Warmblood breeds currently predominate in international dressage competitions, other breeds are competing more frequently. Warmbloods typically have lofty gaits with a long suspension phase, which requires the generation of large vertical ground reaction forces and impulses. Compared with Quarter Horses, Warmbloods have been shown to have higher peak vertical forces normalized to body weight (Back et al., 2007). Comparison of the gaits of Andalusian, Arabian and Angle-Arabian horses showed that Andalusians have more carpal flexion resulting in a larger range of carpal joint motion and also have less forelimb retraction than the other breeds at walk (Galisteo et al., 2001). Cano et al. (2001) found that Andalusians had more flexion in the joints of the forelimb at trot than Arabians or Anglo-Arabians, which accounted for the elevated movements that are characteristic of the breed. Anglo-Arabians had a smaller range of protraction–retraction in both the fore and hind limbs. Tracking length was positive (over-tracking) in Arabians and Anglo-Arabians, but negative (not tracking up) in Andalusians. Horse breeders are interested in identifying gait characteristics of young animals that are predictive for future performance, so it is important to know at what age the adult gait characteristics are acquired. Using modern automated kinematic analysis equipment Back et al. (1994a, 1995a) compared the gaits of foals with those of adults using angle–angle diagrams that are indicative of intra-limb coordination (Kobluk et al., 1989; Martinez-del Campo et al., 1991). Plots of carpal angle against fetlock angle (Fig. 14.7) showed that some horses accelerate their carpal joint flexion during the swing phase (‘spike’ pattern) and some maintain a constant carpal angle during the same period (‘straight’ pattern), and others demonstrate a smoother rate of carpal flexion (‘convex’ pattern). Fig 14.7 Angle–angle diagrams of the carpal and fetlock joints of three horses (A, B, C) as foals (green line) and adults (red line). From Back et al. (1994a). A longitudinal study of 24 Warmblood horses was performed with evaluations at 4, 10, 18 and 26 months of age at walk, trot and canter on the treadmill (Back et al., 1993, 1994a). A treadmill was used to standardize speed, because Dušek (1974) was not able to find any correlations between height and temporal gait variables during overground locomotion when the individuals selected their own, preferred walking or trotting speed. Intra-limb coordination features could be recognized as early as 4 months of age. Variability of kinematic variables was similar throughout the growth period indicating that kinematic patterns are already established at a young age. Remarkable resemblance between angle–angle diagrams recorded in the foal compared with the adult can be observed especially in individuals showing the more typical ‘spike’ versus ‘convex’ pattern in the carpal–fetlock kinematics (Fig. 14.7). There were age-related increases in stride and stance durations (Back et al., 1994a) as a result of increases in limb length and height at the withers (Beck et al., 1981; Vilensky et al., 1990a, 1990b). Swing duration, protraction and retraction angles, and joint angular kinematics were consistent throughout this age range (Back et al., 1994b). Within an individual animal, angle–time and angle–angle graphs for the joints of the fore and hind limbs were remarkably similar both visually and numerically from 4 to 26 months (Fig. 14.7). Each animal appeared to have an inherent and characteristic intra-limb pattern that was retained from foal to adulthood, the ‘gait fingerprint’. Prediction aims to select horses with a good gait quality at an early age and Back et al. (1995b) proved that locomotor variables, including swing duration, maximal protraction–retraction angles, and maximal tarsal flexion, showed a good correlation between 4-month-old foals and adults. Since these kinematic variables are indicative of gait quality (Back et al., 1994b) this explains why astute horse breeders are said to be able to predict future gait performance at a young age (Clayton, 1989a; Grant, 1989). The inherent patterns of the angle–angle diagrams that are recognized at foal age (Back et al., 1994a) might be related to the future ability to perform gait transitions or piaffe and passage in dressage horses, while in jumping horses it might be related to jumping technique, which has become a more substantial part of selection procedures. Gait analysis can be used to quantify performance, while neural networks might be developed to automate pattern recognition in the data (Holzreiter & Köhle, 1993; Dalin, 1994). In this way, more specific selection criteria for dressage or jumping could be defined and objectively measured. Finally, it should be remembered that horses can be trained to perform well, but for élite performance in competition the mental capacities of rider and horse might be the crucial factor. Temporal gait variables in differently sized animals of the same breed can be made comparable after a transformation based on linear and dynamic similarity principles (Günther, 1975; Alexander, 1984). However, models found in the literature that would compensate for the influence of height on temporal kinematic variables, like trot–gallop transitions (elastic similarity) and Froude numbers (dynamic similarity), showed inconclusive results (Vilensky & Gankiewicz, 1986; Drevemo et al., 1987). The principle of Günther (1975), in which frequencies are related to linear dimensions, showed a decrease in relative stride duration with age, which is in accordance with Back et al. (1994a) that younger animals take relatively longer strides (Fig. 14.8). Back et al. (1995b) hypothesized that, after normalization for differences in conformation, foal and adult kinematics are similar within a certain range (Tables 14.3–14.5). Fig 14.8 Correlation between height at withers and stance duration (A) and height at withers and swing duration (B) recorded at trot in a group of horses at ages 4 months (1), 10 months (2), 18 months (3), and 26 months (4). From Back et al., (1994a). Consider a small and a large horse, in which the dimensions of the large one are a simple multiplication of the dimensions of the smaller one. If the forelimb is regarded as a pendulum that moves the body forward at constant horizontal velocity with the same pro-/retraction angles and stance durations, the distance moved during the stance phase will increase almost linearly with height. During the swing phase the limb must move over a greater distance in the same time. If the maximal protraction and retraction angles of the limbs are the same (Back et al., 1994a) and the speed of progression is also the same, the larger animal moves with a longer stride length and a slower stride frequency. Normalization can be achieved by multiplying the quotient of the height at the withers of the larger and smaller horse with, for example, the stride duration of the smaller horse (Günther, 1975).
Performance in equestrian sports
Racing sports
Speed
Stride length
Stride frequency
Efficiency of movement
Quarter Horse racing
Stride variables
Sidedness
Effect of urging
Thoroughbred racing
Stride variables
Head and neck motion
Acceleration
Ground reaction forces
Limb kinetics
Fatigue
Injury
Training
Track surface
Standardbred racing
Trotters
Stride variables
Reproducibility of gait
Ground reaction forces
Sidedness
Effect of track design
Conformation of trotters
Pacers
Stride variables
Sidedness
Endurance racing
Sport horses
Quality of movement
Stride and swing duration
Forelimb kinematics
Hind limb kinematics
Breed differences
Ontogeny of gait
Normalization of temporal variables
Linear similarity
Performance in equestrian sports