Using Nonesterified Fatty Acids and β-Hydroxybutyrate Concentrations During the Transition Period for Herd-Level Monitoring of Increased Risk of Disease and Decreased Reproductive and Milking Performance
Paula A. Ospina, DVM, MPH, PhDa, Jessica A. McArt, DVM, PhDb, Thomas R. Overton, PhDa, Tracy Stokol, BVSc, PhDc and Daryl V. Nydam, DVM, PhDd∗, aDepartment of Animal Science, Cornell University, 272 Morrison Hall, Ithaca, NY 14850, USA; bDepartment of Clinical Sciences, Colorado State University, B217 VTH, 300 West Drake, Fort Collins, Colorado 80523-1601, USA; cDepartment of Population Medicine and Diagnostic Sciences, Cornell University, S3 110 Schurman Hall, Ithaca NY 14853, USA; dDepartment of Population Medicine and Diagnostic Sciences, Veterinary Medical Center, Cornell University, Room C2 562, Ithaca, NY 14850, USA. E-mail address: dvn2@cornell.edu ∗Corresponding author.
Keywords
Dairy cows
Negative energy balance
Nonesterified fatty acids
β-Hydroxybutyrate
Herd-level tests
Introduction
All dairy cows visit a state of negative energy balance (NEB) as they transition from late gestation to early lactation. This imbalance in energy is the result of both an increase in energy requirements (more than twice as high when compared with prepartum levels1) and a decrease in dry matter intake (DMI2). The increase in energy demand is due to lactogenesis, which depends on available glucose concentrations3 from gluconeogenesis in the liver.4
Several groups that have evaluated elevated NEFA and BHB concentrations as markers of excessive NEB report an increased risk of disease development5–10 and a decrease in both milk production and reproductive performance.11–14 As some degree of NEB postpartum is physiologically normal, it is the depth, duration, and timing of it that influences the cow’s health and performance.
Physiology
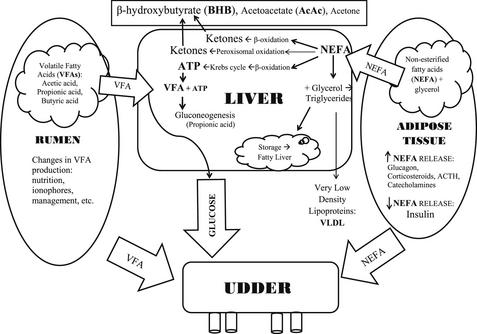
The metabolites NEFA and BHB can be used as markers of NEB because of the relationship between energy demands, energy reserves, and the metabolic association between NEFA and BHB. Fig. 1 is a graphic representation of the association between these factors.
Adipose Tissue
Early in the postpartum period, there is both a decrease in insulin production15 and a transient state of insulin resistance.1 These 2 mechanisms allow glucose sparing for lactogenesis by decreasing glucose use by insulin-sensitive tissues, and allowing continued lipolysis even when insulin concentrations increase.16
The continual release of NEFA into circulation is not always detrimental: NEFA is a good source of energy for several tissues in the body, and can be used to synthesize milk fat. However, elevated levels of NEFA can result in excessive accumulation of triglycerides in the liver, resulting in hepatic lipidosis. In addition to the overtly detrimental effects of hepatic lipidosis,17 more recent research has demonstrated that elevated NEFA concentrations can also adversely affect immune function18,19 (see also the article by Sordillo and colleagues20 elsewhere in this issue), and an excessive amount of circulating fatty acids may promote inflammation, which is an important factor in common diseases such as metritis and mastitis.
Rumen
Several factors (eg, nutrition, ionophore use, and DMI) determine the amount and proportion of the 3 major volatile fatty acids (VFA; acetic acid, propionic acid, and butyric acid) produced by microbes in the rumen. Acetic acid is used mainly in the liver as a major source of acetyl coenzyme A to generate adenosine triphosphate (ATP). Butyric acid is absorbed from the rumen as a ketone body, BHB. Propionic acid is taken up by the liver via portal circulation and serves as the major substrate for gluconeogenesis.4
Liver
The liver receives approximately one-third of cardiac output and removes approximately 15% to 20% of the NEFA in circulation.21,22 Once inside the liver, fatty acids can follow 4 pathways: complete oxidation in the tricarboxylic acid cycle (TCA) pathway to produce ATP; transport out of the liver in very low-density lipoproteins; transformation to ketone bodies via the β-oxidation pathway or conversion to ketone bodies through peroxisomal oxidation; or storage in the liver as triglycerides.15
The 3 major ketone bodies produced by the liver are acetone, acetoacetate (AcAc), and BHB. AcAc can spontaneously convert to acetone and CO2 and can also be metabolized by the enzyme β-hydroxybutyrate dehydrogenase into BHB. Acetone is excreted in urine or exhaled; it is responsible for the “fruity” breath of ketotic cows. While BHB accounts for most of the total ketone body pool in bovines, in lactating animals with NEB the equilibrium between AcAc and BHB may be shifted even farther toward BHB.23 This shift in equilibrium may be important when selecting between the nitroprusside colorimetric spot tests, which test for acetone and AcAc, and a test that directly measures BHB.
Mammary Gland
The mammary gland is not dependent on insulin for glucose use.24 During excessive NEB, circulating NEFA are regularly incorporated into milk fat.25 During NEB in the postpartum period, milk fat concentrations tend to increase and milk protein concentrations tend to decrease; thus, the ratio between fat and protein can be used as an indicator of excessive NEB and as a predictor of the risk of developing metabolic diseases.26–28 To use milk fat and protein information as a predictor of metabolic diseases that commonly occurs within 30 days in milk (DIM), samples should be evaluated within 9 days postpartum.28
Diagnostic test accuracy: individual animal tests
Sensitivity and Specificity
To illustrate the trade-off between sensitivity and specificity when selecting a cut-point from a continuous distribution, data from a previous study9 are used here. In this study the postpartum NEFA concentration was measured in animals 3 to 14 DIM, the objective being to determine a cut-point above which an animal was at higher risk of developing a displaced abomasum (DA), for example. Fig. 2 is a frequency distribution of NEFA concentrations in the sampled animals.
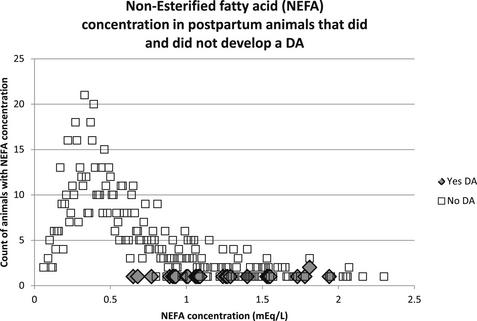
Three major factors should be apparent from this example: (1) NEFA concentrations do not follow a normal distribution; (2) relatively few animals developed a DA; and (3) there is an overlap in NEFA concentrations between those animals that developed a DA and those that did not. It is this overlap between the 2 groups that forces the trade-off between sensitivity and specificity. Animals with postpartum NEFA concentration of 0.7 mEq/L or more were 10 times more likely to develop a DA than those with NEFA concentrations of less than 0.7 mEq/L.9 In this example, if the NEFA cut-point is increased (eg, 1.0 mEq/L), the sensitivity of this test goes down and specificity goes up; that is, animals whose NEFA concentration is below the new higher cut-point but that develop a DA will result in a false negative, but there will simultaneously be fewer false positives. The converse is also true if the cut-point is chosen to be lower than 0.7 mEq/L.
Because there is usually an overlap between the 2 populations of interest (ie, those with and without the outcome of interest), the cut-point chosen at the individual animal level could provide either the highest sensitivity if the consequence of false negatives are a concern, or the highest specificity if the consequence of false positives are a concern. However, in most cases it is ideal to use a test with both high sensitivity and high specificity. To identify this threshold, a receiver-operator characteristic (ROC) curve can be used to compare continuous predictors with a single dichotomous outcome. An example of the ROC curve evaluating NEFA in cows sampled postpartum versus DA as the outcome is shown in Fig. 3.
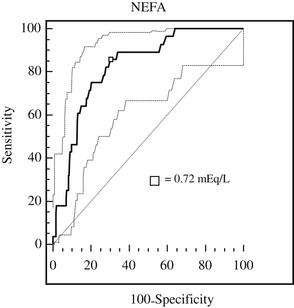
The area under the ROC curve can be interpreted as the probability that a randomly selected diseased individual has a greater test value than an individual without the disease.29 When evaluating the association between elevated NEFA and BHB and the development of disease, both metabolites were treated as tests with continuous concentrations and were evaluated against the development of disease. The diseases under evaluation were DA, metritis (MET) and/or retained placenta (RP), and clinical ketosis (CK), or any of the three.9
The ROC curves were used to estimate sensitivity and specificity for various cut-points and diseases (Table 1). The study evaluated these cut-points at the individual animal level and determined the risk ratio associated with having elevated NEFA or BHB.9 Table 2 is a summary of the risk ratios of developing any disease (DA, CK, MET, or RP) based on the cut-points with the highest combined sensitivity and specificity.
Table 1
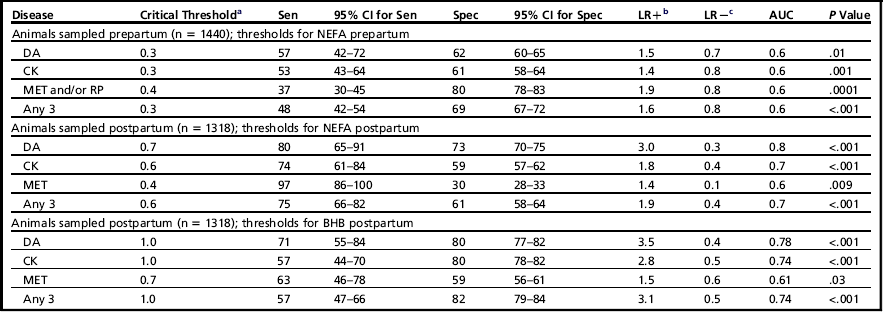
aHighest combined specificity and sensitivity.
bLikelihood ratio positive.
cLikelihood ratio negative.
Data from Ospina PA, Nydam DV, Stokol T, et al. Evaluation of nonesterified fatty acids and beta-hydroxybutyrate in transition dairy cattle in the northeastern United States: critical thresholds for prediction of clinical diseases. J Dairy Sci 2010;93(2):546–54.
Table 2
The risk ratios for developing any diseasea based on NEFA concentrations sampled prepartum and postpartum and BHB sampled postpartum
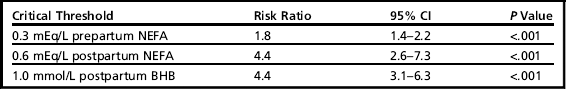
aAny disease indicates displaced abomasum, clinical ketosis, metritis, or retained placenta.
Likelihood Ratios and Predictive Values
Table 1 also reports the likelihood ratio positive (LR+) and negative (LR−). In general, the LR measures how much a test result will change the odds that the animal has the disease, and incorporates both the sensitivity and specificity of the test. The LR+ indicates how much the odds of the disease increase when a test is positive. Similarly, the LR− indicates how much the odds of the disease decrease when a test is negative.29
Because odds are difficult to interpret but LRs are commonly reported, a simpler approach is proposed for evaluation of LRs.30 This approach estimates the change in probability associated with different LRs, and is based on the pretest probability. A pretest probability refers to the probability of an animal having the target disorder before the results of the diagnostic test is known. For example, an LR+ of 2 can be interpreted as a 15% increase in the probability of disease above the current pretest probability; LR+ of 3 is 20%, LR+ of 4 is 25%, and so forth. An LR− of 0.1 reduces the probability of a disease given the test result by 45%, LR− of 0.2 by 30%, LR− of 0.3 by 25 and so forth, below the current pretest probability.30 In Table 1, for example, an LR+ of 1.9 when postpartum NEFA is at least 0.6 mEq/L means that an animal with NEFA of 0.6 mEq/L or greater has a 15% increased probability (above the pretest probability) of having any of the diseases (DA, CK, MET, or RP).
Although the predictive value positive (PV+) and negative (PV−) are not reported in Table 1, these values are a useful tool for interpreting test results. The PV+ is the probability that, given a positive test, the animal actually has the disease; PV− is the probability that, given a negative test, the animal does not have the disease.29 The same test will have different PV+ and PV− in different populations because it is driven by the underlying true population prevalence.
Available Tests
Ketone bodies
Recently, the Precision Xtra meter (Abbott Laboratories, Abbott Park, IL), a handheld device for measuring blood BHB concentrations, was validated for use in ruminants.31,32 The sensitivity and specificity are 88% and 96%, respectively, when using a cutoff value of 1.2 mmol/L; and 96% and 97% when using a cutoff value of 1.4 mmol/L.31,32 The cost of this test is approximately US$1.30 per strip and the meter costs approximately US$30.00.
There are other ketone body tests on the market with varying degrees of sensitivity and specificity. The Ketostix strip (Bayer Corp, Elkhart, IN) evaluates AcAc in urine. Relative to serum BHB concentrations of 1.4 mmol/L and higher, the strip had 90% sensitivity and 86% specificity when read as a “trace,” and when read as “small” it had 78% sensitivity and 96% specificity.33 A limitation of the test is that only 50% of the cows could be induced to urinate while sampling. The cost of this test is $0.20 per strip.
The Ketotest (Sanwa Kagaku Co Ltd, Nagoya, Japan) for BHB in milk when read at 0.1 mmol/L or greater had 73% sensitivity and 96% specificity; at greater than 0.2 mmol/L it had 27% and 99% sensitivity and specificity, respectively, when compared with serum BHB 1.4 mmol/L or greater.33 The cost is $1.70.
The KetoCheck powder for milk AcAc (Great States Animal Health, St. Joseph, MO), had a very low sensitivity, ranging from 41% to 2% when reading the test from trace to large, respectively; but the specificity was high, ranging from 99% to 100%, when compared with BHB 1.4 mmol/L or greater in serum.33 The cost of this test ranges from $0.50 to $1.00 per test.
The accuracy of PortaBHB (PortaCheck, Moorestown, NJ), a newer cow-side milk test, has been reported to have sensitivity and specificity of 89% and 80% when using a threshold of 100 μmol/L, and 40% and 100% when using a threshold of 2 mmol/L, compared with a serum BHB concentration of 1.4 mmol/L or greater.34 It costs approximately $2.05 per strip.
NEFA
At present, NEFA testing is limited to processing blood or serum samples at a diagnostic laboratory. The recommended procedure for sample collection and processing is: collect with ethylenediaminetetraacetic acid or non-anticoagulant tubes, immediately cool to 4°C, and separate serum within 24 hours.35 Although NEFA values can be more stable throughout the day in comparison with BHB,36 NEFA values may be affected by stress at sampling and sample handling, given that in vitro hemolysis can increase or decrease the NEFA concentration depending on reagents used.37,38 The current cost at the New York State Animal Health Diagnostic Center is $11.00 per sample. However, it is important that when both NEFA and BHB were evaluated in the same model, NEFA had a stronger association than BHB with the outcomes of interest.9
Incidence versus prevalence testing
When evaluating NEB, the distinction between incidence and prevalence tests is important because they can yield different results based on the frequency of sampling. This difference is based on the average duration of disease; for example, the prevalence of a disease that has a short duration may be low, whereas the incidence may be high. In the case of NEB the average duration of subclinical ketosis (SCK; BHB concentrations ≥1.2 mmol/L on Abbott BHB meter) was 5 days.39 In this case, a minimum of biweekly sampling (of all animals at risk) will be needed to estimate incidence. If less frequent prevalence testing is done, the prevalence estimate may be half of the incidence, a large underestimate.39,40
Cow-level association of excessive NEB and negative downstream outcomes
Several research groups have evaluated the association between excessive NEB and negative downstream outcomes at the individual animal level, and have reported NEFA and BHB cut-points associated with these outcomes of interest.5,8–14,41 Some of these cut-points were reported earlier (see Table 1).9,13
Diseases and Culling
The association between elevated NEFA and disease and culling was done in a study of 67 high-producing herds comprising 1170 multiparous Holstein cows in Michigan.5 This study concluded that cows with prepartum NEFA concentrations greater than 0.3 mEq/L had a higher risk of developing a DA. This study was also one of the first to report several herd-level risk factors for increased risk of a DA, including summer and winter season, high-energy forage in the dry period, poor bunk management, and increased body condition score.
A study involving 25 dairy farms and approximately 1000 cows near Guelph (Ontario, Canada) also explored the association between excessive NEB and negative downstream outcomes.10,11,41 ROC curves were used to determine the cut-point for prepartum NEFA and postpartum BHB above which cows had higher odds of developing a DA.41 When prepartum NEFA concentrations were measured 4 to 10 days prepartum, cows with concentrations greater than 0.5 mEq/L had 4.1 greater odds of developing a DA. The sensitivity, specificity, and LR of this cut-point were 46%, 82%, and 2.6, respectively. The odds of developing a DA in cows with serum postpartum BHB concentration greater than 1.2 mmol/L measured 1 to 7 DIM were 8 times greater than that of cows below this threshold. The sensitivity, specificity, and LR of this cut-point were 62%, 82%, and 3.5, respectively. Cows with BHB concentrations in milk (Ketotest, Elanco) greater than 0.2 mmol/L had 3.4 greater odds of developing a DA; this cut-point had 47% sensitivity, 79% specificity, and LR 2.4. In this study, BHB measured in the postpartum period was a better predictor of the risk of developing a DA than was NEFA sampled prepartum; however, NEFA in the postpartum period was not evaluated.41
The effect of elevated BHB concentrations postpartum on both health and milk production was evaluated.11 Two-by-two tables for cut-points between 6 and 20 mmol/L in 2-mmol/L increments were evaluated, and the cut-point with the highest sensitivity, highest specificity, largest impact, and smallest chance of committing a type I error was reported. The impact was evaluated through the odds ratio (OR). The ORs for the development of a DA were 2.6 and 6.2; the BHB concentration cut-points were 1.2 mmol/L and 1.8 mmol/L for week 1 and week 2, respectively. The sensitivity, specificity, and LR for these cut-points were 44%, 77%, and 1.9 for week 1 and 45%, 88%, and 3.9 for week 2, respectively. When clinical ketosis (CK) was evaluated as the outcome, the cut-points were 1.4 mmol/L for both week 1 and week 2. The ORs were 4.2 and 5.9, and the sensitivity, specificity, and LR were 46%, 83%, and 2.8 for week 1 and 57%, 82%, and 3.1 for week 2, respectively. Only week-1 BHB was associated with metritis, the cut-point being 1.2 mmol/L; sensitivity was 52%, specificity 76%, and LR 2.1.
Ospina and colleagues9 studied more than 2700 cows in 100 free-stall dairies in New York, Pennsylvania, and Vermont. Approximately half the animals were sampled 14 to 3 days prepartum and the other half sampled 3 to 14 days postpartum in a cross-sectional sample. This study established critical thresholds above which cows were more likely to develop disease (DA, CK, or RP/MET). The ROC curves were used to identify the cut-point with the highest sensitivity and specificity, with the presence or absence of the disease as the outcome (see Table 1).
In addition to sensitivity and specificity, LR were also reported (see Table 1). The thresholds with the largest combined sensitivity and specificity associated with the development of any of the diseases of interest were: prepartum NEFA 0.3 mEq/L or greater; postpartum NEFA 0.6 mEq/L; postpartum BHB 1.0 mmol/L. The LRs ranged from 1.2 to 4.9 across different NEFA and BHB cut-points. In the original article9 several different cut-points are reported, including those with higher sensitivity or higher specificity, so that the reader can select the appropriate cut-point based on the desired criteria.
In a study including more than 2300 cows in 55 free-stall Holstein dairies across the United States and parts of Canada, the association between elevated NEFA and BHB and the development of diseases was studied.10 This study is the first to evaluate on a large scale the association between prepartum BHB and disease outcomes. The investigators reported that cows with prepartum NEFA concentrations of 0.3 mEq/L or greater had higher odds of developing RP (OR 1.8; 95% confidence interval [CI] 1.3–2.6; sensitivity 67%, specificity 46%) and metritis (OR 1.8; 95% CI 1.5–2.9; sensitivity 75%, specificity 40%), than cows with prepartum NEFA below this cut-point. However, there were some regional differences for metritis. The odds of developing a DA in animals sampled prepartum with NEFA concentrations of 0.5 mEq/L or greater was 2.9; the sensitivity and specificity of this cut-point were 49% and 75%, respectively. In animals sampled postpartum, those with NEFA concentrations greater than or equal to 1.0 mEq/L had higher odds of developing a DA (OR 4.3; sensitivity 51%, specificity 80%). Although this study found a univariable association between elevated prepartum BHB 0.8 mmol/L or greater and increased risk of DA, the sensitivity was low (22%) and the number of animals at risk was also low, so these findings should be interpreted with caution.
Most recently, the epidemiology of hyperketonemia (BHB ≥1.2 mmol/L) was intensively studied in 4 herds (2 in New York and 2 in Wisconsin).39 Cows with elevated BHB concentrations were 19.3 times more likely than nonketotic cows to develop a DA (P<.001), and ketotic cows were also 3 times more likely to be culled or die within the first 30 DIM (P<.001).42
Stay updated, free articles. Join our Telegram channel

Full access? Get Clinical Tree


