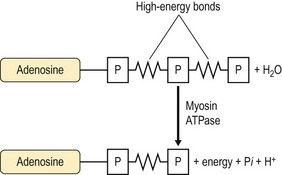
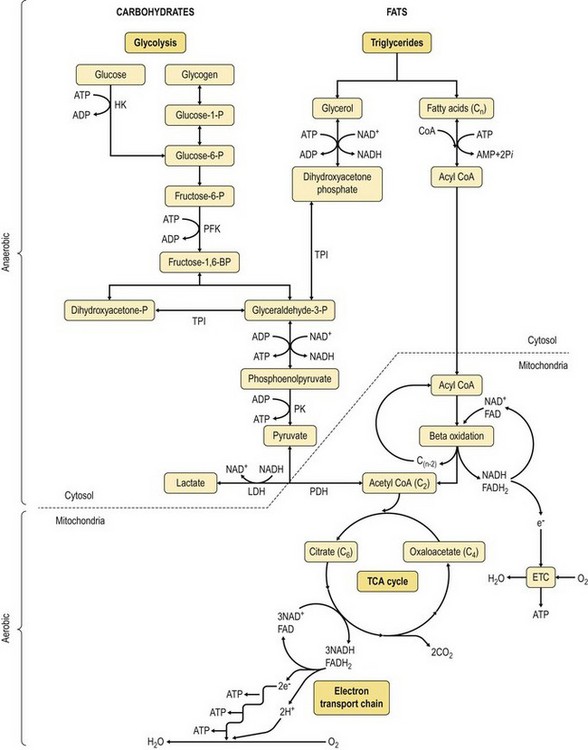
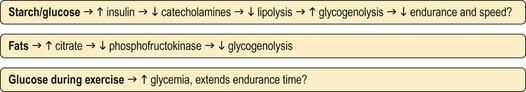
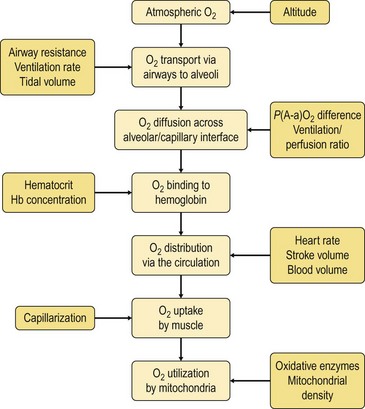
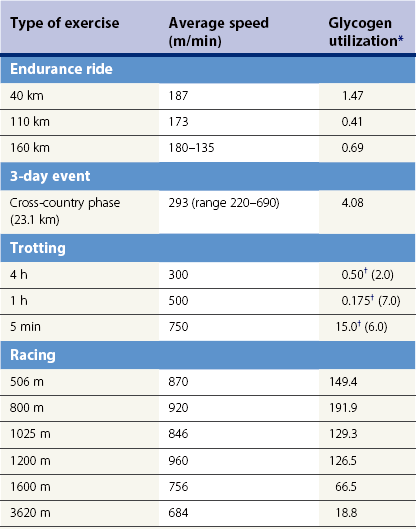
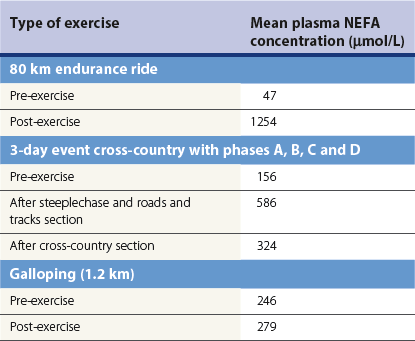
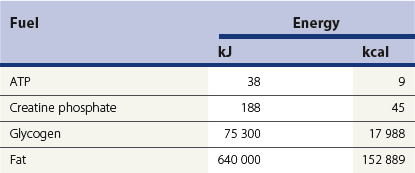
Chapter 18 • High maximal aerobic capacity. • Large intramuscular stores of energy, particularly glycogen. • High respiratory capacity of skeletal muscle. • Splenic contraction, which results in the oxygen-carrying capacity of blood increasing by up to 50% soon after the onset of exercise. • Highly efficient and adaptable gait(s). • Well-developed capacity for effective thermoregulation (Hinchcliff et al., 2004). The maximal aerobic capacity of horses is over 2-fold greater than that of similarly sized cattle. This is due to many of the adaptations outlined in the previous paragraph. Substrate is required to support these high metabolic rates during exercise. Substrate to support exercise is generally either carbohydrate or fatty acids. In most species oxidation of fatty acids, although highly efficient in terms of energy yield, is limited, and is likely to reach capacity when work rate requires ~50% of the maximal oxygen consumption. Above this exercise intensity substrate is provided by the oxidation of carbohydrates, predominantly glycogen. Athletic species such as horses and dogs have high intramuscular concentrations of glycogen relative to humans. This locally available source of substrate is critical as the flux of glucose from the circulation during exercise is limited and is likely to provide no more than ~10% of the energy used during intense exercise. Mitochondria produce the energy for muscle contraction. It is not surprising therefore that skeletal muscle of horses contains approximately twice the concentration of mitochondria found in humans, sheep and cattle. These factors combined with the profound cardiac output and oxygen carrying capacity of horses permits this species to have a higher whole animal maximal aerobic capacity when compared to less athletic domestic species (Hinchcliff et al., 2004). The limbs of horses are long and their associated muscles have relatively low power outputs when compared to smaller athletic species. However, despite this, horses have adapted such that their gait is energetically efficient. This results from the fact that up to 50% of the muscular work occurring during galloping is stored as elastic energy in muscle and tendon units. This mechanism is of such magnitude that it has been estimated that in the forelimb of horses, energy storage and subsequent release means key muscles of the forelimb are substantially smaller than if this process were not available (Hinchcliff et al., 2004). Muscular movement requires the transformation of chemical energy stored in metabolic fuels to the kinetic energy of muscular contraction. All pathways integral to energy supply are concerned with the ultimate production of adenosine triphosphate (ATP), the final carrier of energy ‘packages’ utilized by muscle for contraction. Muscular contraction involves coupling of thin actin and thick myosin filaments to form cross-bridges and then these filaments slide relative to each other by a change in orientation of the cross-bridges (Guyton, 1986). Energy is necessary for the change in orientation of the cross-bridges to occur. Cleavage of a high-energy phosphate bond from ATP results in adenosine diphosphate (ADP), free phosphate, a proton and the release of energy. This hydrolysis reaction of ATP occurs at the head of each myosin filament and is catalyzed by the enzyme myosin ATPase (Fig. 18.1). The energy released is utilized by the working muscle (Cain & Davies, 1962). In addition, ATP is the source of energy required to restore the contracted muscle to a relaxed or resting state via the distribution of calcium ions (Åstrand & Rodahl, 1986). Under normal conditions there is a finite store of ATP within muscle, sufficient to maintain muscular activity for only a few seconds (Lindholm, 1979; Åstrand & Rodahl, 1986). Therefore to perform continuous muscular exertion it is necessary to resynthesize ATP and this is performed by the pathways of aerobic (oxidative) and anaerobic phosphorylation. Production of ATP via aerobic pathways occurs within the inner membrane of mitochondria in a series of single oxidation reactions known as the electron transport or respiratory chain. Oxidation is the donation or loss of electrons (often in the form of hydrogen) from an atom or molecule, while reduction is the acceptance of electrons (hydrogen) by an atom or molecule. When electrons are donated, considerable chemical energy is liberated and a portion of this energy is captured for the rephosphorylation of ADP to ATP, with the remainder being lost as heat energy (Guyton, 1986). Nicotinamide adenine dinucleotide (NAD) and flavin adenine dinucleotide (FAD) act as hydrogen carriers (acceptors) during glycolysis, β-oxidation and the tricarboxylic acid (TCA) cycle and therefore are reduced to NADH and FADH2. These coenzymes are essential for aerobic and anaerobic phosphorylation but their concentrations within the muscle are low. Therefore, NADH and FADH2 must be reoxidized to NAD+ and FAD via the electron transport chain. Specific mitochondrial enzymes incorporated in the electron transport chain catalyze the oxidation through a process of dehydrogenation. The donated hydrogen atoms provide the electrons that are transported from one enzyme complex to another by electron carriers, e.g. cytochrome c. The importance of oxygen (O2) in this whole process is that it acts as the final hydrogen acceptor to form water. The energy released by the step-by-step transfer of electrons from NADH or FADH2 to O2 via the electron carriers is used to pump protons from the inner matrix of the mitochondrion into the outer chamber between the inner and outer mitochondrial membranes. This creates a strong transmembrane electric potential. Energy for the phosphorylation of ADP to ATP is obtained as the protons flow back through an inner membrane enzyme complex called ATP synthetase (Guyton, 1986; Stryer, 1988). The two major electron donor substrates for aerobic phosphorylation are carbohydrates (CHO) and fatty acids. Glucose is the main CHO and if it is not used for immediate energy production, it is stored as glycogen, mostly in skeletal muscle and to a lesser extent in the liver (Lindholm, 1979; Hodgson et al., 1983, 1984). Adipose tissue constitutes the largest store of fatty acids (FA) (Robb et al., 1972; Stryer, 1988). Adipocytes store fat within their cytoplasm as triglycerides. Triglyceride storage also occurs to a much lesser extent in muscle (Lindholm, 1979). The importance of CHO as a substrate for energy production increases as exercise intensity increases (Hodgson, 1985; Lawrence, 1990). Glucose diffuses into the muscle cell cytoplasm from the circulation facilitated by the glucose transporter 4. Glucose transport in mammalian skeletal muscle is almost exclusively mediated by the glucose transporter 4 (GLUT-4). Insulin and muscle contraction are two potent stimuli for GLUT-4 translocation and both recruit GLUT-4 from intracellular storage sites. In equine muscle GLUT-4 is predominantly seen in the cytosol of fast type 2B fibers (Lacombe et al., 2003; van Dam, 2004). Following uptake, CHO is phosphorylated to glucose-6-phosphate (G-6-P) in a reaction catalyzed by the enzyme hexokinase (HK) and requiring one ATP molecule. Glucose-6-phosphate is then transferred into the glycolytic pathway for immediate energy production or reversibly converted to glucose-1-phosphate (G-1-P) and then glycogen for storage. Glycogen stores provide most of the glucose required for energy production during exercise. In the glycolytic pathway, G-6-P is phosphorylated to fructose-6-phosphate (F-6-P). Fructose-6-phosphate is then phosphorylated to fructose-1,6-bisphosphate (F-1,6-BP) in a reaction catalyzed by phosphofructokinase (PFK) and at the expense of one ATP molecule. Fructose-1,6-bisphosphate is subsequently split into the triose phosphate isomers, glyceraldehyde-3-phosphate (Gl-3-P) and dihydroxyacetone-phosphate (DiH-P). Dihydroxyacetone-phosphate is readily converted into Gl-3-P by triose phosphate isomerase (TPI). So one molecule of glucose or glycogen gives 2 molecules of Gl-3-P. Glyceraldehyde-3-phosphate then proceeds through a series of reactions with the end result being the production of pyruvate, ATP, NADH, water and hydrogen ions. The net reaction for the glycolytic pathway utilizing glucose is: Under aerobic conditions the hydrogen atoms are transferred to the electron transport chain and pyruvate is transported into the mitochondrial matrix as a substrate for acetyl coenzyme A (acetyl CoA). Acetyl CoA then enters the TCA cycle by combining with oxaloacetate to form citrate. The normal function of the TCA cycle requires 3 NAD+ and 1 FAD to accept hydrogen atoms during the oxidative conversion of citrate back to oxaloacetate. When O2 is available, the NADH and FADH2 are then reoxidized back to NAD+ and FAD in the electron transport chain, thus replenishing the adenine dinucleotide stores and producing ATP (Fig. 18.2). The complete aerobic utilization of one mole of glucose generates 36–38 ATP. When O2 is not available, pyruvate is converted to lactate as described later. Following lipolysis, non-esterified fatty acids (NEFAs) are released into the circulation and are subsequently available as hydrogen donors for energy production in skeletal muscle. NEFAs likely diffuse into muscle cells down a concentration gradient (Hodgson, 1985) as well as being actively transported across the cell membrane. The latter is facilitated by a membrane-associated protein called membrane fatty acid translocase (FAT/CD36). This membrane fatty acid translocase resides in intracellular membrane fractions and translocates to the plasma membrane of skeletal muscle cells also after insulin or contraction stimuli and is seen intracellularly in equine muscle exclusively in type 1 fibers (van Dam, 2004). At the cytoplasmic surface of the outer mitochondrial membrane, the NEFAs are esterified (activated) enzymatically forming long-chain acyl CoA molecules. The acyl CoA molecules are then linked to carnitine and shuttled across to the matrix side of the inner mitochondrial membrane. In the mitochondria the acyl CoA molecules undergo a series of four reactions known as β-oxidation. With each cycle of β-oxidation two-carbon (C2) units are sequentially removed from the acyl CoA molecule and acetyl CoA, NADH and FADH2 are produced (Fig. 18.2). NADH and FADH2 subsequently donate their electrons in the electron transport chain generating ATP and being reoxidized to NAD+ and FAD in the process. Acetyl CoA is utilized in the TCA cycle as previously described. The splitting of C2 units from the parent acyl CoA molecule is repeated until the whole chain has been cleaved into the acetyl CoA molecules. The number of carbon atoms in the parent FA chain will determine the net energy yield from β-oxidation. Complete oxidation of one palmitic acid molecule produces 129 molecules of ATP. The pathways of anaerobic phosphorylation occur solely in the muscle cell cytoplasm, with no reactions in the mitochondria as there are for aerobic phosphorylation. However, in general mitochondria are no longer the once-thought uniform ATP-producing organelles, identical in all organisms, but are rather diverse and adapted to distinct conditions. Next to the classical aerobic mitochondria, which contain a respiratory chain and use oxygen as a final electron acceptor, anaerobically functioning mitochondria were identified that also contain a respiratory chain and perform oxidative phosphorylation, but do not use oxygen as a terminal electron acceptor. The energy metabolism in anaerobic mitochondria differs from that in aerobic mitochondria, as no external final electron acceptors are used (Tielens & van Hellemond, 2007). With the initiation of exercise there is a lag period before oxidative energy production becomes an important source of ATP. During this time rapid supplies of ATP must still be available if muscular contraction is to continue. Stores of ATP in skeletal muscle are limited (4–6 mmol/kg wet muscle) and contribute little to the total energy supply (Lindholm & Piehl, 1974; McMiken, 1983). Until aerobic phosphorylation makes a substantial contribution to energy supply, rapid regeneration of ATP must occur in the absence of O2. The anaerobic phosphorylation of ADP is achieved by three pathways: the phosphocreatine reaction, the myokinase reaction and anaerobic glycolysis. The former two pathways may be described as anaerobic alactic reactions because no lactate is produced as it is in the latter process (Clayton, 1991). In the gluteus medius muscle of Standardbreds, the size of the CP pool is estimated to be 15–20 mmol/kg wet muscle (Lindholm & Piehl, 1974; Lindholm, 1979). This source of ATP replenishment would support maximum intensity exercise for no more than a few seconds (Åstrand & Rodahl, 1986; Clayton, 1991). At rest, this reaction proceeds at an approximately equal rate in both directions with little net ATP being produced. In working muscle, AMP-deaminase reduces AMP concentration by converting it to ionosine monophosphate (IMP) and ammonia. This provides the driving force for the myokinase reaction towards the production of ATP (McMiken, 1983). Again this pathway only has the capabilities of providing small amounts of ATP. The anaerobic production of two molecules of pyruvate from one molecule of glucose or glycogen is identical to that described for aerobic glycolysis. In the absence of available O2, pyruvate accepts hydrogen atoms from NADH and is converted to lactate, rather than being converted to acetyl CoA and entering the TCA cycle. The reaction is catalyzed by lactate dehydrogenase and the regeneration of NAD+ during the reduction of pyruvate to lactate sustains glycolysis under anaerobic conditions (Fig. 18.2). The net result of anaerobic glycolysis is the production of three molecules of ATP from one molecule of glycogen or two molecules of ATP from one molecule of glucose. This form of energy production is relatively rapid compared to aerobic glycolysis but yields a significantly lower amount of ATP and substrates are limited. At the initiation of exercise, the immediate source of energy is locally available ATP (McMiken, 1983). As previously noted, this supply of ATP is limited and rapidly depleted, so for exercise to continue ATP must be replenished by other processes. Creatine phosphate and the phosphocreatine pathway provide the next rapidly available ATP source; however, this energy supply is also of limited capacity. The myokinase reaction provides a further means of regenerating ATP but it is restricted to certain muscle fiber types and is used in anaerobic exercise only when these fibers are recruited (Meyer et al., 1980). The myokinase reaction (and associated NH3 production) is believed to have a minor role in energy production overall. The glycolytic pathway with the production of pyruvate and lactate provides the main ongoing ATP source and reaches peak metabolism within about 30 s of the onset of exercise (McMiken, 1983). The delay in maximal glycolytic output is possibly due to the multiple and complex reactions required (McMiken, 1983). The large stores of glycogen in equine muscle (Lindholm & Piehl, 1974; Lindholm et al., 1974; Lindholm, 1979; Nimmo & Snow, 1983; Hodgson et al., 1984) allow this pathway to provide an early consistent source of energy, but still there is a finite limit to this substrate. On the other hand, this large store of glycogen in equine muscle might explain the fact that ketogenesis is a very limited pathway of energy production in the equine species (van der Kolk, 1995). Aerobic mechanisms for ATP replenishment represent the most efficient means of substrate production. However, it is the slowest pathway to respond to exercise demands, owing to the cardiovascular lag in supplying O2 to the cells and the intricacy of the reactions. Oxidative processes are in full production approximately 1 min after the onset of exercise and then muscular energy is more likely to be dependent on the rate of oxygen transport to the cells rather than substrate availability (McMiken, 1983). At rest and during low-intensity exercise (walking and trotting), aerobic pathways provide most energy requirements after the initial lag period (Åstrand & Rodahl, 1986). At this exercise intensity the ratio of ATP to ADP will be high; PFK will therefore be inhibited and β-oxidation of fatty acids will provide the main method for ATP regeneration (Hodgson, 1985; Lawrence, 1990). Such is the case during endurance rides where it is well recorded that blood concentrations of NEFA increase and the glycogen utilization rate is low (Lucke & Hall, 1980; Snow et al., 1982; Hodgson et al., 1983; Hodgson, 1985) (Tables 18.1 and 18.2). Table 18.1 Rates of glycogen utilization in horses performing various types of athletic activities *Millimoles glucose units per kg muscle per min (dry weight). †Millimoles glucose units per kg muscle per min (wet weight). Approximate figures for dry weight values are presented in parentheses. Adapted and reprinted from Hodgson, D.R. (1985) Energy considerations during exercise. Vet. Clin. N. Am.: Equine Pract. 1 (3), 447–460, with permission from Elsevier. Table 18.2 Adapted and reprinted from Hodgson, D.R. (1985) Energy considerations during exercise. Vet. Clin. N. Am.: Equine Pract. 1 (3), 447–460, with permission from Elsevier. As exercise intensity increases, ADP accumulates and this stimulates anaerobic glycolytic energy production with a dramatic increase in the use of CHO substrates (see Table 18.1). Galloping and bursts of intense exercise, such as during polo and jumping, rely heavily on anaerobic energy supply. The self-limiting nature of anaerobic power output (substrate exhaustion) means the horse can only maintain maximal speed for about 600–800 m. After this distance, energy supply falls back to the slower aerobic pathways, necessitating a reduction in speed of exercise (McMiken, 1983; Hodgson, 1985). Scientific data on the relationship between nutrition and equine performance has occupied the attention of many researchers; however, it is difficult to design controlled experiments that isolate nutritional influences on performance. Subtle, yet important effects of nutritional alterations may go undetected partly because the power of statistical studies is limited by the small numbers of horses often used in experiments (Hintz, 1994). The relationship between energy and exercise is complex and inseparable. The amount of energy required depends on the type and duration of activity and the horse’s body weight. Maintenance digestible energy (DE) requirements are linearly related to body weight (Pagan & Hintz, 1986a). During submaximal exercise energy expenditure is exponentially related to speed and proportional to the body weight of the riderless horse or the combined weight of the horse plus rider (Pagan & Hintz, 1986b). The method used by Pagan and Hintz (1986b) for calculating energy requirements was based only on the amount of work performed and may not account for any follow-on demands for energy in recovery that the work bout stimulates (Lawrence, 1990). The stores of major fuels in the horse for muscular contraction are outlined in Table 18.3 as calculated by McMiken (1983). It is clear that ‘fast’ energy stores (i.e. ATP, creatine phosphate and glycogen) are limited despite the high capacity for glycogen storage in equine muscle. The primary dietary sources of energy stores for the horse are soluble and fiber CHOs and fats. Protein is considered to play a minor role as an energy source. Table 18.3 Adapted and reprinted from McMiken, D.F. (1983) An energetic basis of equine performance. Equine Vet. J. 15 (2), 123–133, with permission from the Equine Veterinary Journal. Absorbed CHO is immediately available as an energy source in the form of blood glucose. Muscle and liver provide the reservoirs for excess CHO where it is stored as glycogen. Numerous studies have documented the depletion of muscle glycogen stores that occurs with exercise in the horse (Lindholm et al., 1974; Lindholm, 1979; Hodgson et al., 1983; Nimmo & Snow, 1983). The rate of, and percentage, depletion that results is a function of the intensity and duration of exercise. Muscle glycogen utilization/min is greatest at the faster speeds over shorter distances (Nimmo & Snow, 1983; Hodgson et al., 1984) (Table 18.1) but the total percentage of glycogen depletion increases with increasing duration of exercise (Snow et al., 1981, 1982; Hodgson et al., 1983). Liver glycogen stores are also depleted significantly during exercise (Lindholm et al., 1974; Lindholm, 1979). Restoration of depleted muscle glycogen stores takes up to 48–72 h in the horse (Davie et al., 1995; Lacombe et al., 2004), which is 2–3 times slower compared to man (up to 24 h). Recent research suggests that the low rate of glycogen synthesis in horses may be due to a reduced rate of absorption of CHO from the gastrointestinal tract, combined with reduced skeletal muscle glucose uptake compared to man (Waller & Lindinger, 2010). The rate of skeletal muscle glycogen uptake is determined by several factors among them the amount of initial muscle glycogen, carbohydrate availability, glucose transport into muscle and activity of glycogen synthase (GS). In man, glycogen synthesis in muscle post exercise occurs in two phases. During the first hour of recovery, there is a rapid insulin independent phase stimulated by glycogen depletion and contraction stimulated GLUT-4 translocation, followed by a slower insulin dependent phase with marked increased muscle insulin sensitivity up to 48 h (Price et al., 1994). Post exercise increases in insulin sensitivity facilitate rapid muscle glycogen synthesis after glycogen depleting exercise in man. However, in the horse no increase in insulin sensitivity could be found 24 h after a single bout of exercise in trained horses (De Graaf-Roelfsema et al., 2006; Pratt et al., 2007). In addition, no increase in crude muscle membrane GLUT-4 content was found after exercise inducing 40–50% glycogen depletion (Pratt et al., 2007; Nout et al., 2003). Glycogen synthase (GS) is activated by insulin binding to its cell surface receptor and the rate of GS synthesis is inversely proportional to muscle glycogen in contraction- and insulin-stimulated muscle in horses (Pratt et al., 2007) although less marked than in man. Although single bouts of exercise does not seem to influence glycogen replenishment rate, training and overtraining have been shown to influence peripheral insulin sensitivity. Several studies describe an increase in insulin sensitivity after training horses for a short period (Pratt et al., 2006, Stewart-Hunt et al., 2006). Also overtrained horses have been shown to increase insulin sensitivity (De Graaf-Roelfsema et al., 2012). The underlying mechanisms are not completely understood yet. Assimilated fats are stored as triglycerides (uncharged esters of glycerol) in adipose tissue and muscle. Quantitatively, adipose tissue constitutes the largest energy store in the body (see Table 18.3). Triglyceride concentrations in muscle are considerably less than in fat (Lindholm, 1979). The triglycerides are highly concentrated stores of energy because they are reduced and anhydrous (Stryer, 1988). The initial event in the utilization of triglycerides as an energy substrate is their hydrolysis by lipases to glycerol and free fatty acids (FFA). Lipolysis is stimulated by epinephrine, norepinephrine, glucagon and adrenocorticotrophic hormone and inhibited by insulin via hormone sensitive lipase. Glycerol is converted in a number of steps to Gl-3-P, which is an intermediate in both the glycolytic and gluconeogenic pathways. The FFAs undergo β-oxidation and enter the TCA cycle as previously described. Oleic, palmitic and linoleic acids (Robb et al., 1972; Westermann, 2008a) as well as 3-OH-butyric and 3-OH-iso-butyric acid (Westermann, 2008a) represent the major FAs in the equine species. Fat has been shown to be the major energy substrate during low-intensity exercise. This is best evidenced by a decrease in the respiratory exchange ratio (R) (McMiken, 1983; Pagan et al., 1987; Rose et al., 1991) and an increase in plasma NEFA concentrations (Lindholm, 1979; Rose et al., 1980; Essén-Gustavsson et al., 1991) that occurs with prolonged submaximal exercise. R is calculated by dividing the volume of carbon dioxide (CO2) expired by the volume of O2 consumed during exercise. R values around 0.7 indicate fat utilization whereas for CHO utilization the value is 1.0. Values within this range reflect various mixtures of FA and CHO metabolism. When anaerobic metabolism predominates R values will exceed 1.0 because lactate production is high, thereby adding to the CO2 load to be eliminated. In addition, in the equine species carnitine forms esters predominantly with short- and medium-chain fatty acids in plasma. Submaximal exercise in Standardbreds mainly affected concentrations of short-chain acylcarnitines (Westermann, 2008a). Digested protein is absorbed from the small intestine as amino acids and small peptides. When amino acids are available in excess of the animal’s requirements they may be broken down to provide energy. Degradation by deamination or transamination reactions occurs mostly in the liver, with the final product being acetyl CoA for utilization in the TCA cycle. Leucine, a branched-chain amino acid, may undergo oxidation directly in muscle (Lawrence, 1990). The contribution of amino acids to energy production during exercise is minor compared to that of CHO and FA (Åstrand & Rodahl, 1986), perhaps in the range of 1–15% (Lawrence, 1990). High protein diets (up to 16%) were once thought necessary to sustain the performance of mature equine athletes but now it is considered that approximately 10% protein in the diet is adequate (Snow, 1994). The main amino acids in equine plasma are serine, glutamine, proline, glycine, alanine, and valine. Training of Standardbreds reduced plasma concentrations of aspartic acid (Westermann, 2010). Many published reports have described the effect that altering components of the normal diet has on substrate utilization and performance in the horse. The consumption of large amounts of digestible CHO within a few hours of strenuous activity may depress the performance of that exercise (Åstrand & Rodahl, 1986). This is possible because insulin-stimulated uptake of blood glucose results in hypoglycemia and a greater dependence on muscle glycogen and therefore earlier onset of fatigue. Free FA mobilization is also inhibited by insulin. Frape (1988) summarized the effects of consumption of CHO or fat before or during exercise on metabolism, as depicted in Figure 18.3. On the other hand, a lack of available CHO during submaximal exercise can also limit performance and there is strong evidence supporting the use of high CHO diets by humans for endurance exercise (Lawrence, 1990). In humans, muscle glycogen loading was achieved by performing intense exercise and then consuming a CHO-rich diet (Lindholm, 1979). Current practice is to combine a program of decreased activity with increased CHO consumption a few days before competition to achieve a glycogen load. Glycogen loading in horses has been accomplished but no obvious improvement in work performance has been demonstrated (Topliff et al., 1983, 1985; Frape, 1988; Lawrence, 1990; Snow, 1994). Intravenous, but not oral, glucose supplementation has increased glycogen repletion rates after exercise (Snow et al., 1987; Davie et al., 1994, 1995; Snow, 1994). Although glycogen loading is not recommended in the horse adequate CHO intake must still be ensured (Hintz, 1994). A low CHO diet and regular exercise leads to glycogen depletion and decreased performance in horses (Topliff et al., 1983, 1985). In a study where fit Standardbreds were exercised strenuously for 3 consecutive days to achieve a 55% depletion of the muscle glycogen store, anaerobic, but not aerobic, capacity was impaired (Lacombe et al., 1999). However the association between glycogen depletion and impaired anaerobic metabolism is not conclusive as confounding effects of other exercise-induced changes on performance could not be eliminated (Lacombe et al., 1999). When muscle glycogen was depleted by 22% there was no significant effect on performance of Thoroughbreds exercising at high intensities (Davie et al., 1996). A CHO supplement taken an hour or two before exercise does not seem to benefit endurance performance but intake of glucose during exercise may supplement waning plasma concentrations and delay onset of fatigue (Lawrence, 1990) (see Fig. 18.3). The beneficial effects of feeding high-fat diets to horses remains shrouded in controversy. Differences in the condition of the horses, type of exercise, the length of the adaptation period to the diets, the type of fat used as the supplement, and the level of fat supplemented, particularly in relation to CHO, make comparing the published results difficult (Lawrence, 1990; Hintz, 1994). Many variations in study designs influence results obtained. Feeding an increased level of fat is suggested to cause metabolic adaptations like increase in equine heparin-released lipoprotein lipase activity (Geelen et al., 2001) that permits horses to preferentially utilize fat and spare glycogen during exercise but the evidence to support such a proposal is inconclusive (Lawrence, 1990; Hintz, 1994; Snow, 1994; Geelen et al., 2000). Furthermore, it should be realized that dietary soyabean oil depresses the apparent digestibility of fiber when substituted for an iso-energetic amount of cornstarch or glucose (Jansen et al., 2002). It has been suggested that improvements in oxidative capacity can be brought about by certain amino acid supplements (Lawrence, 1990; Hintz, 1994). Higher than necessary protein diets are often fed to performance horses but studies to indicate that this practice enhances exercise capabilities are lacking (Lawrence, 1990). On CHO-rich and fat-rich diets, plasma concentrations of glucose, ammonia, lactate, alanine and the muscle concentrations of G-6-P and lactate were higher at the end of exercise compared to normal diets (Essén-Gustavsson et al., 1991). Higher pre-exercise muscle glycogen concentrations and FFA concentrations were present in the horses fed a CHO-rich diet when compared to the fat-rich and normal-diet fed periods. No significant difference in performance during trotting at submaximal intensity on a horizontal treadmill was detected between the three diets (Essén-Gustavsson et al., 1991) with the average time to fatigue being 51–56 min. Whether or not the diets would alter performance in shorter or longer exercise periods remains unanswered. The effects on protein metabolism need to be further investigated as both the CHO-rich and the fat-rich diets were associated with significant increases in branched-chain amino acids in the plasma during and at the end of exercise compared to the normal diet (Essén-Gustavsson et al., 1991). The resting plasma concentration of the branched-chain amino acids was increased 26% on the fat-rich diet but only 8% on the CHO-rich diet. A 9% (control) or 18.5% (high) crude protein diet had no effect on hepatic or muscular glycogen utilization and did not affect exercise performance in Quarter Horses exercising at submaximal intensities (Miller-Graber et al., 1991). Performance of Arabian endurance horses was not augmented by excessive protein in their diet (Hintz, 1983). In contrast, Standardbreds fed a high-protein diet (20%) or high-fat diet (15% soybean oil) showed greater muscle and liver glycogen utilization during prolonged exercise compared to when fed a control diet of 12% crude protein (Pagan et al., 1987). During higher-intensity, shorter-duration exercise, glycogen utilization was less when horses were fed the high-protein or high-fat diets. Of interest, there was no difference in concentrations of various plasma amino acids in overtrained Standardbreds and age-matched controls (Westermann, 2010). The timing of feeding and what to feed before exercise has considerable influence on the metabolic and physiological responses to exercise (Lawrence et al., 1995; Harris & Graham-Thiers, 1999). In one study, it was concluded that feeding only hay shortly before exercise would not adversely affect performance but feeding grain would, and that therefore grain should be withheld (Pagan & Harris, 1999). Of course, many other nutritional components not discussed in this chapter may play roles in equine performance (Marlin & Nankervis, 2002; Hinchcliff et al., 2004). These include water, electrolytes, acid–base balance, minerals and vitamins. The oxygen consumed by the body at a given time is a measure of the body’s total aerobic metabolic rate and is termed the oxygen uptake (V.O2). Units of measurement are usually milliliters of oxygen per kilogram of body weight per minute (mL/kg/min) or liters per minute (L/min), therefore representing a rate of consumption and not a finite capacity. The maximum rate of oxygen uptake is called the V.O2max. Oxygen consumption by the body is principally a function of the cardiorespiratory system to supply oxygen and the capacity of end organs to utilize oxygen. The sequence of events is described as the oxygen transport chain (Fig. 18.4). It is influenced by the O2 concentration in the air, ventilation of the lungs, diffusion of O2 through the alveolar wall, circulatory perfusion of the lungs and affinity of hemoglobin (Hb) for O2, distribution of O2 to the periphery by the circulation, extraction by the end organ (muscle) and, finally, O2 utilization by the mitochondria. A large number of physiological variables contribute to the capacity of the oxygen transport chain. At rest, V.O2 is in the order of 3–5 mL/kg/min or 1.5–2.5 L/min for a 500-kg horse (Thornton et al., 1983; Eaton, 1994). It can be difficult to accurately obtain a basal V.O2 prior to exercise as often horses are excited in anticipation of impending activity. Therefore a resting V.O2 level of 2 mL/kg/min may be more realistic (Eaton, 1994). There is a well-established linear relationship between V.O2 and the speed of exercise at submaximal intensities in horses (Hoyt & Taylor, 1981; Hörnicke et al., 1983; Evans & Rose, 1987, 1988a; Rose et al., 1990a; Eaton, 1994) and humans (Åstrand & Rodahl, 1986). When speed increases such that V.O2max is approached, this linear relationship is lost as V.O2 plateaus and anaerobic sources of energy production become significant. In addition, if horses exercise at unnatural (extended or restricted) gaits the linear relationship will be lost due to a loss in economy of locomotion (Hoyt & Taylor, 1981; Eaton, 1994; Preedy & Colborne, 2001; Wickler et al., 2001; Griffin et al., 2004). Few equine sports are performed without the horse carrying an extra load in the form of a rider or driver. Oxygen consumption (or energy expenditure) increases in proportion to the load carried (Taylor et al., 1980; Pagan & Hintz, 1986b; Thornton et al., 1987; Gottlieb-Vedi, et al., 1991). Taylor and colleagues (1980) reported that when a 10% load was added to the horse when trotting, V.O2 increased approximately 10% and this direct proportionality was consistent for loads between 7% and 27% of the horse’s body mass. A direct proportionality between load and V.O2 was also demonstrated for trotting rats, trotting and galloping dogs and running humans (Taylor et al., 1980). As a consequence, small animals use more oxygen and expend more energy to carry each gram of a load a given distance than do large animals, be it their own body mass or an additional load carried. Pagan and Hintz (1986b) demonstrated that a 450-kg horse with a 50-kg rider would expend the same amount of energy as a 500-kg horse. Thornton and colleagues (1987) found no significant difference in the oxygen cost per kilogram per meter traveled between loaded and unloaded horses. The increase in V.O2 due to load is achieved largely by an increase in ventilation until maximum tidal volume is approached (Thornton et al., 1987) and this is readily explained by the close and linear relationship between V.O2 and pulmonary ventilation (Hörnicke et al., 1983; Gottlieb-Vedi et al., 1991). The degree of incline on which exercise is being performed has a significant impact on V.O2. For Standardbreds, trotting on a 6.25% inclined treadmill at an average speed of 5.2 m/s, V.O2 increased from a mean of 17.7 L/min on the flat to 31.1 L/min on the slope (mean change of 13.4 L/min; 76%, p <0.001) (Thornton et al., 1987). The addition of a load when doing the inclined exercise did not significantly add to the oxygen cost of the exercise. Thoroughbreds exercising on a treadmill at speeds of 1–13 m/s also showed a substantial increase in V.O2 when the treadmill slope was elevated from 0–5% and 10% (Eaton et al., 1995a). Exercising on a 10% slope can double the energy expenditure at some speeds. When trotting on an inclined treadmill over a range of speeds, V.O2max is higher during inclined than level running (McDonough et al., 2002) and a greater volume of muscle would have to be recruited to generate an equivalent force for body support, which is reflected in significant increases in the EMG intensity (IEMG) of muscles (Wickler et al., 2005). In addition, normal training in Standardbreds resulted in a significant adaptation of quantitative needle electromyography (QEMG) parameters. Compared with normal trained controls, intensively trained Standardbreds showed a stronger adaptation (e.g. higher amplitude, shorter duration and fewer turns) in QEMG variables resembling potentially synchronization of individual motor unit fiber action potentials (Wijnberg et al., 2008). Wickler et al. (2004) found that the costs of swinging the limbs in the horse are considerable and the addition of weights to the distal limb can have a profound effect on not only the energetics of locomotion but also the kinematics, at least in the hind limb. Thus, they proved that the use of weighted shoes, intended to increase animation of the gait, increases the metabolic effort of performance horses a disproportionate amount. The additional mass also increases the joint range of motion and, potentially, the likelihood of injury. The terrain of endurance rides and cross-country tracks in three-day events ensure that much work up and down gradients will be performed and this will play a large role in determining energy expenditure. Little investigation has been done regarding the effect of a downhill gradient on energy expenditure in horses but in humans the energy cost of moving down a slope decreases up to a certain steepness and then becomes more expensive compared to level exercise (Åstrand & Rodahl, 1986). The effect that duration of exercise has on V.O2 has not been frequently investigated. Rose and Evans (1986) monitored cardiorespiratory and metabolic alterations during 90 min of submaximal exercise in Standardbreds. The horses trotted on a slope of 2% at 3 m/s. Many of the respiratory variables measured, including V.O2, reached a steady state within 5 min of the start of exercise and remained stable for the duration of the exercise period. Oxygen consumption from 5 min onwards did not alter significantly until a slight decrease was identified at 90 min. It was proposed that fluid and electrolyte losses in the sweat, contributing to thermoregulatory and circulatory problems, would be key factors in the horse’s ability to perform endurance activity (Rose & Evans, 1986). Naturally, the intensity of exercise will be a determinant of the duration of any activity. Track surfaces may affect the economy of locomotion due to altered stride patterns (change in frequency and length of stride) in slippery, uneven or ‘heavy’ conditions. Quantifying track effects on energy expenditure is difficult but Thoroughbreds and endurance horses have longer race times in heavy conditions (Eaton, 1994). Different treadmills also influence the energetic cost of locomotion: it costs less energy for horses to walk, trot or canter on a stiffer treadmill than on a more compliant treadmill (Jones et al., 2006).
Metabolic energetics
Introduction
Production of energy
Aerobic phosphorylation
Aerobic glycolysis
Fatty acid utilization
Anaerobic phosphorylation
Phosphocreatine reaction

Myokinase reaction

Anaerobic glycolysis
Energy pathway contributions in the exercising horse
Energy substrates
Carbohydrates
Fat
Protein
Effects of dietary alterations on energy substrate utilization
Energy expenditure
Aerobic power
Oxygen uptake
Oxygen uptake at rest and during submaximal exercise
![]()
Stay updated, free articles. Join our Telegram channel

Full access? Get Clinical Tree