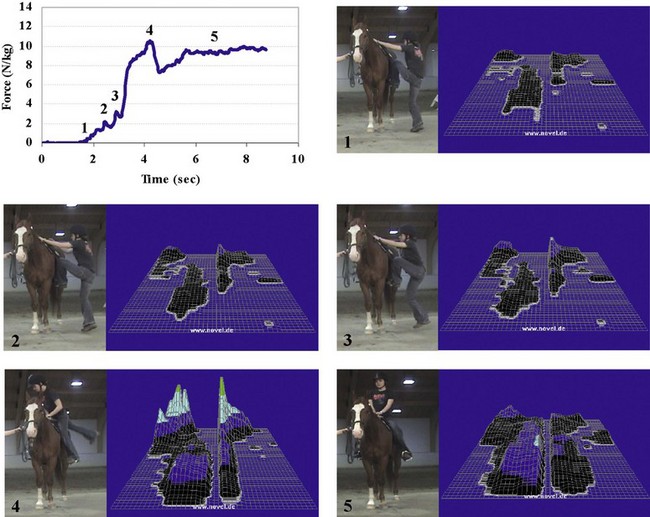
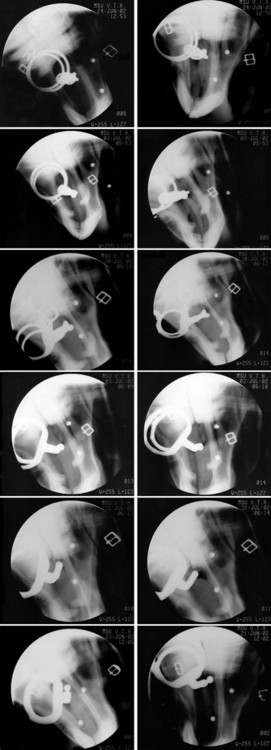
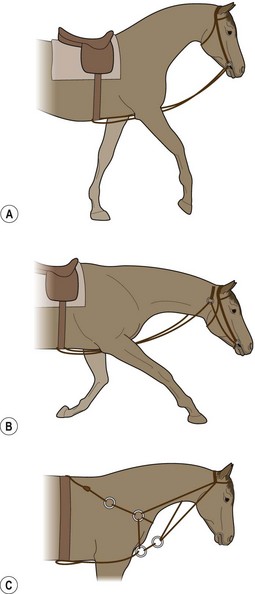
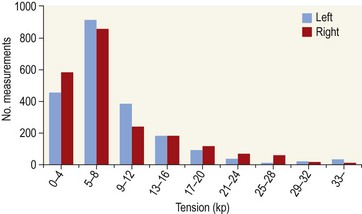
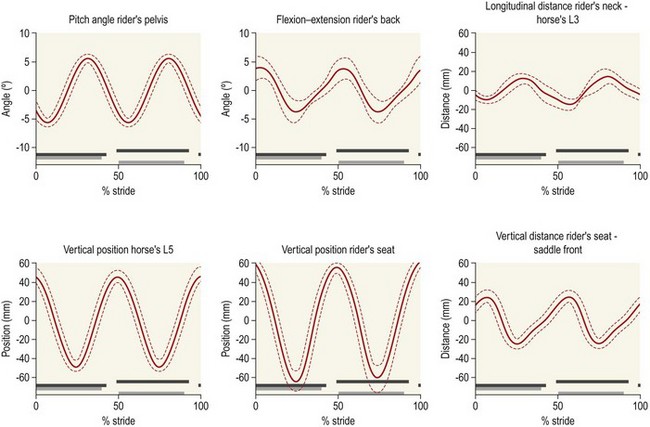
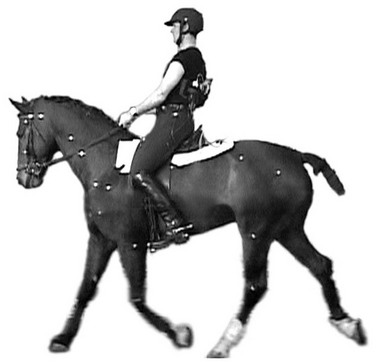
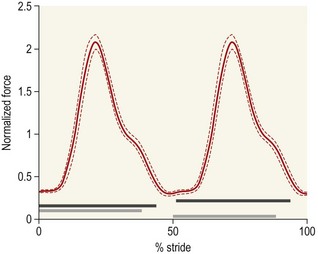
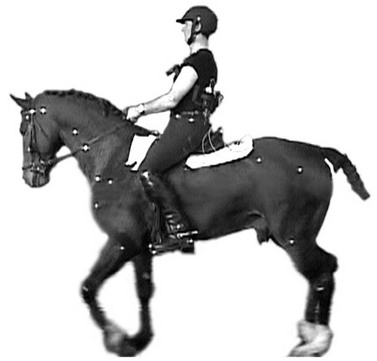
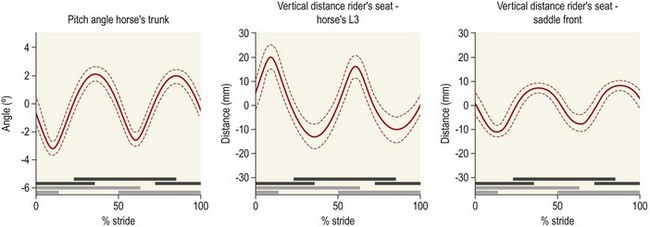
Chapter 15 The most obvious way to study the seat in an objective and quantitative way is to use a saddle pressure mat. There are today several brands on the market that can be used for measuring pressure between the horse’s back and saddle dynamically. Though this equipment has been available for many years, the first peer-reviewed paper was published in 1994 (Harman, 1994). One reason that relatively few papers have been published might be the difficulties in obtaining good quality, quantitative data using this technology. There are several problems including relatively poor performance in terms of accuracy and drift. The published papers mainly deal with maxima, local peaks or mean forces, which are a very limited part of the total information registered by the pressure sensitive mats which usually consist of between 256 and 2000 sensors, each sampling at up to several hundred samples per second. The variability between strides makes it useful for the interpretation to calculate a mean stride for each experimental situation, which has not been generally done so far. Mat slip can be an issue and the correct position has to be checked before and after measurement. Placement of the mat relative to both the horse’s back and the saddle needs to be defined in a standardized way. In most of the studies to date the mat data has been used and presented in a qualitative or semi-quantitative way. The mats may be difficult to calibrate and the software that handles the data needs further development. There is a need for standardized methods of presenting, analyzing and comparing saddle mat measurements (see also Chapter 2). The following paragraphs describe studies in which the saddle mat has been used scientifically to study the interaction between the rider, saddle and horse’s back. Saddle pressure measurements have also been used to confirm the association between clinical evidence of back pain and pressure peaks acting on the horse’s back (Werner et al., 2002; Nyikos et al., 2005; von Peinen et al., 2010) but these studies will not be further elucidated here. De Cocq et al. (2006) calculated a correlation coefficient between total measured force and the weight of 28 different riders, using paired measurements with defined air-pressure inside the panels of the saddle in standing horses. Total force correlated well with the weight of the rider and the results within trials agreed well, but for trials in which the saddle mat was removed and replaced the agreements varied from poor to excellent. The results indicated that highly standardized conditions were necessary to obtain useful and valid results and that further technical development is necessary. Better results, relative to agreement between different measurement conditions basically measuring the same things, was found in another study using a different type of saddle mat (de Cocq et al., 2009a). Different rider positions were evaluated and the mat registered increased force beneath the saddle in the direction towards which the rider was leaning (de Cocq et al., 2009a). Therefore, the mat could discriminate between rider positions and asymmetrical weighting of the saddle. A study of forces on the horse’s back during mounting showed that the highest forces coincided with the rider’s free leg swinging up and over the horse’s back. When the rider mounted from the conventional (left) side forces were highest on the right side of the horse’s back adjacent to the withers. High forces were also found lower on the left shoulder. Heavier riders yielded higher forces (Geutjens et al., 2008). The use of a mounting block produced a smoother force application and lower peak force (Fig. 15.1). In light of these findings it is recommended that, if possible, the rider should mount without using the stirrup to avoid the asymmetrical loading of the horse’s back. If this is not possible, it is recommended to use a mounting block and mount alternately from the left and right sides. With the use of pressure sensitive saddle mats, the influence of the saddle on the horse’s back can be studied while moving at different gaits. However, there is only a weak association between the saddle pressures acting on the back in a standing horse and those exerted during movement (Jeffcott et al., 1999). Total saddle force curves show a characteristic, gait dependent pattern (Pullin, 1996; Jeffcott et al., 1999; Fruehwirth et al., 2004; von Peinen et al., 2009). Fruehwirth et al. (2004) registered force data from quarters of the saddle mat in horses ridden at walk, trot and right lead canter (12 horses and 12 riders) and found that force patterns were reproducible from stride to stride in each gait and force magnitude increased with speed. On the contrary, de Cocq et al. (2004) evaluated nine Dutch Warmbloods walking, trotting and cantering on a treadmill in an unloaded condition, wearing a surcingle, a saddle or a saddle plus 75 kg weight. The most marked changes occurred with the addition of extra weight; the horse’s back moved through the same range of motion but with more extension and less flexion. Fewer changes were seen when comparing an unweighted saddle with the unsaddled situation. Forelimb retraction increased in walk and trot when the horse had a weighted saddle compared with a saddle, a surcingle or unloaded. Increases in both forelimb retraction and hind limb protraction are mechanisms that counteract back-extension, so the increase in forelimb retraction is likely to counteract over-extension of the back (Jeffcott, 1979). Early studies using a pressure mat evaluated various saddles qualitatively (Harman, 1994). Werner et al. (2002) studied two types of dressage saddles in 25 horses ridden by the same rider in various gaits. They found differences between saddles and horses and smaller differences with gait. It was suggested that mean pressure >15 kPa and maximal pressure >35 kPa at sitting trot correlated with back pain. Further, patient horses (n = 25) with various degrees of and reasons for back pain were evaluated with an interval of at least 12 weeks, during which time saddlery problems were corrected based on saddle mat data (Mönkemöller, 2005). Qualitatively, improvement was judged to be significant based on distribution and magnitude of pressure. In a study comparing an English saddle with a side saddle, horses (n = 13) without clinical signs of back-pain were evaluated at walk, trot and canter using a saddle mat and kinematic measurements of back movement both in front of the withers and behind the saddle (4th lumbar vertebra, L4). The results showed asymmetrical loading under the side saddle with the center of pressure located to the right of midline and slightly more caudally than the center of pressure under the English saddle in all gaits. The sidesaddle also influenced back movement. The authors suggested that the two saddle types could be used to change the load distribution on the back of horses with potential back pain and as a training variation (Winkelmayr et al., 2006). In racehorses (n = 8), no difference was found between saddles with a normal tree, a flexible tree or treeless relative to the stipulated critical pressure on the lower thoracic back at canter and gallop (Latif et al., 2010), which was the main concern. However, loading and peak pressures were relatively high at the withers during cantering and galloping but shifted toward the mid and rear regions while trotting. The authors concluded that the type of tree had no influence on the pressure profile at the rear of the saddle and that the high peak pressures at the rear of the saddle in trot with all saddles may limit back motion. The pressure distribution in trot and gallop was mainly due to jockey position. The high pressure under the rear of the treeless saddle, as well as the saddle with the flexible tree, was directly beneath the rider. With respect to the treed saddle, it was due to an improperly-fitting tree or cushioning. The kinematics of horses (n = 21) ridden by one rider on a treadmill at trot with either a well-fitting or ill-fitting saddle (Peham et al., 2004), were documented using three saddles, and two kinematic markers (L4 and right fore hoof). Variability of the motion cycles was calculated as well as the derivates (velocities and accelerations) in the x, y, and z directions. With a rider the variability of velocity and acceleration in the forward direction and acceleration in the transverse direction decreased with a well-fitting saddle compared to an ill-fitting saddle. Meschan (2007) tested differently fitting saddles with a pressure mat and concluded that the load under poorly fitting saddles is distributed over a smaller area than under properly fitting saddles, leading to potentially harmful pressure peaks. Typical pressure profiles for saddles with correct, wide and narrow trees were shown. Von Peinen et al. (2010) demonstrated that the mean and maximal saddle pressure in walk, trot and canter were larger in 23 horses with clinical evidence of ill-fitting saddles compared to 16 control horses. Pressure was measured at the areas of dry spots (dry non-sweating areas that sustained local ischemia due to high saddle pressure) or acute soreness in the withers area in the horses with the problems and compared to the same areas in the control horses. The results indicated that mean pressure was more repeatable than maximal pressure and was, therefore, a more reliable variable for assessing saddle fit. Similar to the decubitus ulcer probem in people, critical values could be established for different levels of saddle sores in the withers area. Such critical values would help fitting saddles in the future. In her pioneering work Harman (1994) looked at saddle fit of equine patients and evaluated the effects of 14 different pads on one rider–horse combination, concluding that many pads make the pressure distribution worse compared to using a simple cotton pad. Pullin et al. (1996) evaluated two saddles, two horses and 14 pad-liner combinations. Both static and dynamic measurements and results were evaluated qualitatively. Repeatable differences were seen between the tested pads leading the authors to recommend that dynamic evaluations were more useful, and that static scans without riders should not be used for optimal saddle pad evaluation. A study of how the fit of a saddle with a tree that was too wide was affected by using a pad made of gel, leather, foam or reindeer fur was undertaken in one rider who rode 18 horses in trot and walk. All pad-saddle combinations were compared to the saddle without pad. In many pad-saddle-horse combinations, maximal overall force increased when using a pad and the pressure differences between adjacent areas of the saddle often did not decrease. The potential benefits of using a pad need careful consideration in horses with back problems (Kotschwar et al., 2010a,b). De Cocq et al. (2006) documented that the force beneath the rear part of the panels could be measured more reliably than the force beneath the more forward part of the panels because of the inclination of the horse’s back. The sensors measure force applied perpendicular to their surface but shear forces give cross-talk to the measurements, i.e. the forces will not be correctly measured. This means that a larger part of the force is captured in areas of the back that have a more horizontal inclination. As a consequence of the shape of the back on either side of the withers, forces are likely to be underestimated by a larger amount in this area. Another study examined saddle pressure patterns during riding in trot and canter, comparing traditional and v-system girth strap placement, and wool and synthetic foam panel flocking material (six horses, three riders) (Byström et al., 2010a). Controlling for speed, stride maximum pressures below the hind part of the saddle increased by 7–12% and the area below the saddle with a stride mean pressure >11 kPa increased by 114 cm2 at trot and 127 cm2 at canter with foam-filled panels compared with wool-stuffed panels. With the v-system girthing the area with pressure >11 kPa increased by 53 cm2 and 38 cm2. It was concluded that both flocking material and girthing are relevant considerations in saddle fitting. In this study, wool performed better than foam as panel flocking material and traditional placement of the girth was better or at least as good compared to the v-system. Clayton and Lee (1984) described the use of a fluoroscopic technique to evaluate bit position, the interactions of the bit with the intra-oral tissues and the effects of rein tension on bit position. This technique was applied in a further study of a variety of bits that varied in shape and mechanical action (Clayton, 1985). It was shown that bilateral rein tension caused the bits to indent the tongue. Horses accepted the bit quietly with minimal intra-oral motion when the bit was adjusted so that there were one or two small wrinkles at the commissures of the lips. When the cheek pieces were adjusted to allow the bit to lie lower on the tongue or when the bit was considerably wider than the distance between the oral commissures the horse could move the bit around more freely within the mouth and tended to show more movements of the tongue that could be interpreted as resistances (Clayton & Lee, 1984). With some bits it was possible to restrict the movements of the mouthpiece, for example, using keepers on a cheek snaffle. For some bits the severity of their action depended on their orientation within the oral cavity, such as the reversible Dr. Bristol bit. In the equestrian literature, when using the double bridle, the bridoon (or bradoon) and the curb are said to have quite different actions, the bradoon lifts and extends the neck while the curb is described as having a leverage effect and powerful action on the bars (Karl, 2008). However, in this study the bradoon of the double bridle moved with the curb, suggesting that the effect of the bradoon and the curb would be somewhat hard to separate within the oral cavity though the horse’s sensation likely differs between the actions of the bits (Clayton, 1985). A further study using lateral-view radiographs (Manfredi et al., 2005b) described the positions of six bits relative to the horse’s palate and second premolar teeth with and without 25-N rein tension which is equivalent to peak tension recorded in horses trotting with side reins adjusted to the resting length of the horse’s neck (Fig. 15.2) (Manfredi et al., 2005b). Both with and without rein tension, the bits varied in their proximity to the premolars, and angulation of the cannons. Rein tension moved the mouthpiece away from the palate by indenting the horse’s tongue. The amount of time spent with the mouth quiet, gently mouthing the bit, opening the mouth, using the tongue to raise the bit between the cheek teeth and displacing the dorsum of the tongue over the bit were measured. The horses’ intra-oral behaviors with these six bits were evaluated with a loose rein and with 25 N tension. When rein tension was applied, the time spent with the mouth quiet or gently mouthing the bit decreased and the time spent in the other behaviors increased. The behaviors differed significantly between horses but not between bit types (Manfredi et al., 2010). It has been suggested that horses are unable to swallow when wearing a bit (Cook, 1999). However, Manfredi et al. (2005a) performed an endoscopic study of horses cantering on a treadmill with tight side reins to maintain poll flexion while wearing a halter, a bitless bridle, a loose ring jointed snaffle and a Myler bit. Swallowing occurred frequently under all four conditions. Auxiliary reins, defined as reins other than simple inelastic reins passing directly from the rider’s hand to the bit, differ widely in their popularity among riders. Many see them as coercive, because they most often force the horse’s head in a downward direction, with some types being perceived as having a more severe effect. Other trainers use them for a short time as temporary aids to provide better long-term control of the horse’s head and neck position (see more on this under collection below). For example, with draw reins the rider can pull the horse’s head downwards and backwards to its anatomical limit, whereas upwards movements are restricted by a running martingale in which the reins slide freely through loose rings that are held in place by a neck strap attached to the girth. The rings control the line of action of rein tension and prevent the head of the horse coming above the base of the skull. A few auxiliary reins have been compared (Biau et al., 2002) or evaluated (Roepstorff et al., 2002; Byström et al., 2006; Heleski et al., 2009) but more information is needed to provide a comprehensive picture. In a study of eight saddle horses, normal reins were compared with three types of auxiliary reins (Fig. 15.3), using accelerometers attached at the sternum and sacrum as the horses walked and trotted unridden in a horse walker (Biau et al., 2002). The reins were: ‘rubber bands’ going from the lowest point of the girth to the bit; a ‘Chambon’ going from lowest point of the girth through a pulley at the poll area to the bit; and ‘back lifts’ that were attached to the sides of the girth by a double mechanism, and to the poll. Rubber bands increased propulsion (i.e. the mean acceleration vector used for propulsive work) of the forelimbs at trot. Back lifts increased forelimb propulsion and dorsoventral activity at walk and trot (i.e. the FFT-integrated power spectrum signal of the dorsoventral acceleration signal). Chambons increased hind limb propulsion and forelimb propulsion and hind limb dorsoventral activity at trot. The authors’ interpretation was that a Chambon was likely the most effective if the aim was to increase hind limb activity in a long and low position. Draw reins used alone or in combination with normal reins were compared to normal reins only in horses ridden at trot on sand-covered asphalt over a forceplate (Roepstorff et al., 2002). The body weight was shifted caudally only when draw reins were used with normal reins (Byström et al., 2006). Kinematic analysis of the head angle, measured on the front of the nose relative to the horizontal plane (angles >90° equals nose in front of vertical), was different in all situations. With draw reins alone it was ~97°, combining draw reins with normal reins it was ~109°, while with normal reins it was ~116°. With draw reins forelimb retraction was increased at hoof lift. The hip joint extended more quickly and the hock joint flexed more with both reins compared to normal reins only. The pelvis was more horizontally inclined when draw reins were combined with a normal rein in comparison with draw reins alone, but the hip joint angular pattern was not significantly different between these conditions. It was concluded that the riders were, to a certain extent, able to shift weight towards the hind quarters with the combination of reins. An important finding, though, was that when using the draw rein alone to simulate an overuse of the draw rein, the horse’s weight shifted to the fore quarters. So, when used incorrectly draw reins had the opposite effect from that which is intended and the caution to use draw reins with the utmost care (Podhajsky, 1965) seems to be scientifically validated. From a technical point of view it is quite simple to measure rein forces acting between the hand of the rider and the bit. However, it is important to use appropriate force transducers for dynamic measurements; transducers based on a spring will not provide accurate force data and will underestimate forces when used in a dynamic system. Interpretation of the data can also be problematical due to the inherent variability associated with a pattern of spikes that are characteristic of each gait (Clayton et al., 2005). The mean tension ignores this inherent variability. A more detailed and informative approach measures the forces as minima, maxima and means with standard deviations. The force distribution can be mapped over time and compared between left and right reins. However, the force cannot be partitioned between horse and rider using this method. Some studies have presented forces in weight units (see below), but for the sake of comparison we have here assumed that 1 kg (weight) equals 9.8 N (force). In pioneering work, it is stated that unexpectedly large rein forces were found, 5–75 N, up to maximal 150 N, on each rein. Most riders, using double bridles, used forces of around 5 N at halt increasing to 20 N at canter (Preuschoft et al., 1995). In further work, different types of riders were compared (Preuschoft et al., 1999). Very low rein tensions were found for western riders, for riders riding only on the curb and at a few dressage stables where forces registered below or just above 20 N, when performing demanding exercises. In other dressage stables, mean forces ranged from 59 to 147 N, without any difference between single and double bridles. Peak force during regular work was below 49 N in driving horses, 98–176 N during dressage training rising to 245 N when slowing down from canter. In trotters moving at high speed, forces up to 392 N were found (Preuschoft et al., 1999). Cartier d’Yves and Ödberg (2005) studied right rein tension during a dressage test performed by three riders and 30 horses, including riding school horses, leisure horse and professional competition horses. Mean rein tension was approximately 13 N in riding school horses and 9.8 N in leisure horses, with intermediate values in the professional competition horses. Mean rein tension values were not statistically different between groups. Additionally, judge’s or rider’s subjective evaluation of lightness did not correlate with actual measurements of mean rein tension. Clayton et al. (2003) also report that the rider’s perceptions of rein tension differed from the registered forces in one horse. In further work by the same author, one experienced rider rode one horse, chosen because it was known to lean against the bit. Although the rider perceived a constant rein tension, in walk there were regularly occurring spikes with a frequency of 108 per min, in trot 168 spikes per min and in canter 90 spikes per min (Clayton et al., 2005). The maximum values of the rein tension ranged from 4 to 43 N at walk, 19 to 51 N at trot and 21 to 104 N at canter. In this rider, synchronized video analysis showed that peak rein tension occurred during diagonal stance in both trot and canter, which coincided with downward motion of the horse’s head. Rein tension and the steadiness of the hand were evaluated in four horses and nine novice riders (Heleski et al., 2009). Three experimental conditions were studied: running martingales that stabilized the angle of the rein to the horses mouth during riding, elastic rein inserts that yielded if tension exceeded 20 N, which happened very rarely in this study (in 0.6% of the spikes evaluated), and controls without either rein aid. Conflict behaviours of the horse, evaluated using an ethogram, did not differ between experimental conditions. Mean rein tension was highest for the condition with running martingales (4.1 N with a martingale versus 3.5 N for both rein inserts and controls). The authors suggested that carefully fitted running martingales may be advantageous for novice riders on the basis that the head position of the horse was less often judged as unacceptably high. It is suggested by many riders and veterinarians that a somewhat lower head position actually spares the locomotor health of the horse. The rein tension of three horses, ridden by their own expert rider on a treadmill, was studied at walk, trot and passage (Roepstorff, unpublished). In the vertical head-neck position, data from both reins averaged over four trials, showed that the three horses had different mean low and high values of 11 N and 16 N, 1.5 N and 3.5 N, and 2.7 N and 4.8 N. Mean rein tension increased with increasing collection (as determined by the head and neck position). This is contrary to most riding texts and to the concept that rein contact should be able to be dropped in collection (descente de main) with the horse remaining in the collected movement/position when rein contact is released (Decarpentry, 1949). In walk, trot and passage the mean rein tension was higher in eight of nine comparisons when the head and neck were in the vertical (competition) position compared with positions slightly behind the vertical, with a low neck or with a neck elevated and the bridge of the nose in front of the vertical. On the contrary, all three horses had a much lower mean rein tension when walking with the neck low and forward compared with the competition position. The maximal peaks in walk were found at contralateral hind limb stance and in trot there was one peak in each rein at stance, which agrees with the results found by Clayton et al. (2003, 2011). In walk and sitting trot, rein tension was generally lower in one of the reins in two of three horse–rider combinations. A typical example from the vertical head–neck position in one of the horses is shown (Fig. 15.4), where the right rein more often has lower tension, while the opposite pattern is seen for the two next bars. This is further evidence of motor laterality, but the data cannot detect whether it comes from the horse, the rider or both. In rising trot the tendency was that the tensions in both reins were higher for the diagonal on which the rider was sitting, compared to the diagonal on which the rider rose. Warren-Smith et al. (2007) studied one professional, one intermediate and one novice rider on 22 horses performing a simple dressage test under saddle and the same horses being long-reined by a professional handler. Mean rein tension during riding was 7.4 N and during long-reining 10.7 N. Rein tension was highest when halting and higher when turning compared to riding on straight lines. When horses were ridden, tension in the left rein when turning left was higher than the tensions in either rein when turning right, which could be interpreted as evidence of motor laterality in the rider or the horse. The novice rider used more tension for turning. Tension did not differ between bridles and halters. Tensions were higher in ex-racehorses compared to other horses. In an effort to separate the effects of horse and rider on rein tension, Clayton et al. (2011) studied the tension in side reins made of three materials with different amounts of elasticity and adjusted to three lengths. The materials were inelastic, stiff elastic and, compliant elastic. The rein lengths were neutral (equal to the length of the horse’s neck when standing in a relaxed position), long (10 cm longer than neutral) and short (10 cm shorter than neutral). Horses (n = 8) trotted in hand at consistent speed in a straight line wearing a bit and bridle with the three types of side reins being evaluated in random order. Strain gauge transducers (240 Hz) measured rein tension dynamically and the authors reported minimal, maximal and mean rein tension, rate of loading and impulse. Rein tension oscillated in a regular pattern with a peak during each diagonal stance phase. Within each rein type minimal, maximal and mean tension were higher with shorter reins. At neutral or short lengths, minimal tension increased and maximal tension decreased with a more elastic rein. Short, inelastic reins had the highest maximal tension and highest rate of loading. Since the tension variables responded differently to rein elasticity at different lengths, it was recommended that studies of rein tension should report a set of variables representing different aspects of rein tension. Of the three basic gaits, trot is the gait at which rider movements have been most extensively studied, particularly the sitting trot, although rising trot has also been evaluated and compared with sitting trot. A number of studies describe aspects of the basic rider movements (Schils et al., 1993; Terada, 2000; Terada et al., 2004, 2006; Peham et al., 2001; Matsuura et al., 2003, 2005; Lovett et al., 2005; Lagarde et al., 2005; de Cocq et al., 2010a; Byström et al., 2009, 2010b; Symes & Ellis 2009; von Peinen et al., 2009) mostly at trot and, to a lesser extent, at walk and canter. Starting with rider movements at trot, one of the fundamental questions addresses the characteristics of the trot that the rider must react and adapt to. The trot is a regular symmetrical gait with diagonal hoof placement in which each diagonal stance encompasses a braking phase when the horse’s limbs are compressed and a propulsive phase when the horse’s limbs extend (Farley et al., 1993). The horse keeps its back rigid through strong muscle activity to resist wasteful lateral and rotational movements induced by the diagonal stance (Robert et al., 1998; Faber et al., 2001). Accordingly it can be expected that the movement pattern of the rider will be dominated by the effects of and reactions to the alternating impacts and push-offs. Even in high-level dressage riders riding at collected trot, i.e. rather slowly (~3 m/s), the rider’s movements can largely be explained from the vertical and horizontal decelerations and acceleration of the horse’s trunk that take place during each diagonal stance (Byström et al., 2009). The following description of the rider’s movement starts at ground contact of one diagonal and ends after the following suspension phase. The description is based on kinematic measurements of seven high-level dressage riders riding at collected trot on a force-measuring treadmill (Byström et al., 2009) unless a different reference is given. Both the trunk of the horse and the rider’s seat reach maximal upwards displacement at the end of the suspension phase. Following diagonal ground contact both horse and rider move downwards. Because the horse descends more quickly than the rider, the vertical distance from the rider’s seat to the saddle increases during the first 5% of the stride (Fig. 15.5). The rider is thus little influenced by movements of the horse during the landing phase and the rider therefore continues the movements induced by the preceding push-off. Shortly after first contact the rider’s trunk (hip to shoulder) is tilted maximally backwards as a consequence of both forward motion of the rider’s hip and a backward motion of the rider’s shoulders, which was interpreted as a feed forward mechanism by which experienced riders anticipate and compensate for the longitudinal deceleration of the horse (Terada et al., 2006). As the rider’s seat moves forward in relation to the horse, the rider’s neck and feet move backwards. At the same time the rider’s pelvis is maximally posteriorly rotated (around the transverse axis), the rider’s back and neck are stretched in extension and the rider’s legs are also maximally extended (Fig. 15.6). From 5% stance onwards both vertical and braking ground reaction forces increase rapidly in unridden horses (Barr et al., 1995) and the forwards movement of the horse’s center of mass is rapidly decelerated (Buchner et al., 2000). At the same time the distance between rider and horse decreases causing the rider’s seat to be pressed against the saddle. Following this the pressure of the saddle against the back of the horse also increases rapidly (Fig. 15.7). The impact forces are now transmitted from the horse to the rider and this has a clear effect on the rider’s movements. The rider’s pelvis starts to rotate anteriorly, the rider’s back extends (hollows) and the rider’s neck flexes. The rider’s trunk assumes a vertical position (Terada et al., 2006) and the rider’s neck moves forwards in relation to the horse. The rider’s leg joints flex, the heels are lowered and the feet move laterally and forwards in relation to the rider’s hips. As the rider sinks deeper into the saddle the forward movement of the rider’s seat eventually ceases at about 16% of the stride after diagonal contact. The rider’s seat then starts to move backwards in relation of the horse as midstance is approached. At midstance both horse and rider reach maximal downwards displacement, the rider sits deepest into the saddle (Byström et al., 2009) (Fig. 15.8) and the pressure of the saddle against the back of the horse is maximal. During the propulsive phase, the upwards–forwards directed push-off by the horse is transmitted to the rider’s seat through the saddle. The rider’s seat starts to move out of the saddle as soon as the horse’s trunk starts to move upwards (Fig. 15.5) and the pressure of the saddle against the back of the horse then starts to decrease (Fig. 15.7). A little later, at 36% of the stride following ground contact of the diagonal and coinciding approximately with the time of maximal propulsive ground reaction force (Merkens et al., 1993), the rider’s seat also starts to move forwards in relation to the horse. As the rider is pushed out of the saddle the rider’s trunk tilts forwards due to a combination of relative forwards movement of the shoulders and backwards movement of the hips (Terada et al., 2006). At this time the rider’s pelvis rotates posteriorly and the rider’s back and neck straighten. The rider’s legs extend and the feet move medially and backwards in relation to the hips. These movements then continue into the following suspension phase. Rising trot is a rather recently invented technique that makes trotting more comfortable for the rider and reduces peak forces on the horse’s back (de Cocq et al., 2010). Using this technique, the rider alternately sits on one diagonal pair of limbs and rises on the other. The full stride sequence for rider movements during rising trot has not yet been documented. A preliminary kinematic study of five riders performing rising trot on one horse showed that at first contact of the sitting diagonal the rider’s trunk and thigh were more vertical while the shank was angled more backwards compared with the equivalent time on the rising diagonal when the trunk leaned more forward and the thigh was also more angled forward while the shank was closer to the vertical (Lovett et al., 2005). These findings suggest that the rider first leans the trunk forward by flexing the hip joints and simultaneously moves the feet more forward relative to the hip before rising with a forward–upward movement of the seat through extension of the hip joints such that both trunk and thigh position approach the vertical. This interpretation must be, however, considered preliminary and perhaps incomplete as it is based on measurements at diagonal first contacts. It is also possible that there are relatively large variations in rider technique in rising trot. Saddle pressure measurements of one high-level dressage rider riding at sitting and at rising trot on several different horses showed a tendency towards smaller longitudinal excursion of the center of pressure during rising trot compared to sitting trot (Peham et al., 2009). This means that the rider maintains a more constant position relative to the horse even though the longitudinal displacement of the rider’s body is larger at rising trot compared to sitting trot (Matsuura et al., 2005). A preliminary study of 30 riders with a strain gauge between the stirrup and the stirrup leather concluded that the force was higher at rising than sitting trot (van Beek et al., 2008). One study examined saddle and leg forces using three saddle mat systems between the saddle and the horse in 11 horse–rider combinations of high but not international level, moving in straight line, shoulder-in (when the horse is bent away from the line of travel) and in travers (when the horse is bent towards the line of travel) (de Cocq et al., 2010b). Mean total saddle force was significantly lower when riding straight ahead (671 N) than when riding shoulder-in (707 N) or travers (726 N). Mean inside saddle force was significantly higher when riding travers (468 N) than when riding straight on (425 N) or shoulder-in (413 N). Maximum outside leg force was significantly higher when riding travers (47.2 N) than when riding straight (31.6 N) or shoulder-in (34.2 N). This information enhances the understanding of contemporary rider movement but should be complemented with data on more riders and various dressage riding styles. The description is based on kinematic measurements of seven high-level dressage riders riding at collected walk on a force-measuring treadmill (Byström et al., 2010b) unless a different reference is given. As in the trot, it is paramount to know the characteristics of the gait in order to understand rider movement. The walk is a symmetrical gait without a suspension phase. The horse alternates between tripedal and bipedal support, with the limbs functioning as rigid struts to raise the withers or croup from first contact to midstance. This is in contrast to trot, where both withers and croup move downwards during the first half of stance and then upwards in the following propulsion and suspension phase. As the forelimbs of the walking horse move approximately 25% of the stride out of phase in relation to the hind limbs, the withers are raised when the croup is lowered and vice versa. All together this causes the vertical displacement of the saddle area of the horse’s back at walk to be about half that of the trot (Matsuura et al., 2003) while rotation of the horse’s trunk around the transverse axis (pitch) is almost doubled (Table 15.1) (Byström et al., 2010b). The amplitudes of lateral and longitudinal excursions of the horse’s body center of mass, which are necessary for the horse to maintain its balance during the alternating tripedal and bipedal support phases, are approximately equal to the vertical excursion at walk (Buchner et al., 2000). Such displacement can be accomplished through lateral bending and axial rotation of the back and the axial rotation range of motion is almost doubled during walk compared to trot (Faber et al., 2000; Faber et al., 2001). Therefore, extra-sagittal movements constitute a proportionally larger part of the assembled motion pattern of the walk compared to trot, and it is to be expected that the rider’s movement pattern will be equally more complex. To gain full understanding of the horse–rider interaction at walk, the rotations of the rider’s body segments around the vertical and longitudinal axes must also be considered. However, focusing on sagittal plane movements is a good place to start describing the rider’s movements. Table 15.1 Stride range of motion in degrees or mm for variables measured in high-level dressage horses and riders (n = 7) during collected walk and trot on a treadmill#. Pitch is rotation around a transverse axis, roll is rotation around a longitudinal axis and yaw is rotation around a vertical axis. #Table values represent group mean ± SD. *Significant difference (p < 0.05) between gaits in a paired non-parametric test (Wilcoxon). Reprinted from Byström, A., Rhodin, M., von Peinen, K., et al., 2009. Basic kinematics of the saddle and rider in high-level dressage horses trotting on a treadmill. Equine Vet. J. 41, 280–284, with permission from the Equine Veterinary Journal. At walk both the range of vertical displacement of the rider’s body (Matsuura et al., 2003) and the rider’s seat in relation to the front part of the saddle are smaller than at trot (Table 15.1). Further, the rider’s seat moves upwards in relation to the front part of the saddle while moving downwards in relation to L3 of the horse and vice versa (Fig. 15.9). This indicates that the vertical displacement of the rider’s seat at walk results mainly from the croup being lowered and raised in relation to the withers rather than true vertical displacement of the rider in relation to horse and saddle. The fact that the rider shows a decreased range of motion for pelvic pitch, back flexion–extension and all head–neck rotations at walk compared with trot (Table 15.1) may reflect the absence of impact effects on the rider at walk. This is supported by the fact that the range of motion for vertical displacement of the rider’s body is only about 1 cm at walk (Matsuura et al., 2003) and the amplitude of the rider’s body movements is significantly lower in the vertical than in the lateral and longitudinal directions, which is contrary to the findings at trot (Matsuura et al., 2005). Riders are therefore more likely to be adjusting their movements at walk to the alternating difference in height between the horse’s croup and withers rather than to vertical and horizontal deceleration and acceleration of the horse’s trunk as in trot (Byström et al., 2009).
Horse–rider interaction
Saddle
The electronic saddle mat
Saddle pressure in the standing horse
The effect of the saddle on motion of the back
Saddle types
Saddle fit and saddle pads
Panels and girths
Bits and reins
Bits
Reins
Rein tension
Basic rider movements
Trot
Rider movements at sitting trot
The seat at rising trot
Walk
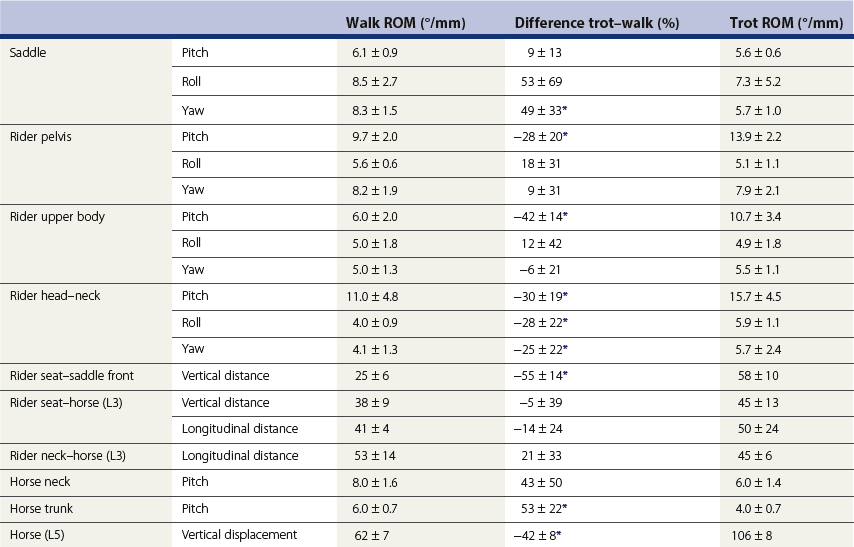
Rider movements in the sagittal plane at walk