Chapter 12 Inherited Ocular Disorders
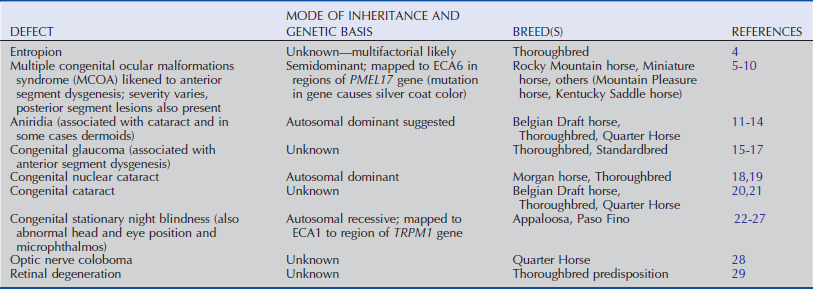
Hereditary eye diseases have been described in several breeds of horses (Table 12-1), but few have been studied in the same detail as similar disorders in other species such as humans, mice, and dogs. With the recent publication of the deoxyribonucleic acid (DNA) sequence of the equine genome1 coupled with the existing linkage maps2 and radiation hybrid maps,3 the molecular tools are now in place to facilitate the investigation of equine genetic traits. Such research will lead to the identification of disease-causing gene mutations and development of DNA-based tests to screen for them. This chapter will cover some basic concepts about the genome and describe the steps that may be taken to further our understanding of hereditary eye disease.
The Equine Genome
Genes
The number of genes predicted to be present in the horse genome is about 20,000, which is similar to the estimates for other mammals, including humans. The majority of these genes are orthologous, meaning they are similar to genes in different species, having arisen in a common ancestor. Not only can genes be similar between species, but there is often similarity between genes within a species. Genes that have similar nucleotide structure are categorized into families. Members of a gene family may code for similar proteins or be expressed at different times during development, although in some instances, gene function is not similar within gene family members. Gene family expansion occurs within a species when a family of genes holds high evolutionary significance for that species. Several such interesting gene family expansions were noted by Wade et al. (2009) in the equine genome.1 Along with the expansion of keratin family genes, predicted to be important for hoof development, was the gene family expansion related to vision. The opsin family of genes had more than twofold as many gene paralogs (or duplications) in horses as in humans, with 21 gene family members for photoreception in the horse, compared to nine in humans. This gene family expansion may relate to the importance of vision in prey species.
Meiosis and Linkage Disequilibrium
During the formation of gametes by meiosis, there is an exchange of material between the maternally and paternally derived chromosomes. After duplication of the DNA of the chromosomes to form two chromatids for each chromosome, the maternally derived and paternally derived copies of each chromosome are paired. There is then exchange of material (crossing over) between one chromatid of each chromosome and its pair (Fig. 12-1). When genes are on separate chromosomes, there is random assortment of genetic material during meiosis, as stated in Mendel’s law of independent assortment (Mendel’s second principle). Such genes are “unlinked.” However, when two genes are close together on the same chromosome, they are more likely to remain together and not be separated during meiosis. Two such genes are described as being “linked” and are considered to be in linkage disequilibrium (LD). LD can be used to investigate how close together two linked genetic loci (for example, a gene or other DNA marker) on a chromosome are. The size of LD blocks in horses is reported to be greater than in humans and smaller than in dogs.1 Linkage disequilibrium was similar across multiple horse breeds with the exception of the Thoroughbred, which had higher LD due to its history of a few founders and closed breeding structure. The closer two sections of DNA are on the chromosome, the less frequently they will become separated during meiosis.

Genetic Variation
Naturally occurring variations in DNA (or more accurately individual alleles) between individuals are found across the genome. Although a few of the variations are responsible for diseases (and are called mutations), and others account for the normal hereditary variability within the population, many others are in noncoding regions of DNA and have no apparent influence on phenotype. The polymorphisms in DNA that are used for mapping include microsatellites and single-nucleotide polymorphisms (SNPs, pronounced “snips”) or other small variations in DNA such as insertions or deletions (indels) of short sections of DNA. These variations in DNA are inherited in a simple mendelian fashion and are spread across the genome. Microsatellites are regions of DNA where typically two or more nucleotides are repeated several times (Fig. 12-2). The number of repeats is variable (polymorphic). This variation in number of repeats is stable and inherited in a mendelian fashion. Dinucleotide (two base pair) repeats are most commonly used for mapping purposes, although trinucleotide and tetranucleotide repeats are also used. More than two versions (alleles) of a microsatellite can be found within a population. However, because each animal has two of each autosomal chromosome (one paternally derived and the other maternally derived), each animal will have two copies of each autosomal microsatellite. For example, for one particular microsatellite, one animal may have one copy (allele) with 20 repeats and another copy with 19 repeats. Offspring from that animal will receive one of those alleles (i.e., either the 19-repeat allele or the 20-repeat allele); the other allele will derive from the other parent. Ascertainment of which versions of a microsatellite an animal has requires the use of polymerase chain reaction (PCR) to amplify that particular microsatellite. Each microsatellite has a unique DNA sequence that flanks it, and primers for PCR are designed from that unique DNA sequence, allowing the amplification of only the portion of DNA of interest. The amplified microsatellite is then subjected to electrophoresis to ascertain the size of the two alleles (which is dependent on the number of repeats) the animal being tested has.

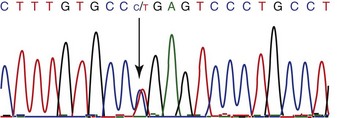
SNPs (Fig. 12-3) are variations at a single nucleotide, and typically only two versions of each SNP exist in the population. This means they are less powerful for mapping than microsatellites, which often have more than two alleles in a population. The advantage of SNPs is that they occur very frequently across the genome. Sequence analysis of 11 common horse breed sets, as well as a set of individuals representing 24 other breeds and equids (donkey and Przewalskii horse), has identified over 1.1 million SNPs in the equine genome, at an average frequency of 1 SNP per 2000 basepairs.1 These variants will be useful for mapping traits within and between horse breeds.
There are several methods of genotyping an individual animal for an SNP or establishing which version(s) of the SNP are present. The EquineSNP50 Genotyping BeadChip, available from Illumina Inc. (San Diego, CA), contains over 54,000 evenly spaced SNPs derived from the EquCab2.0 sequence assembly. Utilizing this technology allows for the simultaneous genotyping of all 54,000 SNPs. It can be used for whole-genome screening to allow mapping of genetic disease, but a more dense array of at least 100,000 SNPs will be required for comprehensive genome-wide association analyses (see later). Methods of genotyping individual SNPs include using techniques such as DNA sequencing, restriction length polymorphism analysis, denaturing high-performance liquid chromatography (HPLC), and fluorogenic 5′ nuclease (TaqMan) assays.30–32
Genome Sequence
The genomes of several species, including the horse, have now been sequenced (see http://www.ncbi.nlm.nih.gov/Genomes/index.html for updated information). Sequencing a genome is the determination of the exact order of all nucleotides for every chromosome in the species being sequenced. While there is extensive similarity in the DNA sequence between species, there is much to be gained by having a precise and detailed blueprint for the species of interest. The Horse Genome Project began in 1995 as an international collaboration with the intent of defining the DNA sequence of domestic horses. The resultant recently reported equine genome sequence is a tremendous tool that will assist researchers to more efficiently uncover the genetic basis of heritable conditions in horses.1 Wade et al. (2009) sequenced the DNA of a thoroughbred mare with 6.8× coverage.1 Coverage is an indication of sequencing redundancy, which is important to ensure accurate capture of the nucleotide data. An average coverage of 6.8× means that the chance of each segment of DNA being “read” at least 4 times is about 90%. This was a massive undertaking; it required 2.88 × 10⁷ separate sequence reads to achieve this coverage. The human genome sequencing project provides an estimated 8× to 9× coverage of each chromosome. The size of the equine genome is estimated to be between 2.5 to 2.7 gigabasepairs (Gb), which is intermediate to the size of the human and bovine genomes (2.9 Gb) and the canine genome (2.5 Gb).


