Fig. 31.1
(a) A flow chart of the three different preparation procedures, namely, in vivo cryotechnique with freeze-substitution (i), quick-freezing of fresh resected tissues followed by freeze-substitution (ii), and conventional perfusion fixation with alcohol dehydration (iii) for mouse organs, such as cerebellum or adrenal glands, which are finally embedded in paraffin wax. (b) A schematic drawing of the in vivo cryotechnique for an anesthetized mouse cerebellum under an in vivo cryoapparatu s . It is frozen in vivo with a cryoknife and simultaneously has isopentane -propane (IP) cryogen (−193 °C) poured on it
31.3 Immunolocalization Comparison of AT1R with Different Preparation in Cerebellum of Mouse
The immunolocalizations of AT1R examined using QF-FS were mostly similar to those prepared using IVCT (Fig. 31.2a–f), and immunoreaction products appeared to be clustered or linear dot patterns in the mouse cerebellar cortex . However, compared with the AT1R immunoreactivity detected using IVCT (Fig. 31.2a–c), it was more weakly detected in all three layers using QF-FS (Fig. 31.2d–f). Using the conventional PF-DH (Fig. 31.2g–i), the AT1R immunoreactivity was less obviously detected in the three layers.
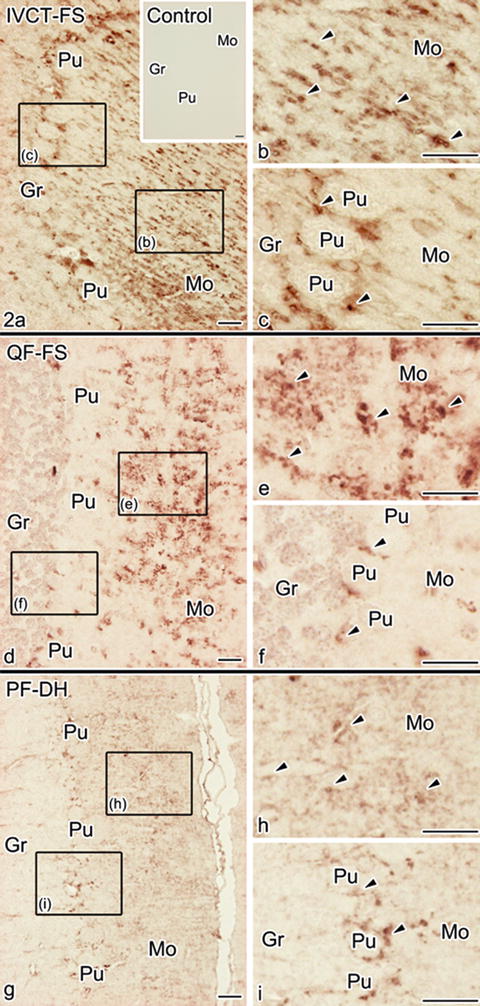
Fig. 31.2
Immunostaining of AT1R with the three different preparation methods, namely, IVCT-FS (a–c), QF-FS (d–f), and PF-DH (g–i). Immunoreaction products in the specimens prepared using IVCT-FS are more clearly detected in molecular layers, Purkinje cell layers, and granular layers than those prepared using QF-FS and PF-DH. At higher magnification, immunoreaction products, recognized as dot patterns, are less clear in the molecular layers using QF-FS and PF-DH (b, e, h, arrowheads) and also less clear in Purkinje cell layers with QF-FS and PF-DH (c, f, i, arrowheads). Bars, 20 μm
Our previous studies demonstrated that both QF-FS and PF-DH easily caused technical artifact s of morphology because of hypoxia /ischemia inevitably induced by the conventional chemical fixation [17]. Therefore, the decreased AT1R immunoreactivity following both QF-FS and PF-DH preparations indicated that the immunostaining of AT1R was inevitably altered by hypoxic condition s .
31.4 Immunoreactivity of AT1R at Several Hypoxia Time
To confirm this possibility, the immunoreactivity of AT1R was examined in mouse cerebellum prepared using IVCT under different intervals of hypoxia . IVCT was similarly performed at three time points under hypoxia after opening the thoracic cavity, as shown in Fig. 31.1b. Following 1 min of hypoxia, the immunoreactivity of AT1R was slightly decreased, but still clearly detected in all three layers of cerebellar cortex (Fig. 31.3a, b). However, after 5 and 10 min of hypoxia, it was remarkably reduced and undetectable in the three layers (Fig. 31.3e, f, i, j). By contrast, the immunoreactivities of both calbindin (Fig. 31.3c, g, k) and GFAP (Fig. 31.3d, h, l) were mostly unchanged under such hypoxic condition s .
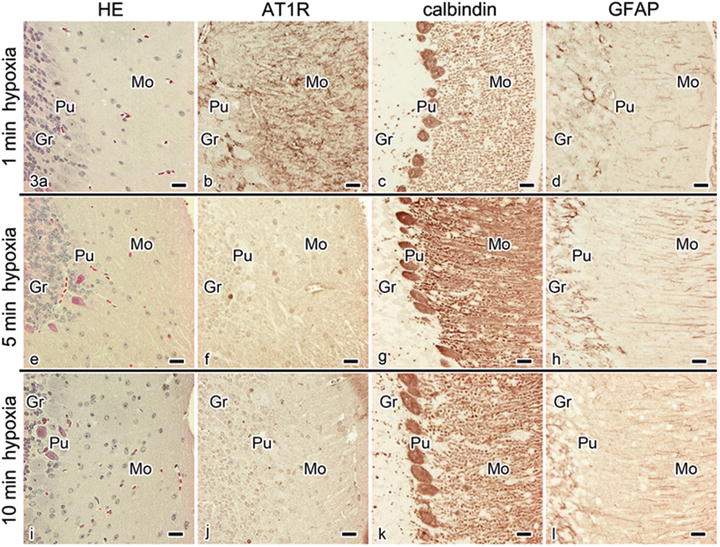
Fig. 31.3
Light microscopic images of HE staining (a, e, i) and immunostaining of AT1R (b, f, j), calbindin (c, g, k), and GFAP (d, h, l) under 1 (a–d), 5 (e–h) and 10 (i–l) min hypoxia in serial sections of the mouse cerebellum , as prepared using IVCT-FS. At 1 min after hypoxia, AT1R immunoreactivity is still detected, whereas its intensity is slightly decreased in comparison with those of normal mice, as shown in Figs. 31.2d and 31.3a. At 5 (f) and 10 (j) min of hypoxia, AT1R immunoreactivity is remarkably reduced in all three layers, namely, molecular layer (Mo), Purkinje cell layer (Pu), and granular layer (Gr). Moreover, as seen by HE staining (e, i), some Purkinje cells show more eosinophilic cytoplasm at 5 and 10 min after hypoxia. By contrast, immunostaining of calbindin or GFAP does not change following hypoxia. Bars, 20 μm
31.5 Immunoreactivity of AT2R at Several Hypoxia Time
Next, considering the hypoxic condition s , the immunoreactivity of AT2R in the cerebellar cortex was still detected at 1 min of hypoxia (Fig. 31.4a), which was similar to that of AT1R (Fig. 31.3b), but it was remarkably reduced at 5 or 10 min of hypoxia (Fig. 31.4b, c).
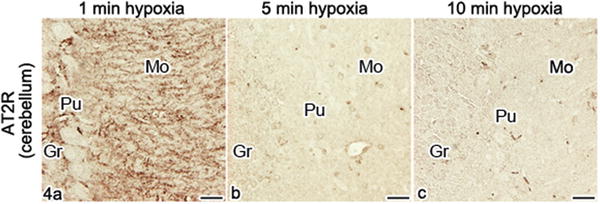
Fig. 31.4


Immunostaining of AT2R under hypoxic condition s in mouse cerebellum , as prepared using IVCT-FS. (a)–(c) In the cerebellum, at 1 min after hypoxia (a), immunoreaction products are still detected as dot patterns, but their immunostaining intensities are slightly decreased in comparison with those of normal mice. After 5 and 10 min of hypoxia (b, c), they are remarkably reduced in all three molecular (Mo), Purkinje cell (Pu), and granular layers (Gr). Bars, 20 μm
Stay updated, free articles. Join our Telegram channel
Full access? Get Clinical Tree
