Fig. 11.1
Light micrographs of hematoxylin–eosin (HE)-stained sections of normal mouse spleen , prepared with the in vivo cryotechnique (IVCT) followed by freeze-substitution (FS). (a) Low-magnified view of the white pulp (W) and red pulp (RP). A central artery (arrow), periarterial lymphoid sheath (PALS) , and germinal center (GC) are shown in the white pulp . (b) A highly magnified image of the rectangular box in (a). Weakly hematoxylin-stained nuclei of splenic cells are shown in the germinal center (GC), which are further magnified in the inset. (c) A marginal sinus (MS) containing many erythrocytes is occasionally seen between the white pulp (W) and the marginal zone (MZ) . (d) In the red pulp, many erythrocytes are densely accumulated. (e) Highly magnified image of the rectangular box in (d). Many flowing erythrocyte s are clearly observed in the splenic sinus (SS) and splenic pulp (SP) . Ca: splenic capsule . Bars; 50 μm (a–e) and 10 μm (inset in b)
11.3 Evaluation of Nuclear Shrinkage of the Splenic Cells Caused by IVCT-FS and Conventional Fixation Methods
To examine the artificial shrinkage of nuclei during the chemical fixation and dehydration steps, the 2-day-immunized mouse spleens prepared by the cryotechniques were compared with those prepared by conventional chemical fixation and alcohol dehydration . To judge the changes in nuclear size, lengths of the major or minor axis of nuclei were measured as parameters for statistical analyses. (V = 4/3πa 2 b; a = 1/2 of the minor axis, b = 1/2 of the major axis, π = 3.14) [6]. The nuclear volume of specimens prepared with IVCT, PF–QF, FT–QF, PF–DH, and IM–DH was 59.35 ± 3.37, 46.33 ± 2.78, 55.56 ± 4.26, 29.77 ± 1.52, and 42.46 ± 3.63 μm3 (mean ± standard error (SE)), respectively, showing that both PF–DH and IM–DH induced significant shrinkage of nuclei, as compared with IVCT. These findings indicate that chemical fixation and alcohol dehydration are both responsible for the shrinkage of nuclei in immunized splenic cells during tissue preparation.
11.4 Evaluation of Antigen Masking and Diffusion Artifact of Ig -Producing Plasma Cells Prevented by IVCT-FS
The antigen retrieval effect was assumed to be caused by breaks of the cross-linked molecule s [7]. The cryofixation usually produces tiny ice crystal s in the cells and tissues during the freezing step, and the formed mesh structures are well preserved during the freeze-substitution step without tissue shrinkage , enabling easy penetration of antibodies throughout the tissues. In the present study, the IVCT methods followed by FS improved it without any antigen retrieval treatment, as shown in Fig. 11.2a–c. However, Igκ-immunoreactivity of some cells in the immunized splenic tissues was not clearly detected with the conventional PF–DH, as shown in Fig. 11.2d–f. Thus, the combination of cryofixation and FS probably decreased the extent of antigen masking, in addition to reducing the diffusion of soluble component s .
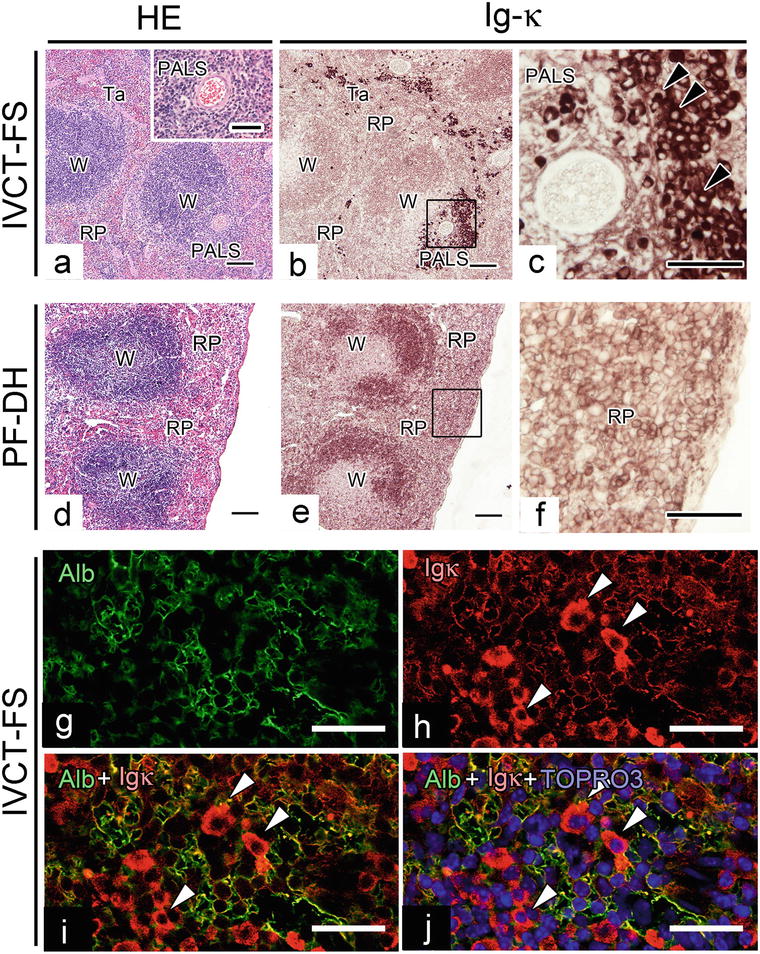
Fig. 11.2


Light micrographs of 2-day-immunized mouse spleen tissues, prepared with three cryofixation methods. (a)–(c); IVCT. (d)–(f); PF–DF. The same tissue areas are shown in serial sections stained with HE (a, d) and also immunostained for immunoglobulin κ light chain (Igκ) (b, e), respectively. The images of rectangular boxes in (b) and (e) are highly magnified in (c) and (f), respectively. The Igκ in the specimens prepared with IVCT (b, c) is mainly detected in the cytoplasm of Ig -producing cell s (arrowheads). Notably, it is clearly located in periarterial lymphoid sheath (PALS) (inset of a, c) in the living mouse spleen with blood circulation , prepared with IVCT (a, b, c). The Igκ in the specimens prepared with PF–DH (c) is weakly detected in the shrunken cytoplasm of smaller splenic cells in the red pulp (RP), as compared with those shown in IVCT (b) Bars; 100 μm (a, b, d, e), 50 μm (c, f inset of a). Confocal laser scanning micrographs of double fluorescence immunolabeling for albumin (g, Alb; green) and the immunoglobulin κ light chain (h, Igκ; red) in 2-day-immunized mouse spleens , as prepared with IVCT followed by FS. TO-PRO-3 (j, TP3; blue) was also used for labeling nuclei. (g) Albumin is detected in the extracellular matrix , but not in the cytoplasm of cells with blood circulation. (h) Igκ is mainly detected in the cytoplasm of possible Ig-producing cells (arrowheads) and also in the extracellular matrix. (i) Merged double, fluorescence image (Alb + Igκ; yellow) shows the colocalization of albumin and Igκ in the extracellular matrix, but not in the cytoplasm of the Ig-producing cells. (j) Merged triple fluorescence image (Alb + Igκ + TP3) shows no colocalization of albumin, Igκ, and TO-PRO-3 in nuclei. Bars: 30 μm
Stay updated, free articles. Join our Telegram channel
Full access? Get Clinical Tree
