Fig. 24.1
Schematic representation of the way how to perform IVCT. Liquid isopentane -propane cryogen (−193 °C) was directly poured over the kidneys of anesthetized rats, which were then removed with a dental electric drill in liquid nitrogen. Such frozen kidneys by IVCT were processed to the freeze-substitution (FS) fixation
24.2 Proteinuria and Serum Examination
Daily amounts of urinary protein were shown in Fig. 24.2, depending on the days after the PAN injection and also administered PAN concentrations. The excreted protein amount was not increased in the control group (Fig. 24.2a). In the experimental group of 15 mg PAN injection, the amount of urinary protein was increased at day 3 and exceeded 300 mg/day at day 9 (Fig. 24.2a). In the lower 5 or 10 mg PAN-injection group (Fig. 24.2b), the protein amount in the urine was also slightly increased at day 3. Table 24.1 shows a list of biochemical analyses of serum albumin and creatinine. Significant hypoalbuminemia and renal dysfunction s were detected in the 15 mg PAN-injection group at day 9. In the 5 or 10 mg PAN-injection group, hypoalbuminemia was also detected at day 3.
Fig. 24.2
Time-dependently changing graphs show daily amounts of urinary protein in the control group (a; triangles) and in the 15 mg PAN -injection group (a; squares) or in the 5 or 10 mg PAN-injection group (b; rhombuses and circles). Mean ± SE, n = 3 in each group, *p < 0.05 vs. control (day 0)
Table 24.1
Biochemical serum examination
PAN (mg) | Albumin (g/dl) | Creatinine (mg/dl) | |
|---|---|---|---|
Control | 0 | 4.33 ± 0.25 | 0.30 ± 0.015 |
Day 3 | 5 | 3.73 ± 0.12 | 0.24 ± 0.064 |
10 | 3.60 ± 0.17 | 0.25 ± 0.045 | |
Day 9 | 15 | 1.53 ± 0.057 | 0.69 ± 0.015 |
24.3 Immunolocalizations of Serum Proteins Under Normal Condition
With HE staining, light micrographic images of normal rat kidneys were clearly observed without ischemia nor anoxia (Fig. 24.3a, b). Various shapes of erythrocytes reflecting their flowing condition in glomerular basement membrane s (GBMs) were well retained in the HE-stained tissue sections (Fig. 24.3b; arrows). By immunostaining for albumin , its immunolocalization of the normal kidneys was mainly detected in GBMs and blood vessel s in the interstitium between proximal or distal convoluted tubules (Fig. 24.3c, d). At higher magnification of a glomerulus (Fig. 24.3d, e), it was rarely detected in the outside of GBMs. In addition, the albumin immunolocalization was also detected at intercellular digitation or basal striations (Fig. 24.3f) and the apical cytoplasm of epithelial cell s in some proximal tubule s (PTs) at higher magnification of PTs (Fig. 24.3f). Immunolocalizations of IgG1 in normal rats were detected in GBMs and blood vessels of the interstitium (Fig. 24.3g, h). At higher magnification of a glomerulus (Fig. 24.3h, i), it was rarely detected in the outside of GBMs in the similar pattern of albumin. At higher magnification of PTs (Fig. 24.3j), it was rarely immunolocalized at basal striations unlike albumin. By the double-fluorescence staining with PAS and for albumin observed with confocal laser scanning microscopy , the albumin immunolocalizations were detected in the inside of GBMs (Fig. 24.3k–n) and in the apical cytoplasm of epithelial cells of PTs (Fig. 24.3o–r; arrows).
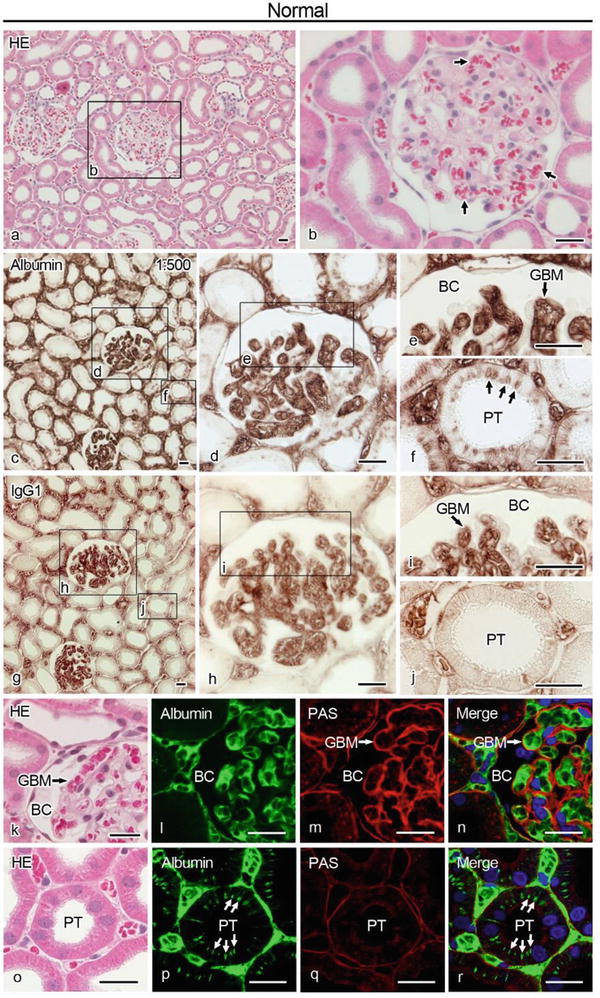
Fig. 24.3
HE staining and immunostaining of serum protein s in normal rat kidney tissues prepared with IVCT. By HE staining (a, b), flowing erythrocyte s are well retained in blood vessel s (b; arrows). By albumin immunostaining with a dilution of 1:500 (c–f), it is mostly detected in blood vessels in addition to intertubular matrices. At higher magnifications (e, f), it is clearly immunolocalized within glomerular basement membrane s (GBMs) (e) and along some basal striations of proximal tubule s (PTs), including blood vessels (f, arrows). IgG1 is also immunolocalized in blood vessel (g–j). At higher magnifications (i, j), it is clearly immunolocalized within GBMs (i), as similar to albumin (e), but hardly detected at basal striations of PTs (j). (k–r) HE-stained images (k, o) and confocal laser scanning microscopic images of PAS staining (m, n, q, r) and immunostaining of albumin (l, n, p, r). Albumin (k–n, green color) is immunolocalized in GBMs encircled with glomerular basement membranes (GBMs, red color), as shown by the PAS staining. It is also detected at some basal striations and lateral sides of PTs (o–r; arrows). Bars, 20 μm
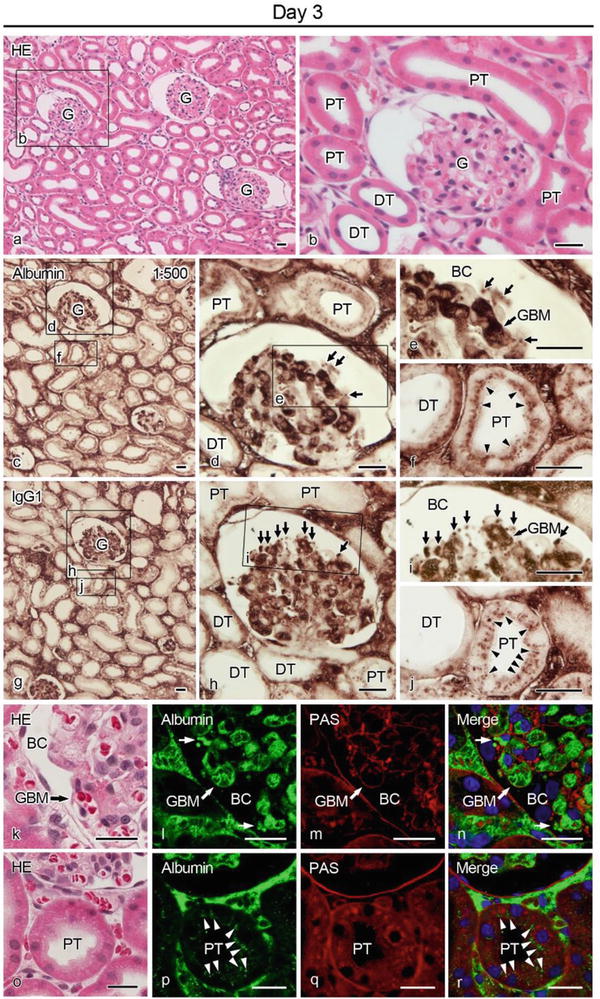
24.4 Histological Findings and Immunolocalizations of Serum Proteins in 3 Days After PAN Injection
At day 3 (Fig. 24.4), little histological changes were detected by HE staining at a light microscopic level (Fig. 24.4a, b), as compared to those of the normal rats. On the other hand, albumin was immunolocalized in GBMs and blood vessel s in the interstitium between proximal or distal convoluted tubules (Fig. 24.4c), which were almost similar to those of normal kidneys. At day 3, when an increase of the urinary protein excretion was confirmed by the urine test (Fig. 24.2), albumin was clearly immunolocalized in the outside of GBMs (Fig. 24.4d; arrows). At higher magnification of a glomerulus (Fig. 24.4e; arrows), it appeared to be detected in podocytes , probably indicating their absorption of albumin. The similar albumin absorption into podocytes was detected in all nephrons (data not shown). At higher magnification of PTs (Fig. 24.4f), granular immunoreaction products were detected at the apical cytoplasm of proximal tubular epithelial cells, indicating abundant reabsorption of excreted albumin (Fig. 24.4f; arrowheads). A number of proximal tubule s with such reabsorption were significantly increased, as compared to those in control rats. At day 3, IgG1 was also immunolocalized in the outside of GBMs (Fig. 24.4h; arrows). At higher magnification of a glomerulus, granular appearances of the immunoreaction products in podocytes were larger and clearer than those of the albumin (Fig. 24.4i; arrows). At higher magnification of PTs (Fig. 24.4j, arrowheads), granular immunoreaction products in the apical cytoplasm of epithelial cells were clearly detected. By double-fluorescence staining with PAS and albumin, albumin immunolocalizations were detected along GBMs (Fig. 24.4k–n), in podocytes at outer side of GBM (Fig. 24.4k–n; arrows), and at apical cytoplasm of proximal epithelial cell s in PTs (Fig. 24.4o–r; arrowheads).