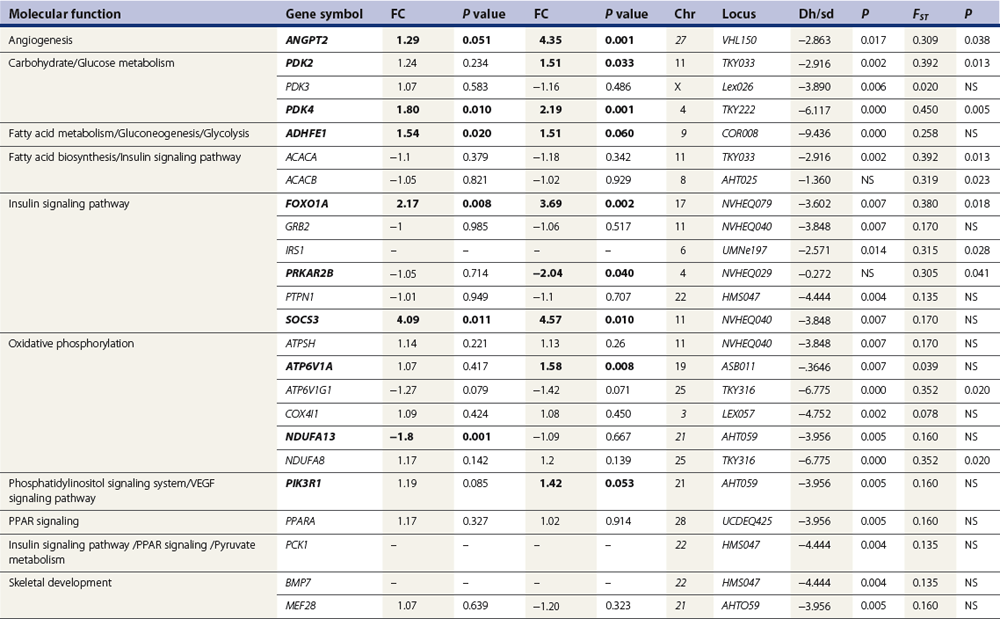
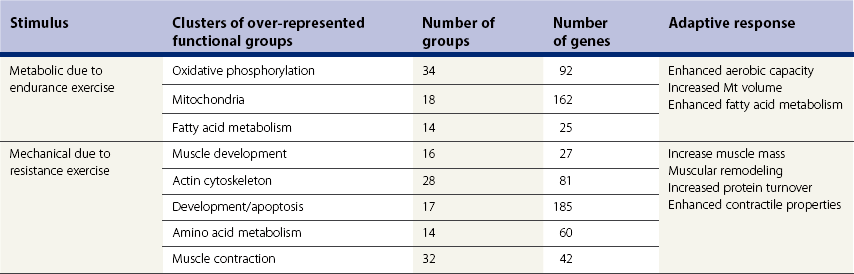
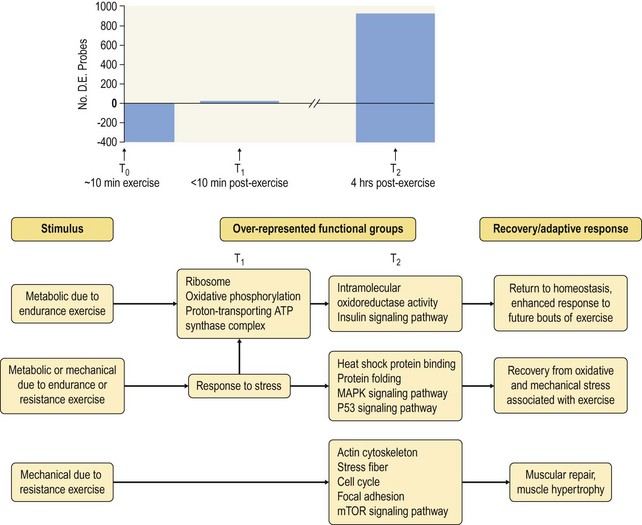
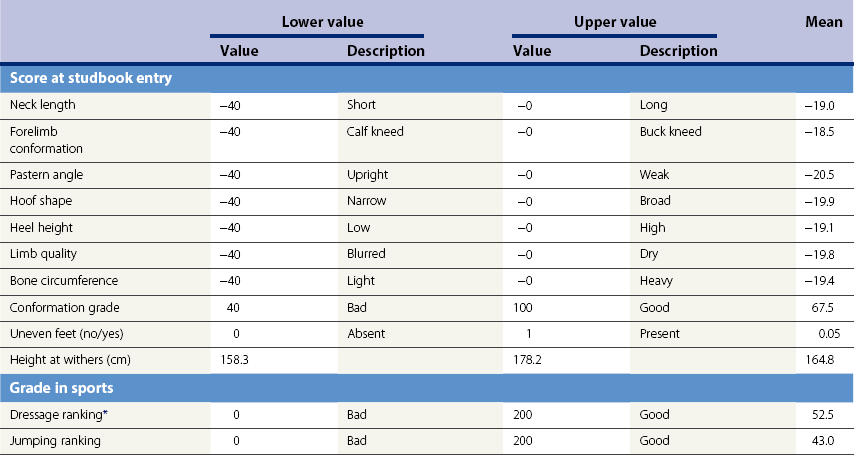
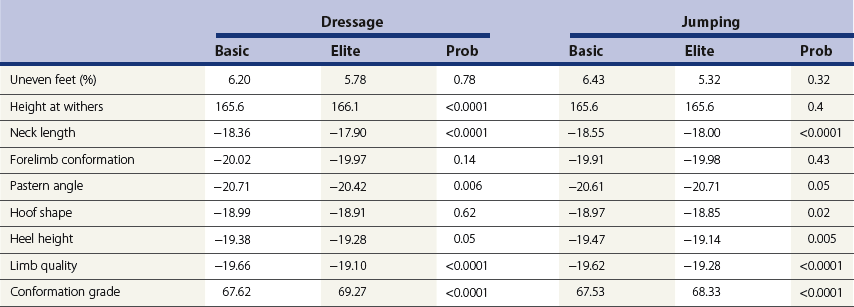
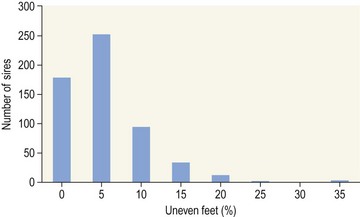
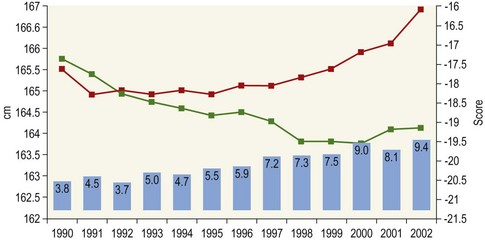
Chapter 12 The relationship between conformation and gait and the observation that variation in many conformational traits is, to a large degree, inherited, has formed the basis for the selection of performance horses for millennia. Still, this selection forms the basis for many breeds of horse today. As early as the 4th century BC the Greek hippologist Xenophon gave detailed descriptions of the conformational characteristics of a good performance horse. He made comments on the quality of the horn, the slope of the pastern, the robustness of the metacarpal and metatarsal bones and the desired joint angles in fore and hind limbs. According to Xenophon a well-developed hind quarter was the best sign that a horse would move fast and smoothly; this observation demonstrates a knowledge that propulsion stems from the hind limbs. This insight is also evidenced by the observation that a short, strong lumbar region is preferred to a long back (cited by Schauder, 1923). After Xenophon, all great hippologists stressed the same conformational characteristics as desirable traits. This applies to the great Arab horsemen from the early Middle Ages, such as Akhi Hizam al-Furusiyah wa al-Khayl who published on the conformation of horses in AD 860 (Dunlop & Williams, 1996), and also to the famous European ecuyers from the 17th and 18th centuries such as William Cavendysh (1674) and Jacques de Solleysel (1733). All modern horse breeds descend from common ancestors that roamed the central Eurasian steppe some 6000 years ago (Levine, 1999). Natural selection in different biotopes and selection by man for different purposes has resulted in a wide variety of horse breeds, ranging from the small and sturdy Shetland pony, that stands on average no more than 11 hands, to the Shire, ‘the great horse of the Middle Ages,’ that carried heavily armored knights. Since horses were domesticated they have been selected for strength, speed and endurance-exercise traits. More recently the development of specific breeds has resulted in selection for athletic phenotypes that enable the use of the horse for riding, recreation, sport and racing. Some breeds are particularly suited to racing (e.g. Thoroughbred, Standardbred, French trotter, Swedish trotter and Quarter Horse) while others have been strongly selected for jumping and other athletic phenotypes (e.g. Warmbloods). Performance in the horse may be broadly divided into three categories: working, riding and racing (Hintz, 1980). With respect to working, pulling has been considered by various authors and estimates of heritability range from 0.12 ± 0.14 (Lonka, 1946) to 0.58 ± 0.20 (Varo, 1947) with a mean estimated heritability from several reports of 0.25 (Hintz, 1980). Cutting performance or ‘cow sense’ has received little attention so far, although Ellersieck et al. (1985) estimated a heritability of 0.19 ± 0.05 for this trait. With respect to riding performance in competition, most of the estimates are in the range of 0.10–0.30 (Ricard et al., 1998). Although racing performance may seem relatively straight-forward to quantify using parameters such as number of races won, best time and (total) earnings, many factors complicate this procedure. For instance, many methods use the ranking in a certain athletic event. However, although high ranking in a certain event may be synonymous with good performance for a given individual horse, this does not necessarily provide information about the genetic value of this individual for the population, as much depends on the level of the event in which the individual took part. Heritability estimates for transformed earnings or best time per kilometer range from 0.20 to 0.40 (Hintz, 1980). Nowadays, conformation is recorded in a semi-quantitative way by most studbooks, using scoring systems. Traditionally, the scale of scoring has an appreciative character, e.g. the scale runs from ‘bad’ to ‘good’. At the end of the 1980s, the Royal Dutch Warmblood Studbook introduced a system for the linear scoring of conformational traits and gait. This system, together with the assessment of some health-related items, is one of the pillars of the Dutch selection system for stallions and their progeny (Barneveld, 1996). In this system a large number of conformation traits are scored on a 0–40 scale in which a population mean of 20 is assumed. The rather fine scale and the use of more specific characteristics (such as slope of the shoulder, length of the back, slope of the pastern, etc.), makes a better estimation of heritability possible. In general, heritability was found to be low to moderate for conformation traits, ranging from 0.09 (slope of the pastern) to 0.26 (length of the neck and position of the croup) (Koenen et al., 1995). Also, in other studbooks linear scoring systems have been successfully introduced (Van Bergen & van Arendonk, 1993; Samoré et al., 1997). Some of these conformational characteristics are correlated with performance. A long, sloping shoulder is positively correlated with dressage results (Holmström et al., 1990, 1994). A long and strongly muscled croup is positively related to show jumping performance (Langlois et al., 1978). However, the vast majority of conformational traits that are scored using the linear system do not directly correlate with performance. This fact, together with the low-to-moderate heritability estimates for conformation (Preisinger et al., 1991; von Butler-Wemken et al., 1992), indicate that conformation results should be considered of minor importance in a direct selection for performance (Koenen et al., 1995). This is different when traits related to moving and jumping are considered. Most studbooks also score gaits and elements of (free) jumping during studbook admission, field tests and station performance tests. From a review of Thorén et al. (2006) it appeared that traits related to gaits showed moderate-to-good heritabilities as well as good genetic correlations to dressage performance in competition. Compared to gaits, jumping traits showed even higher heritabilities as well as higher genetic correlations to show jumping in competition. Genetic parameter estimates were somewhat lower when records were collected at field tests rather than the more uniform station performance tests (Ducro et al., 2007). These results clearly indicate that information from studbook admissions, field tests and stationary performance tests are valuable additions to an efficient breeding program. Most studbooks have therefore adopted such a breeding system. With just a few markers mapped on the equine genome in the early millennium, there have been unexpected advances and a rapid explosion of information, perhaps up to 100-fold, during the past 10 years. A coordinated interest in horse genome mapping began in 1995, when an international workshop on genetics and disease in the horse was held in Interlaken, Switzerland. Various general genetics topics and a large number of inherited disorders were discussed (Rossdale, 1995). The horse genome mapping project began in earnest later that year when ~70 scientists from over 20 countries met in Kentucky, USA, to discuss the initial plan to construct a genetic map for the horse. It was agreed that resources, knowledge and findings would be shared on a regular basis. Thereafter, a biannual International Horse Genome Mapping Workshop funded by The Dorothy Russell Havemeyer Foundation was established. During the past 15 years, hundreds of equine scientists, specialists and breeders have attended workshops in the USA, Australia, South Africa, Sweden, Ireland and UK. Several genetic maps, including the linkage map (Guérin et al., 1999; Lindgren et al., 1998; Penedo et al., 2005; Swinburne et al., 2000, 2006; Tozaki et al., 2007), radiation hybrid (RH) map (Chowdhary et al., 1992), mapping of specific genes and assigning microsatellite markers by RH panel (Beck et al., 2005; Böneker et al., 2005a,b, 2006; Brenig et al., 2004; Bricker et al., 2005; Dempsey & Wagner, 1999; Dranchak et al., 2006; Klukowska-Rötzler et al., 2006a, b; Leeb et al., 2005; Mickelson et al., 2004; Momozawa et al., 2005, 2007a,b; Müller et al., 2005a,b,c; Perrocheau et al., 2006; Takahashi et al., 2004; Ward et al., 2003; Wittwer et al., 2005), cytogenetic map by fluorescent in situ hybridization (FISH) (Brinkmeyer-Langford et al., 2005; Chowdhary & Gustavsson, 1992; Goh et al., 2007; Gustafson-Seabury et al., 2005; Milenkovic et al., 2002; Perrocheau et al., 2005; Raudsepp et al., 2004b), comparative map (Brinkmeyer-Langford et al., 2005; Caetano et al., 1999; Chaudhary et al., 1998; Chowdhary & Gustavsson, 1992; Milenkovic et al., 2002; Perrocheau et al., 2005; Raudsepp et al., 1996; Yang et al., 2003, 2004), BAC contig map (Brinkmeyer-Langford et al., 2008; Gustafson et al., 2003; Raudsepp et al., 2004b; Tallmadge et al., 2005) and other high-resolution chromosome maps including a comprehensive Y chromosome map (Brinkmeyer-Langford et al., 2008; Dempsey & Wagner, 1999; Dierks et al., 2006; Goh et al., 2007; Gustafson-Seabury et al., 2005; Lee et al., 2004; Perrocheau et al., 2006; Raudsepp et al., 2004a,b), have been contributed to by collaborations among international laboratories. A major breakthrough in equine genomics was the selection of the horse for genome sequencing by the US National Human Genome Research Institute (NHGRI). The full length sequencing of the horse genome began in February 2006, and was performed at The Broad Institute, Massachusetts Institute of Technology and Harvard University in collaboration with the Equine Genome Sequencing Consortium. A single female Thoroughbred horse was chosen for sequencing using the whole genome shotgun approach. The 6.8× coverage of the initial assembly (EquCab1.0) was released in January 2007, and the current assembly (EquCab2.0) was released in September 2007 (Wade et al., 2009). In addition to whole genome sequencing, a single nucleotide polymorphism (SNP) database (EquCab 2.0) containing >1 million SNPs (~1 per 1500 bp) was constructed by comparing sequences from horses of disparate geographic origin, including Akhal-Teke, Andalusian, Arabian, Icelandic, Quarter Horse, Standardbred and Thoroughbred. Stemming from the horse genome sequencing project new technologies such as the Illumina® EquineSNP BeadChip (McCue et al., 2012) and various gene expression microarrays (Bright et al., 2009) have been designed and may be used to understand trait association and gene function. The recent completion of the draft sequence of the horse genome (Wade et al., 2009), combined with technological and methodological advances in the analysis of complex genetic traits in humans (Steemers & Gunderson, 2007) has provided veterinary genetic epidemiologists with an array of tools for the study of diseases with a heritable component. Specifically, the advent of high-density single nucleotide polymorphism (SNP) based genotyping arrays and the concomitant growth in knowledge of the haplotypic structure of mammalian genomes has led to the adoption of genome-wide association studies (GWAS) for disease gene mapping (Frazer et al., 2007; Orr & Chanock, 2008). These studies, which have recently been successful in the identification of large numbers of genetic loci contributing to disease in humans, exploit the high degree of correlation between genetic variants at any particular region of a chromosome to efficiently interrogate the entire genomes of large numbers of samples using a minimally redundant set of so-called ‘tagging-SNPs’ (Howie et al., 2006). The GWAS paradigm in human studies has been to genotype hundreds of thousands of SNPs in many thousands of affected and unaffected individuals. These large numbers are a result of the hypothesis that multiple loci with a range of effect sizes contribute to the etiology of complex diseases; large numbers of samples are thus required to attain the requisite statistical power for unambiguous detection of such loci. Charlier et al. (2008) and Karlsson et al. (2007) have demonstrated that association based mapping can be effective in the detection of single locus recessive traits in animals using much smaller numbers of individuals. The advances in equine genomics have also rapidly enabled the identification of genomic sequence variation associated with athletic performance phenotypes in Thoroughbreds (Gu et al., 2009; Hill et al., 2010b,d; Tozaki et al., 2010a,b). Thoroughbred horses represent a unique opportunity to identify genomic contributions to exercise adaptation and athletic performance as Thoroughbreds have been selected for exceptional racing performance for 300 years and stem from a small number of founder animals. Intense selection for elite racing performance in the Thoroughbred has resulted in a number of adaptive physiological phenotypes relevant to exercise; however, the underlying molecular mechanisms responsible for these characteristics are not yet well understood. The first report of genes and functional groups of genes contributing to the athletic phenotype in the Thoroughbred employed a population genetics-based approach to identify regions of the Thoroughbred genome that have been selected for exercise-relevant traits (Gu et al., 2009). This work involved a genome scan of genetic variation at 394 autosomal and X chromosome microsatellite loci in four geographically diverse horse populations (Connemara, Akhal-Teke, Tuva and Thoroughbred). Positively selected loci were identified in the extreme tail-ends of the distributions for population genetic parameters and test statistics that identified departures from patterns of genetic variation expected under neutral genetic drift (Gu et al., 2009). Within the outlier loci there was a statistically significant enrichment for genes involved in phosphatidylinositol 3-kinase (PI3K) mediated signaling, insulin receptor signaling and lipid transport – biochemical pathways with well-characterized roles in adaptation to exercise. Furthermore, the importance of muscle function in the recent evolution of the Thoroughbred was highlighted by a significant overrepresentation of sarcoglycan complex and focal adhesion pathway genes located within the selected regions. In summary, these data indicate that recent selection in the ancestors of the present-day Thoroughbred population principally targeted genes associated with fatty acid oxidation, increased insulin sensitivity and muscle strength, highlighting the central role for muscle function and integrity in the Thoroughbred athletic phenotype. More recently, using the Illumina® EquineSNP50 BeadChip platform, the Equine Genetic Diversity Consortium, led by researchers at the University of Minnesota, investigated signatures of selection in over 30 horse breeds that had been selected for different phenotypic traits (Petersen et al., 2013). In this study, the most significant signature of selection in the Thoroughbred was found on ECA17, which was previously implicated as having selective importance in the Thoroughbred (Gu et al., 2009). Among all breeds, the strongest signature of selection was identified in the Paint and Quarter Horse; a 5.5-Mb region of ECA18, which centered on the myostatin (MSTN) gene. To date, three genes with molecular functions relevant to physiological processes important for exercise have been reported to be associated with racing performance, including the myostatin gene [MSTN] (Hill et al., 2010b,; Tozaki et al., 2010a,b), the cytochrome c oxidase, subunit 4, isoform 2 gene [COX4I2] (Gu et al., 2010) and the pyruvate dehydrogenase kinase isozyme 4, mitochondrial gene [PDK4] (Hill et al., 2010c). A variant in the genomic sequence for PDK4 is the first example of a statistically significant association of a SNP with elite race winning performance (Hill et al., 2010). In a set of n = 278 Thoroughbred samples, segregated by retrospective racetrack performance into elite performers and non-winners, a SNP at the PDK4 gene locus (g. 38973231A>G) was significantly associated with elite racing ability (p = 0.0004, odds ratio = 1.97, C.I. (95) = 1.35–2.87), with the A : A and A : G genotypes more common among elite (70%) than non-elite (47%) racehorses. On average, the A : A and A : G genotypes had a 16.2–16.6 lb handicap advantage over G : G horses. As the PDK4 gene locus was identified among a set of positively selected loci in Thoroughbreds (Gu et al., 2009), has functions known to be relevant to exercise (Wende et al., 2005; Scarpulla, 2008; Pilegaard & Neufer, 2004), and in horse skeletal muscle is significantly differentially regulated post-exercise (Eivers et al., 2010; Hill et al., 2010) this gene variant represents a promising opportunity to integrate molecular genetic information in selection and decision-making processes in the Thoroughbred. The locus that has been most extensively studied in regard to an athletic performance trait contains the gene encoding myostatin (MSTN). Three studies have identified variation at this locus associated with optimum race distance in European, North American and Australasian Thoroughbreds (Hill et al., 2010; Binns et al., 2010) and with performance rank and lifetime earnings among Japanese Thoroughbreds (Tozaki et al., 2010a,b). Myostatin is a growth and differentiation factor that functions as a negative regulator of skeletal muscle mass development. In several mammalian species, including cattle, sheep, dogs and mice, muscle hypertrophy phenotypes are associated with sequence variants in the MSTN gene (Grobet et al., 1997; McPherron et al., 1997; McPherron & Lee, 1997; Schuelke et al., 2004; Mosher et al., 2007). Employing a candidate gene approach, Hill and colleagues identified a sequence polymorphism in intron 1 of the MSTN gene (g.66493737C>T) that may be used to predict sprinting ability and racing stamina in Thoroughbred horses (Hill et al., 2010). In a set of n = 197 elite race winning Thoroughbreds, a very strong association with best race distance has been observed (p = 3.28 × 10⁻¹³). Two alleles were observed at this biallelic SNP: a ‘C’ allele and a ‘T’ allele, with the ‘C’ allele more than twice as frequent in the short distance (≤7 furlongs) cohort of animals compared to the long distance (>8 furlongs) group (0.75 and 0.34 respectively), corresponding to an odds ratio of 5.81 (Hill et al., 2010d). It was observed that C : C horses are suited to fast, short-distance races; C : T horses compete favorably in middle-distance races; and T : T horses have greater stamina. Evaluation of retrospective racecourse performance (n = 142) and stallion progeny performance predict that C : C and C : T horses are more likely to be successful 2-year-old racehorses than T : T animals. Histological analysis of gluteal muscle biopsies in Quarter horses showed that the C-allele was associated with higher Type 2B and lower Type 1 muscle fiber proportions, demonstrating a functional consequence for selection this locus. Each copy of the C-allele increased Type 2B muscle fibres by 4.79% (Petersen et al., 2013). The importance of this locus in determining the type of racing an individual is most suited to, was confirmed in a genome wide SNP association study (GWAS) using the Illumina® EquineSNP50 BeadChip. A study using a set of n = 118 elite Thoroughbreds identified the genomic region on chromosome 18 containing the MSTN gene as the highest ranked region for optimum race distance and a set of seven SNPs within a 1.7 Mb region that reached genome-wide significance (Hill et al., 2010d). A comparison of trait association in the same set of samples demonstrated the superior power of the g.66493737C>T SNP (Punadj. = 1.02 × 10⁻¹⁰) for the prediction of best race distance when compared with the best marker on the array: BIEC2-417495 (Punadj. = 1.61 × 10⁻⁹). A genetic test is now available to horse breeders and trainers for this polymorphism. The Equinome Speed Gene Test may be used to make a prediction about the optimum race distance for an individual and may be used to improve decision-making in selection, breeding and training. Functional genomics studies provide a mechanism to further understand the importance of genes and gene functions in exercise adaptation. Gene expression studies in an exercise context in the horse are growing (Eizema et al., 2005; Jose-Cunilleras et al., 2005; Barrey et al., 2006; Mucher et al., 2006; McGivney et al., 2009; Eivers et al., 2010; Hill et al., 2010a; Martin et al., 2010; McGivney et al., 2010). The products of many genes are likely to influence system-wide physiological responses. However, the protein products of two genes have been identified as key regulators of the adaptive response to exercise in humans and model species. These are the hypoxia inducible factor 1, alpha subunit (basic helix-loop-helix transcription factor) gene (HIF1A), which encodes HIF-1α and the peroxisome proliferator-activated receptor gamma, coactivator 1 alpha gene (PPARGC1A), which encodes PGC-1α (for reviews Bonen, 2009; Gibala, 2009; Lundby et al., 2009; Yan, 2009; Lira et al., 2010; Olesen et al., 2010). Eivers and colleagues (2010) have reported the gene expression responses of a panel of HIF-responsive genes in skeletal muscle biopsies collected from the gluteus medius before and after a standardized incremental-step treadmill exercise test in untrained Thoroughbred horses. Analyses of mRNA profiles revealed significant transcriptomic differences 4 h post-exercise (T2) for the CKM, COX4I1, COX4I2, PDK4, PPARGC1A, and SLC2A4 genes relative to pre-exercise levels. The observed relationships with measured physiological variables (VHRmax and [La]peak) indicated that local transcriptional microadaptations influence the overall athletic phenotype. Also, the data highlighted the roles of genes responsible for the regulation of oxygen-dependent metabolism, glucose metabolism, and fatty acid utilization in equine skeletal muscle adaptation to exercise. Employing global approaches to gene expression studies is now possible with the availability of equine-specific gene expression microarrays and through the use of next-generation sequencing technologies. Using equine-specific cDNA microarrays McGivney and colleagues (2009) identified novel genes and key regulatory pathways responsible for exercise adaptation in skeletal muscle. Skeletal muscle biopsy samples were collected from a cohort of Thoroughbred horses at rest (T0) and at two time points following a single bout of treadmill exercise (immediately post-exercise (T1), and 4 h post-exercise (T2) (Fig. 12.1)). While only two genes had increased expression at T(1) (p < 0.05), by T(2) 932 genes had increased (p < 0.05) and 562 genes had decreased expression (p < 0.05). Functional analysis of genes differentially expressed during the recovery phase (T2) revealed an over-representation of genes localized to the actin cytoskeleton and with functions in the MAPK signaling, focal adhesion, insulin signaling, mTOR signaling, p53 signaling and type II diabetes mellitus pathways (Table 12.1). At T(1), using a less stringent statistical approach, an over-representation of genes involved in the stress response, metabolism and intracellular signaling was observed (Table 12.2). These findings suggested that protein synthesis, mechanosensation and muscle remodeling contribute to skeletal muscle adaptation towards improved integrity and hypertrophy. Table 12.1 Fig 12.1 Skeletal muscle biopsy samples collected from a cohort of Thoroughbred horses at rest (T0) and at two time points following a single bout of treadmill exercise (immediately post-exercise (T1), and 4 h post-exercise (T2)). Reprinted from McGivney, B.A., Eivers, S.S., MacHugh, D.E., MacLeod, J.N., O’Gorman, G.M., Park, S.D., Katz, L.M., Hill, E.W., 2009. Transcriptional adaptations following exercise in thoroughbred horse skeletal muscle highlights molecular mechanisms that lead to muscle hypertrophy. BMC Genomics 10, 638, http://www.biomedcentral.com/1471-2164/10/638 ©McGivney et al; licensee BioMed Central Ltd. To evaluate changes in gene expression following multiple exercise bouts (i.e. conditioning or training) McGivney et al. (2010) used digital gene expression (DGE) mRNA tag profiling, which is based on the high-throughput sequencing by synthesis technology available from Illumina Inc. (Mardis, 2008; Fox et al., 2009; Morozova et al., 2009), to characterize the assembly of genes expressed in equine skeletal muscle and to identify the subset of genes that were differentially expressed following a 10-month period of exercise training. Skeletal muscle biopsies were collected from the gluteus medius of seven Thoroughbred horses at rest at two time points: T(1)-untrained (9 ± 0.5 months old) and T(2)-trained (20 ± 0.7 months old). This study found that the most abundant mRNA transcripts in the muscle transcriptome were those involved in muscle contraction, aerobic respiration and mitochondrial function. A previously unreported over-representation of genes related to RNA processing, the stress response and proteolysis was observed. Following training 92 tags were differentially expressed of which 74 were annotated. Sixteen genes showed increased expression, and among the 58 genes with decreased expression, tags representing the gene encoding myostatin (MSTN), had the greatest decrease (−4.2-fold, p = 0.0043). This demonstrates the key role of the myostatin protein in the adaptive response and its function as a negative regulator of muscle development. Functional groups displaying highly significant increased expression included mitochondrion, oxidative phosphorylation and fatty acid metabolism, while functional groups with decreased expression were mainly associated with structural genes and included the sarcoplasm, laminin complex and cytoskeleton. Recently, the Illumina® EquineSNP50 BeadChip platform was used in a GWAS to identify a gene having a major effect on gaitedness in horses. Andersson and colleagues (Andersson et al., 2012) identified a premature stop codon in the doublesex related mab transcription factor gene 3 (DMRT3 gene), which influenced the pattern of locomotion in Icelandic breeds. The presence of the mutation allows for the performance of alternate gaits, i.e. instead of the two-beat contralateral gait of the trot, some horses perform the pace, a two-beat ipsilateral gait. Other natural variations in movement include four-beat ambling gaits characteristic of the Tennessee Walking Horse, Peruvian Paso, Paso Fino, and others, with unique variations in rhythm between breeds. This finding was validated in an investigation of genomic regions under selection in gaited breeds (Petersen et al., 2013). A 186kb region on ECA23 spanning the DMRT3 gene locus was found to have been targeted by selection in breeds with the ability to perform alternative gaits. Together these studies provide strong evidence that DMRT3 is a major effect gene for locomotion/gait phenotypes; however specific variations in gait among breeds may be modified by other loci. Stashak (1987a) describes conformation of the horse as ‘the key to its method of progression’. He then elaborates on a number of faulty conformations that may predispose to various pathologic conditions of the musculoskeletal system: for instance a toe-out conformation results in a greater likelihood of limb interference and plaiting; a palmar deviation of the carpal joints (‘calf knees’) may predispose to slab fractures of the carpal bones; and the commonly seen cow hocked conformation may lead to bone spavin. Apart from these conformation-related disorders, there are direct genetically determined aberrations of the musculoskeletal system, which are much rarer than conformational imperfections. Some of these have been known for a long time to have a genetic basis, but have only recently been elucidated using modern molecular genetic techniques. Ducro et al. (2009a) investigated the significance of foot conformation at young age to duration of the career of sport horses. Warmblood horse studbooks aim to breed horses with a conformation that will enable elite future sports performance, but reduce the risk of early retirement due to lameness. Negative conformational traits, such as asymmetrical or ‘uneven’ forefeet may possibly shorten the career of sport horses. Databases of the Royal Dutch Warmblood Studbook (KWPN) and of the Royal Dutch Equestrian Sports Federation (KNHS) were matched and resulted in a dataset comprising 23 116 records of horses for which their conformation scores and duration of their sports career were available. Survival analysis was used to determine which of the conformation traits had a significant effect on duration of sports career in dressage and jumping at basic and elite level. Duration of competitive life was shorter for jumping than for dressage. A different set of risk factors was found for each level and discipline. The trait ‘uneven feet’ tended to shorten the competitive life in dressage, but was a significant risk factor at the elite level of jumping. Thus, limb conformation and, in particular, the conformation of the distal limb, are important for duration of competitive life. From the prevalence of uneven feet in sports disciplines, it may be concluded that this is an undesirable trait, particularly at the elite level of jumping, since uneven feet have a detrimental effect on the duration of competitive life in a sport horse population. This study provided evidence that the conformation trait uneven feet has a negative effect on Warmblood jumping performance and, therefore, breeders should be encouraged to avoid this phenomenon at foal age. Moreover, Ducro et al. (2009b) assessed the prevalence and heritability of uneven feet and its genetic relationship to other conformation traits as well as to sporting performance later in life in Warmblood riding horses. Warmblood horse studbooks aim to breed horses with a conformation that will enable elite future performance, but reduce the risk of injuries and lameness. Negative conformational traits, such as asymmetrical or ‘uneven’ forefeet would possibly diminish performance. The databases of the Royal Dutch Warmblood Studbook (KWPN, n = 44 840 horses) and Royal Dutch Equestrian Sports Federation (KNHS, n = 33 459 horses in dressage and n = 30 474 horses in show jumping) were linked through the unique number of each registered horse (Table 12.3). Therefore, heritabilities and genetic and phenotypic correlations could be estimated from the scores of the jury at studbook admission and the sports performance of that population in dressage and jumping over the period 1990–2002. The prevalence of uneven feet was 53% on average, and increased from under 4.5% during the first 3 years of recording to over 8% in the years from 2000 onwards. Heritability estimates of foot conformation traits were moderate and ranged from 0.16 for heel height to 0.27 for hoof shape (Table 12.4). The genetic correlation between the trait of uneven feet and performance in competition was negative but weak: −0.09 with dressage and −0.12 with show jumping (Table 12.5). Predisposition to uneven feet can be reduced by selection, as there is a difference in mean prevalence in the offspring of registered breeding stallions (Fig. 12.2). Because of weak genetic correlations, the increased prevalence is not directly associated with selection for better sports performance or higher conformation grade. If the trait ‘uneven feet’ arises from a disproportionate relationship between height at the withers and neck length, then selection on conformation grade might result in development of uneven feet (Fig. 12.3). In general, limb conformation has a moderate genetic relationship to conformation grade and foot conformation traits have a genetic relationship to sporting performance. Reducing occurrence of uneven feet by selection is possible, without limiting progress in sport performance. Table 12.3 *Original marks, before analysis square root transformed. Reprinted from Ducro, B.J., Bovenhuis, H., Back, W., 2009. Heritability of foot conformation and its relationship to sports performance in a Dutch Warmblood population. Equine Vet. J. 41, 139–143, with permission from the Equine Veterinary Journal. Table 12.4 Standard errors of estimates were below 0.03; ne, not estimated. Reprinted from Ducro, B.J., Bovenhuis, H., Back, W., 2009, Heritability of foot conformation and its relationship to sports performance in a Dutch Warmblood population. Equine Vet. J. 41, 139–143, with permission from the Equine Veterinary Journal. Table 12.5 Prob, probability of equal means of basic and elite level in each discipline. From Ducro et al., 2009b. Fig 12.2 Mean prevalence of uneven feet in offspring related to number of sires (n = 44 480 horses from n = 630 sires). Reprinted from Ducro, B.J., Bovenhuis, H., Back, W., 2009. Heritability of foot conformation and its relationship to sports performance in a Dutch Warmblood population. Equine Vet. J. 41, 139–143, with permission from the Equine Veterinary Journal. Fig 12.3 Least square means by year of height at withers (red, in cm) of neck length (green, score) and prevalence of uneven feet (bars, with percentage prevalence on top) (n = 44 480). Reprinted from Ducro, B.J., Bovenhuis, H., Back, W., 2009. Heritability of foot conformation and its relationship to sports performance in a Dutch Warmblood population. Equine Vet. J. 41, 139–143, with permission from the Equine Veterinary Journal. Many monogenic anomalies in the horse have been described, a minority of which are related to the locomotor system (Galizzi Vecchiotti Antaldi, 1980a,b). Most of these disorders are inherited as autosomal recessive genes. Björck et al. (1973) described progressive congenital cerebellar ataxia in the Gotland pony breed as being inherited as an autosomal recessive gene with full penetrance. In Arabs a clinically similar condition described by Gerber et al. (1995) caused almost total hypoplasia or atrophy of the Purkinje cell layer. A lethal form of arthrogryposis (‘muscle contracture’) associated with polydactylia in the Norwegian Fjord horse was described by Nes et al. (1982) as an autosomal recessive mutation, whereas Buoen et al. (1997) suggested a possible relation to autosomal trisomy. Collinder et al. (1997) found for the equine rhabdomyolysis syndrome (RHA) in Standardbreds that gene frequencies for several markers in the RHA groups differed significantly from those estimated for the total population. A rhabdomyolysis risk group could be characterized using 4 or 5 genetic marker loci. Beech and Haskins (1987) described a neuroaxonal dystrophy in the Morgan. Aleman et al. (2009) proved that Malignant Hyperthermia (MH) is a potentially fatal disease of Quarter Horses that could be triggered by halogenated anesthetics and other nonanesthetic factors that may include exercise, stress, breeding, illnesses, and concurrent myopathies. Valberg et al. (1996) gave evidence for a familial basis for polysaccharide storage myopathy and associated exertional rhabdomyolysis in Quarter Horse-related breeds, the pattern of inheritance of which resembled an autosomal recessive disorder. Some disorders are inherited as dominant traits. An example that has been known for centuries in both animals and man is hereditary multiple exostoses (Li et al., 1989; Leone et al., 1987). In the horse the condition is generally inherited as a single autosomal dominant gene (Gardner et al., 1975; Shupe et al., 1979), though some report that, as in man, three genes are involved, two autosomal and one X-linked (Monteiro & Barata, 1980). The American Association of Equine Practitioners (AAEP) has listed genetic tests for nine single gene diseases (Nollet & Deprez, 2005; Finno et al., 2009) and this number is likely to increase in the coming years as the new genomics tools are utilized to identify the genetic variants underlying key equine disorders. ‘Autosomal dominant’ disorders include hyperkalemic periodic paralysis (HYPP) in the Quarter Horse, type 1 polysaccharide storage myopathy (PSSM) in different breeds, and malignant hyperthermia in Quarter Horse-related breeds (Aleman et al., 2009; Magdesian, 2009). ‘Autosomal dominant’ disorders include overo-lethal-white syndrome in the Paint Horse (McCabe et al., 1990; Blendinger et al., 1994), combined immunodeficiency in Arabian Horses (McGuire et al., 1974; Mottironi et al., 1981; Bernoco & Bailey, 1998), glycogen branching enzyme deficiency (GBED) in Quarter Horse-related breeds (Stockham et al., 1994, Wagner et al., 2006), junctional epidermolysis bullosa (JEB) in Belgians (Johnson et al., 1988; Frame et al., 1988; Milenkovic et al., 2003; Mömke & Distl, 2007) and in Saddlebred horses (Lieto et al., 2002; Lieto & Cothran, 2003; Graves et al., 2009), and hereditary equine regional dermal asthenia (HERDA) in Quarter Horse-related breeds (White et al., 2004; Tryon et al., 2005; Graves et al., 2009).
Genetic contributions to exercise and athletic performance
Historical background and the pre-Mendelian era
Selection for locomotor performance
New genomics technologies for trait mapping and gene expression
Selection for locomotor soundness
Conformational lameness-causing disorders

Neuromuscular lameness-causing disorders
![]()
Stay updated, free articles. Join our Telegram channel

Full access? Get Clinical Tree


Genetic contributions to exercise and athletic performance