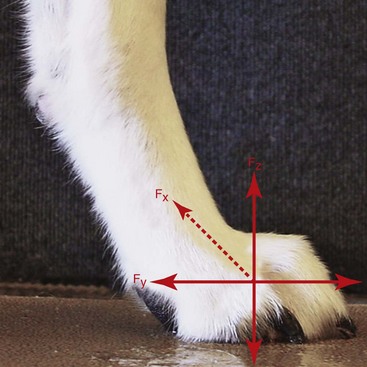
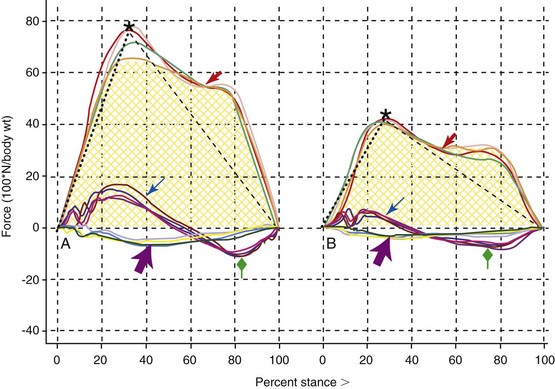
Chapter 74 Gait analysis is the investigation of locomotion. Parameters measuring spatial and temporal parameters and forces acting on the limb may be quantified and interpreted. This leads to an overall better understanding of gait and therefore the development of methods to facilitate the diagnosis of lameness, compare outcomes, and improve training for athletic animals. Gait analysis techniques range from rudimentary visual rating scales to complex computer-assisted motion detection equipment. Although inexpensive, visual rating scores are subjective and are subject to intraobserver and interobserver variation. Computer-assisted techniques are objective, reliable, and more sensitive than a trained observer in detecting lameness.69,85 Different techniques are used to assess different aspects of normal gait or to detect and quantify an abnormality. Gait parameters can be used to quantify weight bearing, ataxia, forces acting on specific joints, and compensatory changes in gait. In turn, these parameters have been used to compare surgical techniques, pharmaceuticals, and other orthopedic or neurologic treatments. Recently, certain types of gait analysis have been evaluated for use as an accurate diagnostic tool.30,32,40 Ground reaction forces are the forces placed on the limb during stance phase according to Newton’s third law: for every action, there is an equal and opposite reaction (Figure 74-1). As the limb contacts the ground, the reaction at the ground is measured. Forces vertical to the ground are represented on the Z axis. Mediolateral horizontal forces are depicted on the X axis, and craniocaudal forces are plotted using the Y axis. Ground reaction forces include peak vertical force (PVF), vertical impulse (VI), rising and falling slope, braking force, braking impulse, propulsive force, propulsive impulse, and mediolateral force. Another way to present the forces graphically is presented in Figure 74-2. In general, peak forces are the maximum forces generated in the described phase of gait, and the impulse is the area under the force-time curve. Ground reaction forces are measured using force or pressure platforms. Force platforms (also known as a force plate) are described by transducer type (e.g., strain gauge, piezoelectric sensors, capacitance gauge). The force platform is embedded into a walkway and is connected to specific software. Forces can be measured in the vertical and horizontal (craniocaudal and mediolateral) planes. Data are collected when a person (the handler) walks or trots the subject along the walkway, with the intended purpose of having the patient’s foot contact the force platform. Each attempt to collect data in this manner is referred to as a trial. Successful collection of data using a single force platform requires ipsilateral front and hindlimb contact, without contact from contralateral feet, for each trial. Use of a single force platform results in collection of data from the right or left limbs, but not both, for the trial. This limits each plate to use with a specific size of dog whose stride length can accommodate the size of the plate for precise foot placement. Multiple platforms can be embedded in succession into a walkway to provide information on all four limbs during each trial. Collecting data from multiple footfalls and limbs per trial improves the accuracy of data with regard to detecting asymmetry or evaluating compensation for lameness or neurologic impairment. Walkway distances are important and can affect vertical impulses and should be noted, but even short starting distances (2 m) do not affect peak vertical forces.28 Software accompanying force platform systems usually integrates a method for accurate velocity and acceleration measurement. (The effect of velocity is presented in another section.) Most systems use three photoelectric switches that are positioned a predetermined distance apart. This is an accurate method of determining trunk velocity.67,68 The time that the photoelectric beam is broken for each set of switches is used to calculate average overall velocity and acceleration. Preset velocity and acceleration ranges are used to accept or reject data collected for each trial. Punke et al. compared acceleration and velocity as measured by three photocells versus five photocells, including potential impact on trial inclusion.68 Although average velocities recorded using the two systems were significantly different, the ground reaction force data collected using the three-photocell system were not different from those collected using the five-photocell system.68 Use of the three-photocell system resulted in the exclusion of appropriate trials, decreasing the efficiency of the system. When the force plates are integrated into a treadmill, velocity is precise and constant for all trials, and acceleration is tightly controlled. Treadmills with integrated force plates have continued to gain popularity owing to distinct advantages. Treadmills require less space than the runway required for a traditional force plate and can measure contiguous footfalls.28 Also, the inclination of the treadmill may be altered and is easily changed from study to study.58 Bockstahler et al. investigated the reliability of force plates embedded into a treadmill. Investigators found that peak vertical force and stance time were reproducible over multiple different data collections times in normal dogs.9 Treadmills have been used to determine compensatory mechanisms in dogs and to compare lame versus sound.* Critics hypothesize that gait may be altered (especially force values) on a moving surface compared with self-propulsion on a normal substrate. Brebner et al. reported substantial to good agreement in ground reaction forces when a treadmill with an integrated force plate was compared with a single floor-mounted force platform.12 Pressure platforms have been used to collect ground reaction forces in dogs and cats.† Unlike force platforms, pressure platforms have multiple small pressure sensors aligned and embedded in platforms or walkways, creating a surface that is able to capture several simultaneous or consecutive footfalls. These pressure sensors act in an on or off fashion where only applied vertical pressure causes activation. Some pressure walkways have been compared with force platforms. Besancon et al. found a high correlation in ground reaction forces between a single force platform and a pressure walkway using normal dogs.6 Lascelles also evaluated the pressure platform compared with a force plate and found that ground reaction forces were significantly lower when measured by the pressure platform; however, the pressure platform was consistent and reliable.57 Force platform data are not interchangeable with pressure platform data, but pressure walkways are consistent and reliable.57 Peak vertical force and vertical impulse are unquestionable measures of function. They have been used as a gold standard for determination of functional outcome, and as an indirect measure of acute and chronic pain.* It is logical that the degree of lameness would correlate with pain; however, this is impossible to prove. It has been hypothesized that chronic pain may cause permanent alterations in gait.75 Despite this criticism, peak vertical force and vertical impulse are the two components of gait that are most commonly used when lameness between groups or subjects is compared over time.† These variables, with the addition of falling slope, have been evaluated as diagnostic tests for lameness.30 Individually, peak vertical force, vertical impulse, and falling slope are less accurate at determining lameness compared with combined peak vertical force and falling slope, with an accuracy of 98%.30 Another study measuring peak vertical force on a treadmill determined that the accuracy of the single variable in discriminating normal from lame was 92%.32 This was improved to 95% accuracy when the peak vertical force was combined with the rising slope.32 The peak vertical force is defined as the maximum force exerted perpendicular to the surface during stance phase and is represented at the top of the peak vertical force curve in Figure 74-2. The vertical impulse can be derived by calculating the area under the vertical force curve using time. The falling slope is the slope of a line from the maximal force to the end of stance time where force is 0, and the rising slope is the slope of the line where force is 0 at the start of stance phase to the maximum force.30,32 During lameness, peak vertical force is decreased because dogs tend to bear less weight on a painful limb. Vertical impulse typically decreases as well because force and time in stance are decreased during lameness, reducing the area under the force-time curve. However, vertical impulse does not distinguish lame versus sound Labrador Retrievers with cruciate disease as effectively as peak vertical force, the combination of peak vertical force and falling slope, or the combination of peak vertical force and rising slope.30,32 This is likely a result of the high variation inherent in vertical impulse.12 The falling slope of dogs with lameness is steeper, signaling rapid offloading. Therefore, dogs that do not reduce the maximum force (peak vertical force) on the limb offload it quickly, increasing the accuracy of combining peak vertical force with falling slope to distinguish lame from sound. Similarly, rising slope decreases, with lameness indicating slow loading of the limb and enhancing the accuracy of peak vertical force alone. Braking and propulsion forces may be useful in elucidating mechanisms of locomotion, but these variables are not used commonly as diagnostic or outcome measures. Mediolateral forces have been reported but are used only rarely.60 One study that evaluated these forces demonstrated that changes in braking, propulsion, and mediolateral forces may be a reflection of pathology of the coxofemoral joint prior to overt changes in vertical forces resulting from pain.60 However, variation in puppies appears to be greater than in adult dogs, limiting the utility of braking and propulsion as an outcome measure.60 The accuracy of braking and propulsion is less than that of peak vertical force in differentiating lame from sound dogs.32 Additionally, as the popularity of pressure walkways (which cannot measure braking and propulsion) increases, braking and propulsion are reported less often. Despite the limited use of braking and propulsion in orthopedic disease, propulsion is a significant variable in dogs with lumbosacral disease. Van Klaveren et al. reported a decrease in peak propulsive force in dogs with lumbosacral disease compared with normal controls. This result was confirmed by Suwankong et al. when a decrease in propulsive force was noted, but peak vertical force was not different between groups.79 Additionally, the peak propulsive force increased after decompressive surgery.82 Other less traditional locomotions have been studied using kinetics from major motions to small pressure distributions. Yanoff et al. measured vertical ground reaction forces in dogs landing after jumping an obstacle, and Alexander quantified the force need to leap.1,87 Besancon et al. quantified the pressure distribution of each foot pad during walking in dogs.7 This study confirmed that the third and fourth digits are the main weight-bearing digits, but the metacarpal and metatarsal pads bear significant weight.7 Studies like these may help elucidate our understanding of motion, leading to improved rehabilitation exercises. Although force platform gait analysis is easily performed, strict control of certain variables must be maintained to limit variation. In general, a valid trial is described as one in which the dog places a forelimb on the platform followed by the ipsilateral hindlimb without concurrent placement of contralateral paws. Additionally, velocity and acceleration are maintained within 0.3 m/sec and 0.5 m/sec2, respectively, whether gait chosen is at a walk or a trot.16,29,62 Even when treadmill embedded force plates are used, velocity is an important factor in controlling variation. In some studies evaluating gait at a walk, constant velocity is maintained as set on the treadmill, and that velocity is used for all dogs enrolled in the study.9,51 Other studies control velocity by identifying a comfortable walking and/or trotting speed for each dog, and dogs may be enrolled in the study as long as the velocity is within a certain range.11,33 Although velocity differences may affect variation from dog to dog, they are not a source of intradog variation when a treadmill is used.11,32 Velocity is nearly impossible to control in cats and other domestic animals in which gait is analyzed.23,71–73 In these cases, velocity is recorded and analyzed after data collection. If velocities do not fall into a range separated by 0.3 m/sec, velocity can be addressed statistically as a covariate. Subject velocity has been researched with regard to gait analysis. In general, walk and trot are the gaits of choice for analyzing ground reaction forces. These gaits are considered symmetric and can be maintained at a constant pace. In lame and sound animals, ground reaction forces generated at the walk and the trot are highly correlated.29,83 Each gate has its advantages depending on the clinical problem. Evans et al. found that a walk is better in situations where dogs have marked lameness (i.e., acute cruciate disease).29 Studies eliminating dogs that are unable to trot would be biasing the study toward the less lame. Conversely, Voss et al. compared dogs with low-grade lameness at both walking and trotting gaits and found that trotting was more sensitive than walking.83 The gait should be chosen in accordance with the expected level of lameness during the study. During a typical force plate evaluation, five trials are collected for each limb of interest and the results averaged. This is intended to limit intradog trial-to-trial or step-to-step variation. The number of trials was determined with mathematical modeling techniques using data from normal dogs; this has become convention for studies involving lame dogs.16,44,62,63 Although the data used to determine the trial number are based on data from normal dogs, dogs with chronic osteoarthritis have demonstrated similarly low intradog coefficients of variation.15 Additional sources of variation include the handler, subject morphology, dog acclimation, and day-to-day variation.63,76,77 Variation induced by different handlers can be attenuated by experience.48 However, subject morphology is a significant source of dog-to-dog variation in ground reaction forces.5,14,62 To account for these differences, ground reaction forces are standardized by subject weight.5,62 Ground reaction forces are presented as a percentage of bodyweight. For example, peak vertical force as a percent of bodyweight is calculated by dividing the kilograms (or newtons) of force by the weight of the dog in kilograms (or newtons) and multiplying by 100. Comparing the change in ground reaction forces from pretreatment to posttreatment values or using a symmetry index further reduces this source of variation but does not replace normalization by subject weight.81 Additionally, because subject morphology is important, when a study is conducted using force plate evaluation, block randomization may be used to evenly distribute dogs of different morphologies to treatment groups. Acclimation of dogs may be more important when ground reaction forces are measured via treadmill than when they are measured using a floor-mounted platform. Habituation on the treadmill decreases variation and may decrease alterations in gait caused by the treadmill. This improves the similarities of treadmill locomotion and overground locomotion.9,33,34 However, the number and duration of training sessions required for habituation vary considerably. Fanchon proposed a standardized habituation protocol for client-owned dogs requiring a single training session, where dogs were walked for 3 to 5 minutes and then were trotted for 4 minutes before data were collected.33 The significance of day-to-day variation in gait is controversial. Rumph et al. analyzed the ground reaction forces in normal Greyhounds, finding that 29 of 52 dogs had significant variation from day to day.77 Fanchon reported that the variation in vertical ground reaction forces due to different days was 10%.33 These authors advocate measuring ground reaction forces more than once prior to an intervention.33,77 However, other studies have not found significant day-to-day differences.39,44 Most studies investigating treatment effects report only one pretreatment gait analysis session.
Gait Analysis
Kinetic Gait Analysis
Equipment
Ground Reaction Forces
Variation
![]()
Stay updated, free articles. Join our Telegram channel

Full access? Get Clinical Tree


