Fig. 1.
Normalized distributions of MI projections to multiple forebrain targets following a unilateral tracer injection in the whisker (top) or forelimb (bottom) regions of MI. When each parameter (number of plotted varicosities or areal innervation) is summed across all targets, the total amount equals 100%. Compared to the MI forelimb region, injections in the whisker region produced more labeling in the contralateral hemisphere, especially in the thalamus and claustrum. Each bar represents mean labeling in seven rats; brackets represent SEM.
When two anterograde tracers are injected into MI cortex, one in each hemisphere, the amount of tracer overlap throughout the brain indicates which regions might integrate motor information from both hemispheres. In other cases, in which an anterograde tracer is injected in MI on one side and a retrograde tracer is injected in the same MI region of the opposite hemisphere, the presence of dense overlap among anterogradely labeled terminals and retrogradely labeled neurons provides strong evidence for an interhemispheric circuit. Using these approaches, we found that the MI whisker region has many more interhemispheric connections than the MI forelimb region. This chapter will use results from the MI whisker experiments to illustrate the techniques in these studies.
1.2 Outline of the Procedures
Although neuronal tracing has a long history and represents a classic technique in systems neuroscience, the details of many circuits have not been fully elucidated. Neuronal tracing is a valuable tool for revealing new information about the functional connections in many systems, but its use requires skill with several techniques. Furthermore, knowledge of the pitfalls that can interfere with the acquisition and interpretation of tracing data is needed to develop an experimental design that puts the techniques to their optimal use. Briefly, the procedures that we use to elucidate the interhemispheric circuit connections of the MI whisker region are as follows.
1.2.1 Select the Tracer Injection Sites
For anterograde tracing studies, intracranial microstimulation (ICMS) is used to identify the MI cortical sites that evoke whisker movements. A stimulating electrode is moved from one site to another to evoke movements of the whiskers or other body parts. For retrograde tracing studies, ICMS is rarely used to identify an appropriate site for injecting the tracer into a MI forebrain target. Instead, results from the anterograde studies indicate the stereotaxic coordinates that should be used to locate an appropriate injection site.
1.2.2 Inject the Tracers
Neuronal tracers are injected by pressure or iontophoresis, and each method has strengths and weaknesses. Pressure enables injection of a specific volume of tracer, but the tracer may diffuse more widely than desired or might flow along the space that surrounds the injection needle. By comparison, if the tracer molecule is relatively small and has an ionic charge, the polarity and magnitude of an iontophoretic current can be controlled to produce a concentrated tracer deposit at the tip of the injection pipette.
1.2.3 Reconstruct the Labeled Connections
A microscopic reconstruction system is essential for plotting the locations of terminals and cell bodies that are labeled by anterograde and retrograde tracers, respectively. While viewing the labeling patterns at high magnification, the microscope stage is moved until a labeled structure appears under the cross hairs of the eyepiece. Optical transducers are mounted on the microscope stage so that each stage position is encoded by X–Y Cartesian coordinates. By plotting labeled structures and other anatomical landmarks, the system uses the coordinate data to reconstruct their relative locations.
1.2.4 Quantify the Labeled Connections
The labeling patterns in the plotted reconstructions are analyzed by several methods to determine the relative strength of the connections between MI cortex and its subcortical targets. For each anterograde tracer that is injected into an MI cortical site, the areal extent and relative density of terminal labeling are bilaterally measured in each subcortical target. At the most densely labeled sites in each target region, confocal microscopy is used to count the number of labeled varicosities in a standard area to determine the maximum density of MI projections to each brain region.
If two anterograde tracers are injected into MI cortex, one tracer in each hemisphere, the amount of tracer overlap is measured throughout the forebrain to determine which targets might integrate information from both hemispheres. If an anterograde tracer injection in one hemisphere is paired with a retrograde tracer injection in the other hemisphere, the density and amount of terminal-soma overlap is measured to indicate the likelihood of an interhemispheric circuit connection.
Finally, in separate experiments, a single retrograde tracer is injected into the forebrain regions that receive strong projections from MI. The labeled neurons appearing throughout MI cortex and the surrounding regions are plotted and counted. Adjacent sections labeled for Nissl material are used to determine the cytoarchitectonic borders that define each cortical area, and these boundaries are then projected onto the plotted reconstructions to enable quantitative comparisons of neuronal labeling in each MI region of the two hemispheres.
2 Materials
2.1 Tracers
1.
Fluoro-Ruby (FR), Molecular Probes, Eugene, OR, D-1817, Prepare a 10% solution in 0.1 M sterile PBS for injection. Store solid and solution in light-tight container at 4°C. Shelf life exceeds 1 year when properly stored; solution stays stable for at least 6 months.
2.
Alexa Fluoro (AF), Molecular Probes, Eugene, OR, D-2290. Prepare a 10% solution in 0.1 M sterile PBS for injection. Store solid and solution in light-tight container at 4°C. Shelf life exceeds 1 year when properly stored; solution stays stable for at least 6 months.
3.
Fluoro-Gold (FG), Fluoro-Chrome, LLC, Denver, CO, H-22845. Prepare a 2% solution in 0.9% sterile saline (physiological) for injection. Store solid and solution in light-tight container at 4°C. Shelf life exceeding 1 year when properly stored; solution stays stable for at least 6 months.
2.2 Filter Sets for Fluorescent Microscopy
1.
Combined fluorescein isothiocyanate (FITC)/tetrarhodamine isothiocyanate (TRITC) filter for Fluoro-Ruby and Alexa Fluoro (Chroma Technologies, 51004v2).
2.
UV filter for Fluoro-Gold (Chroma technologies, 11000v2).
2.3 Microstimulation and Tracer Injection Equipment
1.
Hamilton microsyringe – Microliter#7002, 2 μl
2.
Kopf model 5000 microsyringe holder
3.
Ammeter
4.
Constant current source (e.g., Bak Electronics Inc., Model BSI-2)
5.
Electrode impedance tester (e.g., Bak Electronics, Model IMP-1)
6.
Programmable digital timer, (e.g., Master 8 by A.M.P.I.)
2.4 Reconstruction and Analysis of Neuronal Labeling Patterns
1.
AccuStage, Inc. Reconstruction System and MDPlot software, version 5.1
2.
Microscope for light and fluorescent microscopy
3.
Laser-based confocal microscope
4.
Illustration and drawing software program (e.g., Canvas X, Deneba Systems)
3 Methods
3.1 Select the Injection Sites
Intracranial microstimulation (ICMS) is used to identify appropriate sites in the MI whisker region for injecting anterograde tracers. A pipette puller is used to produce a glass pipette that has a tip diameter of 1 μm and, after it is filled with hypertonic (3 M) saline, an impedance of 1 MΩ. The electrode’s impedance is always measured before placing it in the brain to insure its suitability for ICMS. At least three stimulating electrodes are made just prior to each experiment, and they are temporarily stored in a saline-filled electrode-holding jar to prevent the formation of salt crystals at the electrode tip.
For ICMS, rats are anesthetized with intramuscular injections of ketamine HCl (20 mg/kg) and xylazine (6 mg/kg). After immobilizing the rat’s head in a stereotaxic instrument, a craniotomy is made over the MI cortical region and a small ground screw is placed in the cranium overlying the cerebellum (see Note 1). As shown by Fig. 2, the constant current source must be connected with both the stimulating electrode and the ground screw to form a complete circuit for ICMS.
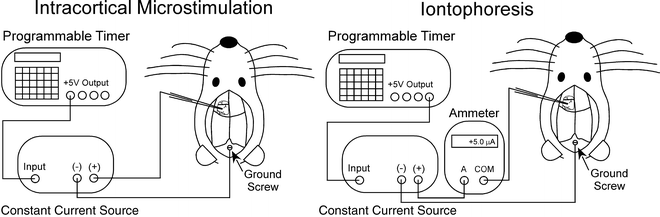
Fig. 2.
Schematic diagram of circuit connections for intracranial microstimulation in MI cortex and iontophoretic ejection of tracers such as Fluoro-Gold.
Muscle twitches can be evoked from MI cortex only if the animal is in a shallow plane of anesthesia. If the animal is deeply anesthetized, ICMS will not evoke muscle twitches even if high stimulation currents are administered. Furthermore, repeated application of a large stimulation current may destroy the neuropil at the electrode tip. Within 60–90 min of the initial anesthetic injection, the rat usually enters a shallow anesthetic plane that is characterized by small, spontaneous whisker movements in which the peak-to-peak whisker motion is no more than 1 mm. This indicates the moment when ICMS is most likely to be successful in evoking a peripheral movement (see Note 2).
Microstimulation mapping begins by lowering the stimulating electrode into the deep layers of MI cortex, which are located 1.2–1.7 mm below the pial surface. Initially, microstimulation consists of short trains (80 ms in length) of 0.7 ms current pulses that are separated by intervals of 3.3 ms. Hence, the experimenter activates the programmable timer so that each button press on the timer delivers a train of 20 pulses at a rate of 250 Hz (see Note 3). While observing the whiskers, the experimenter delivers a series of trains, usually at a rate of 1 Hz or less. Microstimulation should begin with suprathreshold positive currents of 100–150 μA. If the rat is lightly anesthetized and the tip of the stimulating electrode is in the deep layers of the MI whisker region, such currents will evoke robust movements of multiple whiskers, possibly on both sides of the face. The current level is gradually reduced to the lowest level that barely evokes twitches of a small number of whiskers on the contralateral face. The lowest level for evoking a single whisker twitch is usually about 10–20 μA. If ICMS does not evoke whisker twitches, the circuit connections and other factors must be carefully examined (see Note 4).
Rat MI cortex contains two whisker regions that are distinguished by their responses to short and long pulse trains. Brief whisker retractions are evoked when short train pulses are administered to the medial agranular cortex, which is known as the retraction area in the MI whisker region (MI–Re). The MI–Re region is located about 1.7–2.5 mm rostral and 1.5–2.2 mm lateral to bregma in the adult rat. A second, more caudal whisker region evokes whisker protractions when it is stimulated by short (80 ms) pulse trains but evokes rhythmic (5–15 Hz) whisking movements when stimulated by long (1,400 ms) trains administered at 60 or 100 Hz (i.e., 0.7 ms pulses separated by 16 or 9.7 ms). This region, which is called the rhythmic whisking area (MI-RW), is located about 0.7–1.2 mm lateral and 0.6–2.4 mm rostral to bregma (6). To verify that a stimulation site is in one of these regions, we sequentially administer a series of short pulse trains and then a series of long pulse trains at each electrode penetration. The digital timer allows multiple programs to be stored in memory, and switching between short and long pulse trains is done quickly if both sequences of pulse trains have been programmed and stored in memory prior to the start of the experiment.
Locating a suitable site for a tracer injection in MI cortex needs to be done rapidly because the animal’s plane of anesthesia is relatively shallow and reflexive movements could appear if the ICMS is not conducted efficiently. Furthermore, in cases where different anterograde tracers are injected into homotopical regions bilaterally, it is necessary to locate the same functional region in both hemispheres as quickly as possible. Another constraint is posed by the fact that even small tracer injections produce some diffusion, but the labeling data will not be interpretable if the tracer diffuses across the borders between the whisker and forelimb regions in MI.
For these reasons, we use threshold ICMS currents to locate the B, C, or D whisker rows in MI because these representations are in the center of the MI whisker region. Small injections at these sites should reduce the likelihood that tracer will diffuse beyond the whisker representation. We usually stimulate 4–8 sites in each hemisphere. After locating the center part of the MI whisker region, ICMS is administered more laterally in 500 μm steps until we identify a site that elicits forelimb movements (see Note 5). After locating the forelimb-whisker border, the tracer is injected into a site located at least 500 μm away, thereby insuring that the tracer does not diffuse across this functional boundary.
In rare cases, we have used ICMS to identify the whisker representations in subcortical brain regions that were injected with a retrograde tracer. For example, to determine whether the MI whisker region projects directly to the facial nucleus, which contains the cell bodies of the peripheral nerve fibers that innervate the whisker pad, we have injected a retrograde tracer into the lateral facial nucleus (see Fig. 3). In these cases, ICMS is used to locate sites in the facial nucleus that evoke whisker movements.
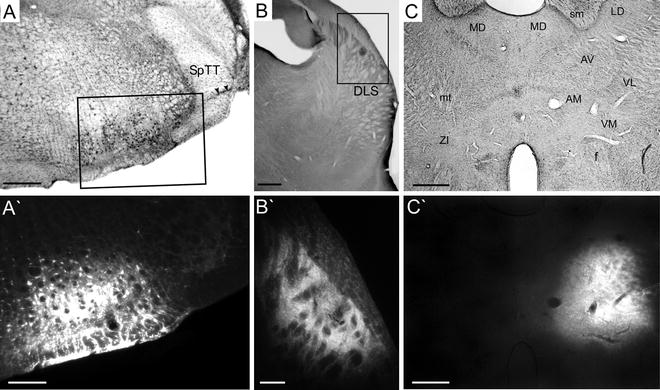
Fig. 3.
Examples of iontophoretic injections of the retrograde tracer Fluoro-Gold into the facial nucleus (a, a′), dorsolateral striatum (b, b′), and thalamus (c, c′). AM anteromedial, AV anteroventral, DLS dorsolateral striatum, f fornix, LD laterodorsal, MD mediodorsal, mt mammillothalamic tract, sm stria medullaris, SpTT spinal trigeminal tract, VL ventrolateral, VM ventromedial, ZI zona incerta. Rectangles in (a) and (b) indicate regions in (a′) and (b′). Scale bars = 250 μm in (a, a′), 200 μm in (b, b′), 500 μm in (c, c′).
For most forebrain targets of MI, ICMS is not effective for evoking whisker twitches. Tracer injections in these brain regions must rely on stereotaxic coordinates alone. Thus, after identifying regions in the thalamus, dorsolateral striatum, and claustrum that received projections from the MI whisker region, stereotaxic coordinates indicate where to place retrograde tracers in these regions (see Figs. 3 and 4).
< div class='tao-gold-member'>
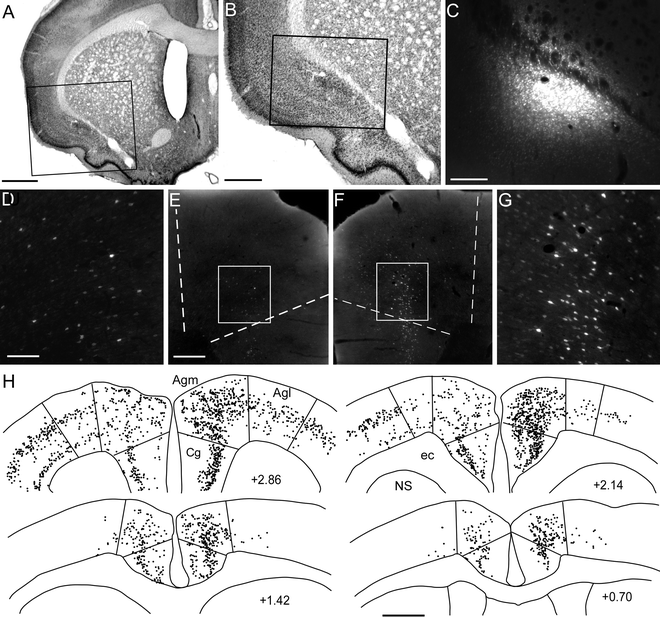
Fig. 4.
Bilateral labeling patterns of MI neurons produced by an injection of the retrograde tracer Fluoro-Gold into the left claustrum (a–c). Although neuronal labeling was present in multiple cortical areas of both hemispheres, labeling density was greatest in Agm of the right hemisphere (d–h). Scale bars = 1 mm in (a, h); 0.5 mm in (b); 250 μm in (c, e, f); 100 μm in (d, g).
Only gold members can continue reading. Log In or Register to continue
Stay updated, free articles. Join our Telegram channel

Full access? Get Clinical Tree


