12 Feeding the growing horse
Growth
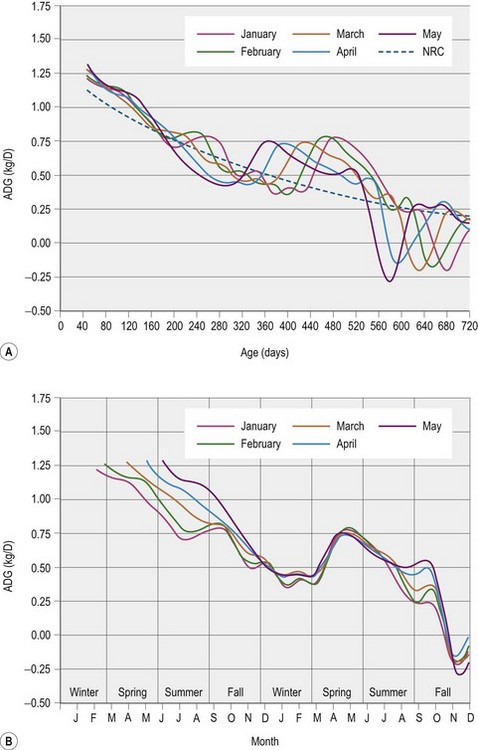
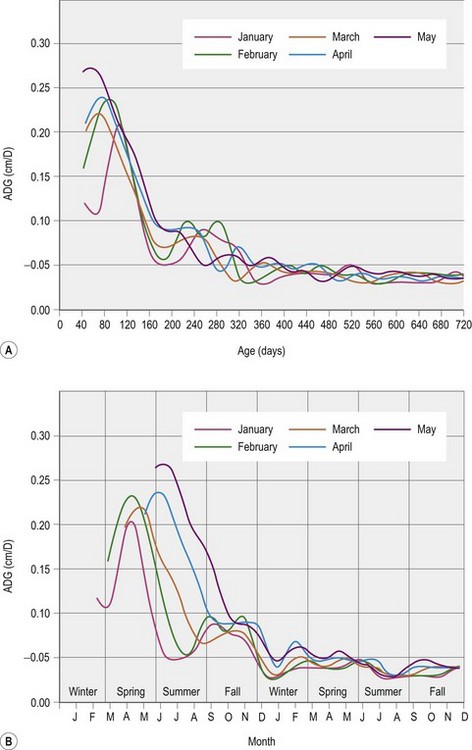
Growth is critical to the eventual development of a horse’s athletic potential. A very general definition of growth is an increase in size. Genetics and environment both play important roles in the expression of growth related traits. Each horse has a certain genetic potential for growth that is inherited from its sire and dam. This genetic potential relates mostly to the overall shape of the lifetime growth pattern and the mature size of the animal. As an example, the heritability of withers height has been estimated to be between 0.25 to 0.28 (Stock et al 2005). This can be interpreted to mean that roughly 26% of the phenotypic variation in withers height can be attributed to genetic variation. Environment, and nutrition as a component of environment, has a very important role to play. Nutrition’s impact on the lifetime growth pattern is likely to be seen more in short-term deviations from the longer-term genetically determined growth pattern. The short-term fluctuations seen in Figs 12.1 and 12.2 are examples of these short-term deviations.
At a cellular level, growth occurs both through an increase in the number as well as the size of cells. The mechanisms that control cell number and size are complex and still not well understood, but generally differences in size between animals can be accounted for by differences in the total number of cells. The cells themselves are not notably different in size between animals. The decrease in the rate of growth as an animal approaches mature size is mainly accounted for by a decrease in cell proliferation (Lui & Baron 2011). Some measures of growth that are commonly recorded for horses are body weight, wither height, body length, and cannon circumference (Hintz et al 1979, Staniar et al 2004a). Each of these measures will have a different pattern of growth, based on the tissues involved and the nutrients and energy being supplied (Hammond 1950).
Growth curves
Taking what we know of equine growth, it is difficult to develop a single all inclusive model to accurately describe the growth of all horses. The range of breeds, management scenarios, and owner objectives are part of what make this such a challenge. The pattern of equine growth from conception to maturity (5–7 years) can generally be described as a sigmoid curve. There are several examples of sigmoid curves fitting well to equine data (Walton & Hammond 1938, Staniar et al 2004b, NRC 2007). The point of inflection for most of these curves indicates that the horse is different from cattle, in that the most rapid rate of gain occurs just prior to parturition. This emphasizes the point that sufficient attention should be paid to the nutrition of the broodmare throughout gestation. Another characteristic of equine growth is a sine wave like pattern superimposed on the sigmoid curve (Staniar 2001). This sine wave pattern is likely associated with seasonal fluctuations in nutrient availability and ambient temperature and is commonly seen in horses raised away from the equator and kept outside (Dawson et al 1945, Pagan et al 1996). The presence of this pattern suggests that energy requirements should be adjusted based on local environmental conditions. Dr. Nadia Cymbaluk has conducted extensive research studying horses under changing climatic conditions and has suggested that digestible energy in the diet of growing horses should be increased by 1.3% for each degree Celsius below the lower critical temperature specific to the particular life stage of that horse (Cymbaluk 1994). Examples of these lower critical temperatures for a newborn foal are 16 to 26oC, for a week-old foal, 13 to 23oC, and as an adult –20 to 5oC (NRC 2007). In conclusion, equine growth can be described as following a sigmoid pattern, with an exponential increase in size occurring in utero, followed by a post parturition period during which the rate of growth slows as the mature size is approached.
Growth rate
Any evaluation of growth has to include a measure of the time over which that growth has occurred. Age in months or days is commonly used as a measure of time, and is often measured more precisely than body weight, a measure that is often estimated as most farms do not have access to a calibrated weighing machine/scale. As an example, in one of the few studies to use a body mass index, Donaldson et al (2004) used an estimate of body weight based on heart girth and body length. The fact that body weight was estimated makes it possible that the accuracy of these published data is not as good as it could be if actual weights had been used. No published studies have used this body mass index in growing horses, although it may be useful in further characterizing growth. Time is often implied when growth is defined as rapid, moderate, or slow. After all, it is the rate of growth that is being described with each of these modifiers, and that rate also changes with age. So a rapid growth rate for a 2- or 6-month-old Thoroughbred foal might be 1.2 or 0.9 kg/day, respectively, while moderate growth for the same foal at these time points might be 1 or 0.8 kg/day. There are a multitude of factors that can influence the rate of growth, making the definition of rapid, moderate, or slow a tricky business. Three factors that are probably necessary in defining these terms are breed, age, and date of birth. Figure 12.1(A) is an illustration of the rate of body weight gain in Thoroughbred foals, and is broken into average daily gain patterns based on the foals’ month of birth. Figure 12.1(B) provides a different perspective, by looking at the same data on a month of year basis. This figure makes it clear that it is not only age that influences the rate of gain but also time of year and that it is therefore important to examine growth using both these different time scales. Finally whilst the potential for growth decreases with age, during the first 2 years changes in the environment, particularly nutrition, continue to have the potential to have a large impact. This means that, in general, modifications to nutrition during the first two years of life may have a greater impact on the growth and development of tissues such as bone than in older horses. Finally, there has been relatively little comparison of the growth curves of horse breeds that might be expected to have significantly different patterns of growth (see Box 12.1).
Box 12.1
Do Different Breeds of Horse Have Different Patterns of Growth?
The horse of today is the product of breeding choices associated with its domestication and use. The horse is quite different from other livestock species in regard to the diversity of objectives its owners have, and in this way is similar to the dog. In both the dog and the horse, there is a wide phenotypic range in measurable size characteristics. This variability in mature size, leads to questions about associated differences in the pattern of growth between breeds (NRC 1987). The measurement of thousands of horses is required to develop growth curves that can be used to precisely compare different breed’s patterns of growth. While there are a large number of studies characterizing the growth of breeds like the Thoroughbred, or Warmblood-type horses, data for other breeds is scarce if not completely lacking. As was pointed out, information on the weight and rate of gain at different ages is critical to determining the energy and nutrient requirements. Most assume that all growing horses follow a common pattern of growth that is characterized by a sigmoid curve of the percent of mature size attained at different ages.
It is worth noting that the majority of growth analysis of horses has focused on changes in body weight, but the growth pattern of individual organs may be quite different from that of the whole body. Some examples of the percentage increase in size of different components of growth from birth to maturity in Thoroughbreds have been estimated based on sigmoid models of growth (Staniar et al 2005). Maturity in this case is defined as the asymptote of the sigmoid curve for each growth variable:
• An 18% increase in the length of the front cannon bones.
• A 130% increase in body length measured from the point of the shoulder to the point of the buttocks.
Growth composition
Growth composition can be described in tissue or chemical specific terms. When discussing energy and nutrient requirements for the growing horse, it is useful to describe tissue development in terms of adipose, muscle, and skeletal tissues. The building materials and energy required for each of these are generally different, and therefore the nutrition required for the optimal growth and development of these tissues changes, based on the growth rates of each tissue at the time the horse is being fed. Generally, the horse follows a tissue development pattern similar to other livestock species in that tissue specific maximum growth rates occur in the following sequence; bone followed by muscle, and then adipose. There is a relatively small body of literature on the actual body composition of growing horses (Martin-Rosset et al 1983, Doreau et al 1986, Martin-Rosset, 2005) An overview of the data indicates that both muscle and adipose tissue undergo significant growth in the 2 years following birth. This highlights the importance of both dietary protein and energy to supply the requirements of these large developing tissues. In relative terms the chemical composition of 1 kg of gain in a weanling will consist of more protein and less lipid than the same 1 kg in a 2-year-old, or said another way the older the horse is the greater the percentage of fat in every kg of gain.
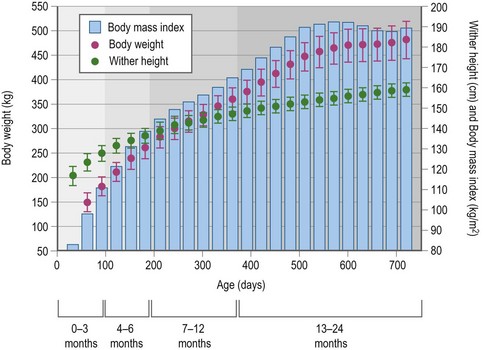
Tangential data on weight and linear measures of growth support the concepts discussed above. As an example, body weight and wither height growth patterns for approximately 2000 Thoroughbred foals from birth to 2 years of age are shown in Fig. 12.3 (Staniar, unpublished). The difference in these two patterns is likely due to the fact that changes in body weight reflect changes in all tissues, while wither height is more reflective of the skeletal structure and form of the horse’s forelimb. The body mass index (BMI) is a mathematical relationship of body weight divided by height2, and is commonly and effectively used as a measure of relative weight in humans (Keys et al 1972). An analogous equine body mass index has been developed for use in the horse, in which body weight is divided by the wither height2. It is of interest to note that the equine BMI between 1.5 and 2 years of age (Fig. 12.3) has reached 190 kg/m2 which is close to the median value of 196 kg/m2 calculated for a group of 82 horses representing at least 10 different breeds and ranging in age from 1 to 23 years of age (average, 10 years) (Donaldson et al 2004). While it is unlikely that overall growth has ceased in the 2-year-old, the relationship between body weight and wither height has stabilized. Based on this, body weight may not be the best indicator of nutrition’s impact on development during the first two years of life. Assuming that skeletal development is a priority for those raising equine athletes, measures such as withers height or other skeletal variables should be used in addition to body weight when evaluating the impact of nutrition on early equine growth. Body condition scoring is a technique used in adult horses that uses a subjective scaling of subcutaneous adipose stores to evaluate energy balance (Henneke et al 1983). A similar system for young growing horses has not yet been developed. Initially, a problem with using any of these measures of equine growth is that optimal patterns of development for each have not been defined. Future studies need to examine the relationships between observed patterns of growth and measures of success or failure, such as racing ability or occurrence of skeletal abnormalities.
Key Points –
Growth
• Genetics and environment both play critical roles in the pattern of equine growth.
• Growth can be measured in many different ways including most commonly changes in body weight and withers height. Other measures, such as girth or cannon circumference may also be useful
• Equine growth is most rapid near parturition, highlighting the importance of properly feeding the broodmare
• There are short term fluctuations in growth that are likely associated with changes in the growing horse’s environment, and these are overlaid on a long term genetically determined sigmoid pattern. The combination of these results in the observed pattern of growth
The above discussion of growth leads to the seemingly simple concept that the period during which growth occurs is a period of constant change. Therefore, the amount of energy and nutrients needed at one particular time point during this process may be different from those needed at another time point. One approach to determining the energy and nutrient requirements during growth therefore is to use information about the quantity (body weight), rate of gain, body composition (generally described in terms of protein, fat, and major minerals), and the utilization rate of energy or nutrients for building the individual components of the growing horse. While there is a large amount of data characterizing bodyweight and rate of gain, body composition and utilization rates are not well characterized. Martin-Rosset (Martin-Rosset 2005) summarizes the relative growth rates of different components of the equine body, breaking these down by anatomical designations and chemical composition. Using these data plus that collected by the German Society of Nutritional Physiology (M. Coenen, personal communication), it is possible to develop gross estimates of the protein and lipid gain during different phases of growth (Table 12-1). Protein and lipid gain are going to be the main sinks for dietary energy required for growth. It should be noted that the specific energy requirements for this gain needs to be added to the core primary maintenance requirement (see next section). Based on limited data, estimates of protein as a percentage of daily gain range from 18 to 30% and lipids from 4 to 22%. However, care should be taken not to over interpret these numbers, as there are many factors that are estimated, and the data supporting them is limited. As an example, it is not always clear whether compositions are described as a percentage of total body weight, empty body weight, or carcass weight. These designations need to be clear as the percent composition will change based on what is being examined. Having said this, the general changes over time are likely to hold for important substances such as protein and lipid. Understanding the chemical composition of gain is important because the dietary energy required will change based on the relative amounts of protein and lipid being deposited.
Table 12-1 Approximate Percentages of Muscle, Bone, and Adipose in Carcasses of Horses at 0, 12, and 30 Months of Age (Martin-Rosset 2005).
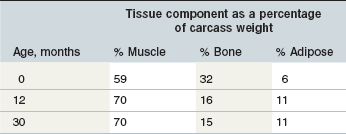
Generally, it appears that the horse follows a growth pattern similar to what is seen in other livestock species, with muscle reaching a peak in rate of gain prior to adipose tissue (Hammond 1950). Based on the fact that water content decreases from birth to maturity, it is likely that the contribution of protein initially and then mainly lipid, as a proportion of daily gain, will increase and so the energy requirement for gain will increase with age (Martin-Rosset 2005). The lack of data decreases our ability to make precise estimates of the requirements for key dietary constituents such as the individual amino acids. Research in this area would likely lead to improved precision feeding of horses to not only reduce the risk of diet related developmental problems, but also potentially improve the ability to realize the full athletic potential of a greater number of horses at maturity.
Energy requirements
Energy requirements for the growing horse are split between those for maintenance and those for growth. The split is relatively even early on, but as the foal gains weight, and growth slows, the maintenance component becomes proportionally larger than that for growth. The equation that defines the digestible energy (DE) requirement for growing horses published in the National Research Council’s nutrient requirements for horses contains components for maintenance (in bold) and growth (NRC 2007).
Those interested in calculating the DE requirements of their growing horse can enter the horse’s age in months (x), body weight (kg), and average daily gain (ADG; kg/day) in the above equation. There are numerous computer spreadsheet programs that once this equation has been entered into, will calculate an estimated DE requirement based on the data entered. This equation is a best estimate of energy requirements for growth based on an extensive review of research conducted prior to 2007 (NRC 2007). There are certainly still questions as to more precise estimates of the energy requirement for growth, but it is unlikely that any improved precision is going to come from a single equation. It is more likely that calibrations based on factors such as breed, date of birth, and climatic conditions will allow for improved precision at the cost of increased complexity. The complexity of growth is highlighted by the patterns of growth illustrated in Figs 12.1 and 12.2. Questions remain as to the exact reason each of these deviations occurs and whether additional energy alone could smooth the growth curves.
Dietary energy source
There are limited data on exactly how the foal’s diet changes while still with their dam and numerous factors affect how this change in diet progresses including frequency of suckling, length of each suckling bout, milk production, milk nutrient composition, dam temperament, and alternative feed availability. Regardless, it is generally accepted that foals will begin to ingest ingredients other than milk as early as 1 week of age and will slowly decrease the percent of their ration that the dam’s milk composes up until weaning (Crowell-Davis et al 1985). Another factor that influences the source of energy available to the foal is the decrease in lactase and increase in sucrase and maltase activity in the small intestine as the foal ages (Roberts, 1975). This integrates well with the transition from a milk-based to a plant-based diet and enables the growing horse to efficiently utilize the nonstructural carbohydrates in grains and other plant materials (see Box 12.2).
Excessive energy intake
High concentrations of dietary energy will increase the rate of growth up to the genetic potential. Dietary energy provided above this requirement will either be stored in adipose tissue or potentially contribute to a more subjective characteristic of heightened excitability. Periods of rapid growth have been associated with skeletal abnormalities in the horse as well as other livestock species (Hill 1990, Van Weeren 2006). While most horse owners would generally choose to avoid anything described as skeletal abnormalities, the group of conditions that fall under this set of terms range from mild angular limb deformities that may be generally considered a normal part of equine development to osteochondritis dessicans that may require surgery for a horse to remain sound. Research has demonstrated dyschondroplasia, one form of skeletal abnormality, in horses fed dietary energy as low as 129% of NRC (1989) recommendations (Savage et al 1993). In this same study, there was also a group fed 126% of NRC (1989) recommendations for crude protein, and a control group that was fed 100% of both dietary energy and protein. The rate of growth and presence of dyschondroplasia was only significantly higher in those horses fed 129% of the dietary energy requirement. Yet there are certainly horses that are fed this much energy or more that do not develop lesions. It is therefore very important to have a basic understanding of causation in order to appropriately evaluate the role nutrition potentially plays in increasing or reducing the risk of skeletal abnormalities as well as in supporting optimal growth (see Box 12.3).
Box 12.3
A Layman’s Description of Sufficient Causation
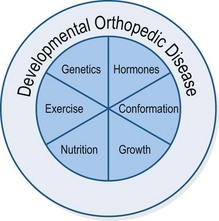
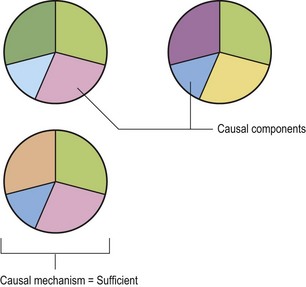
While the following discussion could be applied to understanding the causes of any outcome, here we will focus on developmental orthopedic disease (DOD) due to its importance to the growing horse. DOD is often discussed as a multifactorial disease, with factors such as nutrition, genetics, and exercise interacting with one another to cause the disease. The pie chart shown in Fig. 12.4 might be taken as a rudimentary illustration of this.
In his book on epidemiology (Rothman 2002), Dr. Rothman discusses causal components and mechanisms. Examples of causal components in this example would be each of the pie pieces in Fig. 12.5. A causal mechanism is the combination of components that are sufficient to result in the outcome, in this case DOD. The causal mechanism is the complete pie or in this case some combination of genetics, exercise, nutrition, growth, conformation, and hormones that will result in DOD occurring. Basic take home messages? (1) There are likely a number of different causal mechanisms made up of various combinations of causal components that will result in a particular outcome. (2) No known causal component by itself defines a causal mechanism. Therefore it is unlikely that nutrition, genetics, or exercise by themselves are sufficient to cause DOD. (3) By modifying individual causal components, such as nutrition, the risk of the causal mechanism being complete or sufficient can be raised or lowered. Therefore, changes in nutrition can increase or decrease the risk of DOD, but never prevent it completely. The reason it can never prevent DOD completely is because there are likely causal mechanisms that do not include nutrition.
