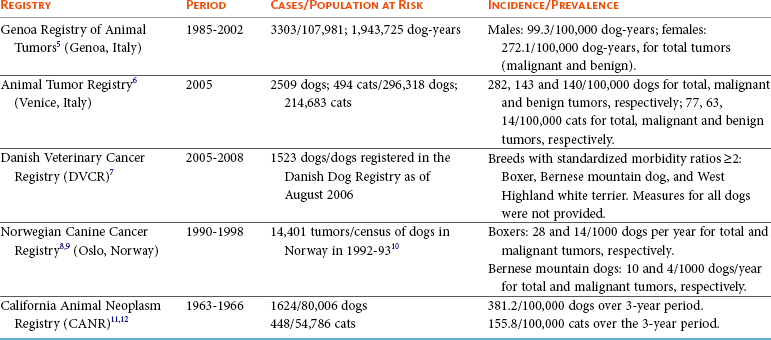
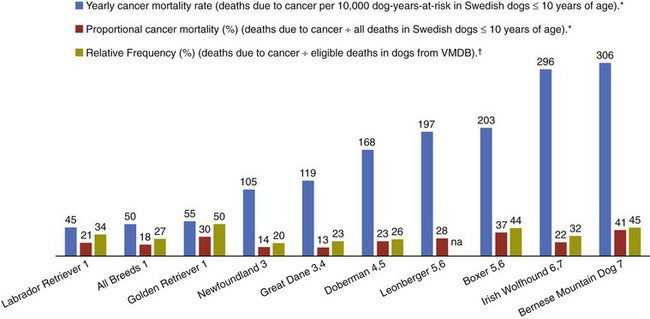
4 Epidemiology has been traditionally defined as the study of the distribution and determinants of disease in populations. Although historically epidemiologic methods were primarily used for the investigation of outbreaks and/or epidemics of infectious disease, the philosophies, attitudes, methodologies, and application of epidemiology are in fact more broadly applicable to research and clinical practice, regardless of species, disease, or discipline. Evidence-based medicine (EBM) is an approach to the practice of health care that is now well-accepted in the human and veterinary fields. Using the EBM approach involves a commitment to base all decisions on the best available evidence and to be explicit about the level and quality of evidence on which decisions are based. Much of the underpinning of EBM, including study design and interpretation, are also facets of epidemiology. Extensive literature is available on EBM and evidence-based practice in the human field (e.g., The Cochrane Collaboration [http://www.cochrane.org/about-us/evidence-base-health-care/webliography/books/ebhc]). The EBM approach can and should be applied to all interventions, including diagnosis and prognosis, and choice of preventive and clinical therapies applied to individuals, as well as decisions about health policy or control programs for populations. Pathophysiology forms the basis of our understanding of health and disease, but this knowledge, even combined with clinical acumen and experience, is not sufficient grounds for decision making across the spectrum of activities of health professionals. In order to have confidence that our interventions will be beneficial, we need to understand that personal and expert opinion are only anecdotal evidence, unless they are based on a valid appraisal of available evidence from the literature. In addition to embracing the philosophy of EBM, all clinicians must develop the knowledge and skills such as information management, critical appraisal, and causal reasoning that are needed to assess evidence in order to determine that their chosen interventions are both efficacious and effective (see glossary of terms in Table 4-1). Unfortunately, especially in veterinary medicine, there are many gaps in our evidence base, both in terms of validity and relevance of published studies. Table 4-1 In veterinary medicine, in general, and in certain specialties, including oncology, the trend has been toward a heightened sophistication of practice, including the use of advanced technologies in diagnostic testing (e.g., state-of-the-art imaging techniques and molecular characterization of tumors) and therapeutic interventions (e.g., interventional surgery and targeted, small molecule chemotherapy). This trend has been due in part to the presumption that most clients want care for their pets at more or less the level they themselves receive. Therefore many approaches and interventions have been adopted from human medicine and applied to animals despite considerable gaps in evidence as to their efficacy and/or effectiveness in the veterinary clinical situation. Additionally, even where a sufficient quantity of studies is present, the quality and consistency of reporting is frequently inadequate to allow systematic review or adequate comparison between studies.1 This issue is not unique to oncology and has spawned efforts to improve the reporting of veterinary studies, with a longer term goal of improving the quality of work.1–4 For example, the Journal of Veterinary Internal Medicine has initiated an effort to develop guidelines to improve the quality of reporting of therapeutic intervention studies in companion animals (e.g., the Companion Animal Reporting Expectations and Standards [CARES; Ken Hinchcliff, personal communication]) that are similar to the Consolidated Standards of Reporting Trials (CONSORT) guidelines used in the human field.4 To approach a level of care in veterinary oncology truly similar to that in humans, there will need to be an increased focus on EBM, and the CARES reporting guidelines represent an initial step toward better clinical evidence. Further information and articles pertinent to challenges of applying EBM in practice can be found on the website of the Evidence-Based Veterinary Medicine Association (http://www.ebvma.org) and the Centre for Evidence-Based Veterinary Medicine (http://www.nottingham.ac.uk/cevm/index.aspx). Cancer incidence data has been provided from several population-based cancer registries (Table 4-2). Estimates of canine cancer incidence range from 99.3 to 272.1 per 100,000 dog-years.5 Variation in estimates may be due in part to differences in actual cancer risks and/or variation in the base population. These registries included information from all cancer cases identified within a specified geographic region from a well-defined and enumerated population. One of the earliest, well-known cancer registries for companion animals was the California Animal Neoplasm Registry.11,13 This comprehensive effort began in 1963 with the goal of identifying all neoplasms diagnosed over a 3-year period among animals living in the San Francisco Bay Area Counties of Alameda and Contra Costa. The denominator was estimated by conducting a survey in a probability sample of households in Alameda County to derive the age, sex, and breed distribution of pets and to determine whether the household had used veterinary services. Additional information on former and existing cancer registries for companion animals has been comprehensively reviewed.14,15 Cancer prevalence information from population-based registries is also useful for surveillance and comparison between populations. Prevalence is the number of total cancer cases divided by the number of dogs in the population at risk at one point in time. For example, the prevalence of canine cancer in April 2005 was 143 per 100,000 dogs in an Italian population (see Table 4-2).5,6 Feline cancer prevalence has been reported from a population-based registry in Italy as 63 per 100,000 cats6 (see Table 4-2). These data were based on a telephone survey conducted among 214,683 residents of two provinces in northern Italy over a 3-year period starting in 2005. Earlier prevalence data for feline cancers have ranged from 51.9/100,000 cat-years from the California Animal Neoplasm Registry11,13 to 470.2/100,000 cat-years from the Tulsa Registry.16 In addition to population-based cancer registries, cancer occurrence data are abundantly available from veterinary teaching hospital databases as well as insurance databases. A caution to be noted when interpreting cancer occurrence information from hospital-based registries is that the size and characteristics of the underlying population at risk are not known17; thus neither true incidence nor prevalence measures can be calculated. Instead, the proportional morbidity ratio (PMR) is used to quantify cancer occurrence. For example, the PMR for a particular tumor type among a single breed is calculated as follows: Proportional measures are not to be interpreted as prevalence or incidence of cancer occurrence. As an example, Craig et al presents proportional statistics from a necropsy database and concludes that golden retrievers have an increased “risk” of tumors similar to that for Boxers.18 However, only the proportion of dead dogs that had cancer are available in that study, and these data cannot be used to estimate risk. Although proportional measures, such as those presented in a recent article by Fleming et al,19 have some usefulness for describing patterns within a breed, they are very risky to use for comparison across breeds in which population-based measures are unavailable and the degree of referral bias is unknown. In addition, in those data, 40% of deaths were unable to be classified pathologically and the unclassified proportion showed extreme variation across breed (e.g., from 16% to 60%). Using a subset of data from Bonnett et al, a study with information on the population at risk and data from the recent Veterinary Medical Database (VMDB) study, Figure 4-1 shows a comparison between proportional mortality ratios and true mortality rate.19,20 For golden retrievers, 30% of deaths (before 10 years of age in the Swedish insurance population) were due to cancer. For Leonbergers and Boxers, the proportional mortality was 28% and 37%, respectively. Proportional values for these three breeds may be similar, but, in fact, Leonbergers and Boxers have a risk for death due to cancer (before 10 years of age) that is almost four times as high as that for golden retrievers (approximately 200 deaths per 10,000 years-at-risk versus 55 [p > 0.05]). Irish wolfhounds and Bernese mountain dogs have an equal risk (approximately 300 deaths due to tumors per 10,000 dog-years at risk [DYAR]), but tumors account for over 40% of deaths in Bernese mountain dogs and only 22% in Irish wolfhounds. Note that these are deaths before 10 years of age. Comparing the proportional mortality values between the two studies, values for Bernese mountain dogs are very similar (42%, 45%), perhaps because almost all dogs of this breed would die before 10 years of age, whereas the values for golden retrievers are somewhat different (30%, 50%). Of course, there may be true differences between the two study populations and/or the differences may be influenced by referral bias and the high proportion of unclassifiable deaths in the VMDB study. Figure 4-1 Comparison of true mortality rate and proportional mortality for selected breeds. The 95% confidence intervals for mortality rates overlap for breeds with the same number (e.g., mortality risk in Labrador retrievers and golden retrievers was not different from that for all breeds combined). (Data from Bonnett BN, Egenvall A, Hedhammar A, et al: Mortality in over 350,000 insured Swedish dogs from 1995-2000: I. Breed-, gender-, age- and cause-specific rates, Acta Vet Scand 46(3):105–120, 2005*; and Fleming JM, Creevy KE, Promislow DE: Mortality in North American dogs from 1984 to 2004: An investigation into age-, size-, and breed-related causes of death, J Vet Intern Med 25(2):187–198, 2011.†) To further illustrate this example, using just the breeds in Figure 4-1 and data from the Swedish insurance database, if one ranked the breeds based on actual numbers of dogs that died due to tumors (e.g., perhaps how an oncology clinician would perceive the “risk,” based on dogs that present to a specialty clinic), golden retrievers would be number one because they are one of the more numerous breeds in this population. Likewise, if one ranked the breeds by the proportion of dead dogs that had tumors (e.g., similar to what would be reported in analysis of postmortem data), the top three would be Bernese mountain dogs, Boxers, and golden retrievers. So, in these examples, as has been frequently reported in the United States, based on proportional statistics, golden retrievers would be labeled as being one of the highest risk breeds. However, in looking at the true incidence based on these Swedish data, they do not have an increased risk compared to all breeds. There is likely considerable misunderstanding of the occurrence of cancer in dogs in the United States due to the lack of accurate incidence data and confusion about the interpretation of proportional statistics. Of course, where a breed is very common, like the golden retriever, and given that a considerable proportion of them die of cancer, that will represent an important population burden of disease, even if they are not truly the “highest risk” breed. Additionally, the Swedish data only include dogs up to 10 years of age; it is unknown how the statistics would look if dogs of all ages were included. As the authors (Bonnett et al) discuss, for cancer (or any cause of death) that occurs at older ages, a dog must live long enough to experience it (i.e., not die at a younger age due to any other cause) and deaths before 10 years of age are relevant to focus on for cancer prevention.20 One of the largest clinic-based databases is the VMDB.21 This database was started in 1964 by the National Cancer Institute, includes patient data from 26 university teaching hospitals in the United States and Canada, and contains over 7 million records from all species covering the full range of diagnoses, including cancer. This database is a widely used source of cancer surveillance information for companion animals; however, as was discussed previously (and presented in Figure 4-1), there is no information on the base population in these studies and only proportional measures can be calculated. Given that the data sources are teaching hospitals, patients, and diseases may not be typical of those seen in the general population. Therefore the results generated from passive surveillance such as the VMDB are likely to be influenced by referral bias. This type of selection bias affects estimates of disease frequency if the monitored clinics or hospitals have a predominance of patients that were referred for more specialized care. In fact, in a recent analysis using VMDB medical records from November 2006 to October 2007 for 9577 dogs and 4445 cats, it was concluded that substantial referral bias may exist.22 The authors suggested that the accuracy of prevalence estimates measured from the VMDB could be improved by statistical adjustment on the basis of geographic proximity to the university teaching hospitals.22 Two well-established insurance databases are from the United Kingdom23 and from Sweden.20,24,25 A notable limitation of these databases is that not all cases are histologically confirmed. The benefits and limitations of these data have been discussed extensively in the literature.26 From the U.K. database, using data from 1997 through 1998, cancer incidence among 130,684 dogs at risk was 747.9 per 100,000 dog-years.23 From the Swedish data, the overall mortality rate for cancer was 50 per 10,000 dog-years-at-risk (which equates to 500 per 100,000).20 The limitations with the Swedish data are that deaths are mainly in dogs 10 years of age or younger and it is unknown whether the diagnosis has been validated by histology.17 Osteosarcoma incidence rates were 6.1 and 5.0 dogs per 10,000 dog-years for males and females, respectively,27 and among females, breast cancer incidence was 111 dogs per 10,000 dog-years.28 Comparison across breeds within the Swedish data is quite informative, given that the limitations occur equally across breeds. Crudely comparing overall mortality rates for cancer, Bernese mountain dogs were approximately 6 times more likely to die of cancer compared to all dogs, combined (306 versus 50 per 10,000 DYAR, respectively).20 Where it was possible to do more sophisticated analyses, Bernese mountain dogs were shown to be 17 times more likely to die of cancer, compared to baseline, and adjusting for age, gender, and breed.25 Even if specifics of the population may not be the same as other populations, data such as these are important for identifying high-risk breeds. Comparison across populations and over time is needed, with due consideration of data issues. Studies on Swedish insurance data have presented statistics on morbidity and mortality in cats.29,30 As with dogs, the diagnoses are made by veterinarians, but further details are unavailable. The overall age-standardized mortality rate for death due to cancer in insured Swedish cats (generally <12 years of age) was 37 per 10,000 cat-years at risk (95% confidence interval [CI]: 28, 46). The most common types of cancer in the Swedish data were mammary, stomach/intestinal, and lymphoma. Siamese breeds were at increased risk of death due to neoplasia; mammary cancer was the most common type,31 in agreement with an earlier study.32 Differences between populations and data are no doubt affected by differences in various factors (e.g., spay/neuter rates and age structure of the populations). Further study of neoplasia in cats is needed. Observational studies are the tools of epidemiology used to identify and characterize the determinants of cancer risk. Information from descriptive studies such as case series may help to generate hypotheses but is not adequate as a basis for evidence-based cancer prevention strategies. Results from case series are also no longer accepted for publication in at least one major veterinary medical journal.4 Analytic observational studies such as case-control and cohort designs, on the other hand, are used to test research hypotheses, and when well-designed, can provide valuable information for cancer prevention strategies. The case-control study design is the most commonly used observational study design in veterinary epidemiology research and in cancer epidemiology research in general. This is the most efficient study design, in terms of cost and time, when evaluating associations with relatively rare outcomes, such as specific cancers. Unfortunately, as data collection is often retrospective, many potential sources of bias must be considered. The features of an ideally conducted study (e.g., with the least opportunity for systematic bias) include the complete ascertainment of all newly diagnosed cases with histopathologic confirmation of primary tumors and a random (or matched) selection of controls from the same base population as the cases. In a population-based case-control study design,33,34 we can assume that if a control subject had been diagnosed with the tumor of interest, that control would have been a case in the study (i.e., the controls are from the same base population as the cases). The goal of the control group is to represent the exposure experience of the base population. For this reason, we are not interested in selecting the “healthiest” subjects as our comparison group. In a hospital-based case-control study, both cases and controls are selected from the same hospital(s). The limitation with this design is that we cannot generalize the study results to a clearly defined base population. This design, however, is valid and can still provide meaningful results. When using this design, it is preferable to randomly or systematically sample from the non-case population and to not include animals that have been diagnosed with other cancers.35,36 The RR and OR are similarly interpreted. A value greater than 1.0 indicates that the exposure is positively associated with disease (increases risk), whereas a value less than 1.0 indicates that the exposure is inversely associated with disease (decreases risk). A value of 1.0 indicates no association between exposure and disease. The 95% CI indicates the precision of the RR or OR, and if the 95% CI includes 1.0, we interpret the RR or OR to be statistically nonsignificant. It must be remembered, however, that statistical significance does not necessarily equate with clinical importance. For the latter, the magnitude of the effect is also important to consider. Table 4-3 shows suggested guidelines for interpretation of risk estimates. When considering whether to implement preventive measures or health interventions at the population level, the following, in addition to the risk estimate, are also relevant: Prevalence of the factor (i.e., likelihood of exposure) and the prevalence of the disease. These values are used to estimate the attributable risk or risk-reduction measures. Table 4-3 Guidelines for Interpreting Clinical Relevance from Odds Ratios or Relative Risk Measures
Epidemiology and the Evidence-Based Medicine Approach
Term
Definition
Comments
Efficacy
How well a treatment works in those who receive it (e.g., correct formulation, dose).
May be proved in laboratory studies or clinical trials.
Effectiveness
How well a treatment works in those to whom it is offered.
Studies must occur in the environment and under conditions and with patients typical of those to whom it will be offered in practice.
Compliance
How closely a treatment protocol is followed.
Influenced by clinician, client, patient, formulation, duration, and so forth.
Coherence
How well findings reflect our understanding of biologic relationships/pathophysiology.
Limited by our current understanding.
Consistency
The extent to which new findings agree with previously published findings.
Limited by the current literature, traditional approaches, funding, and so forth.
Experimental studies
Traditional research approach done in a laboratory or highly controlled environment.
Potential for high validity, generally lower relevance to the clinical situation.
External validity
The extent to which a study’s findings can be extrapolated to a wider population. Similar terms include relevance and generalizability.
A function of the study population, methods, data collection, treatments, and so forth.
Incidence rate
The rate at which new events occur in a population:
(Number of new events in a specified period) ÷ (Number of individuals at risk during this period) × 10n
Cancer incidence rates are available from population-based data (e.g., cancer registry data) or prospective (cohort or longitudinal) studies.
Internal validity
The extent to which a study’s findings are likely correct for that study population.
Likelihood that systematic bias is responsible for the study findings reduces its validity (e.g., due to bias in selecting study participants, measuring the exposure, and confounding).
Observational studies
Epidemiologic studies that use existing comparisons in the species of interest in its “natural” environment (often client-owned animals, perhaps in veterinary practice settings).
Examples: (1) Case-control study: Researcher observes/describes exposures in individuals selected based on presence/absence of the outcome; (2) Cohort study: Individuals with different exposures are followed and incidence of outcome(s) is observed.
Randomized controlled trial (RCT)
Randomized refers to the random allocation of exposure.
Controlled refers to appropriate comparison groups (e.g., placebo or standard treatment).
Trial is generally conducted in a clinical setting.
Researcher exerts control over which individuals receive which treatments or exposures and observes outcomes.
Prevalence
The number of events in a given population at a designated time:
Number of events at a designated time ÷ Number of individuals at risk at the designated time
Taking the number of canine cancers that are observed in a clinic or several clinics during a designated period of time and dividing by the total number of patients seen during the same period is a proportional measure, not prevalence.
Proportional morbidity or mortality
The number of events (e.g., disease, death) in a limited population (e.g., animals presenting to the clinic, total deaths) at a designated time.
Proportional measures are used when the underlying population at risk is not known.
Measures of Disease Occurrence
Incidence
Prevalence

Sources of Information on Cancer Occurrence
Factors Associated with Cancer Risk


Inverse Association ≈ Decreased Risk
Clinical Relevance
Positive Association ≈ Increased Risk
1.0
Not evident
1.0
0.7 to <1.0
Weak
>1.0 to 1.5
0.5 to <0.7
Moderate
>1.5 to 2.0
0.3 to <0.5
Strong
>2.0 to 3.5
<0.3
Very strong
>3.5 ![]()
Stay updated, free articles. Join our Telegram channel

Full access? Get Clinical Tree


Veterian Key
Fastest Veterinary Medicine Insight Engine