Chapter 4 Echocardiography and Doppler Ultrasound
TYPES OF IMAGING
Two-Dimensional Echocardiography
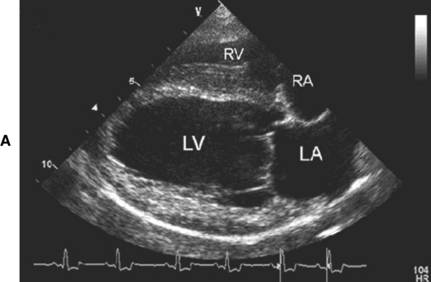
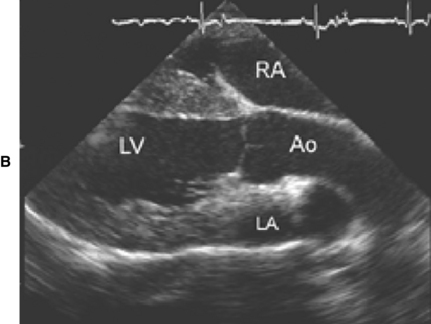
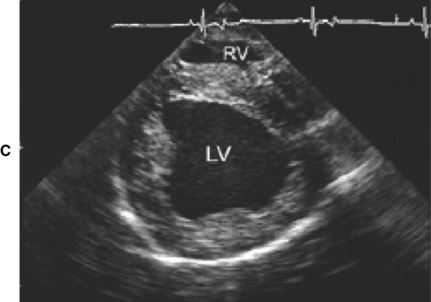
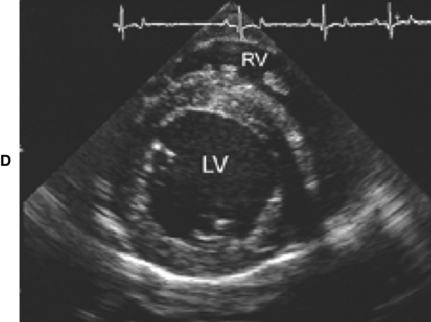
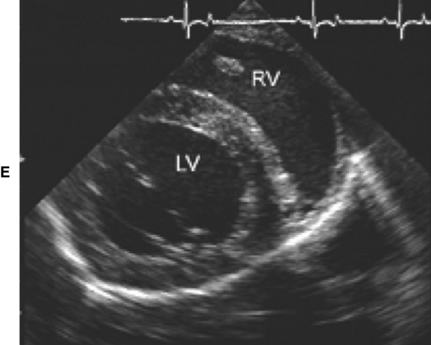
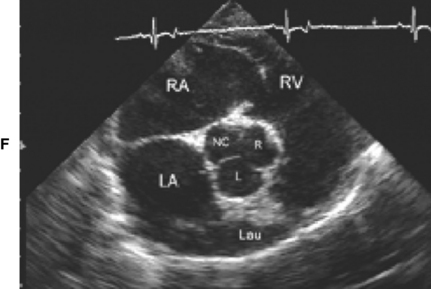
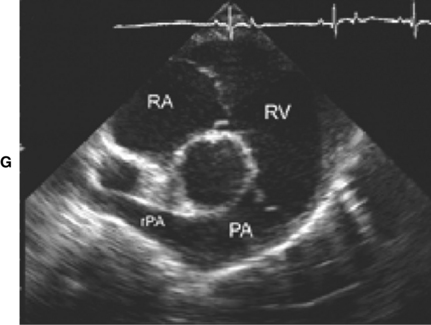
Figure 4-1 Right parasternal echocardiographic views. A, Long-axis four-chamber view optimized for left ventricular inlet. B, Long-axis view optimized for left ventricular outflow tract. C, Short-axis view at the papillary muscle level. D, Short-axis view at chordal level. E, Short-axis view at mitral valve lavel. F, Short-axis view at the heart base, optimized for left atrium and aortic valve. G, Short-axis view at the heart base, optimized for pulmonary artery. LA, Left atrium; LV, left ventricle; RA, right atrium; RV, right ventricle; Ao, aorta; R, right coronary sinus of Valsalva; L, left coronary sinus of Valsalva; NC, noncoronary sinus of Valsalva; PA, pulmonary artery; rPA, right pulmonary artery.
M-Mode Echocardiography
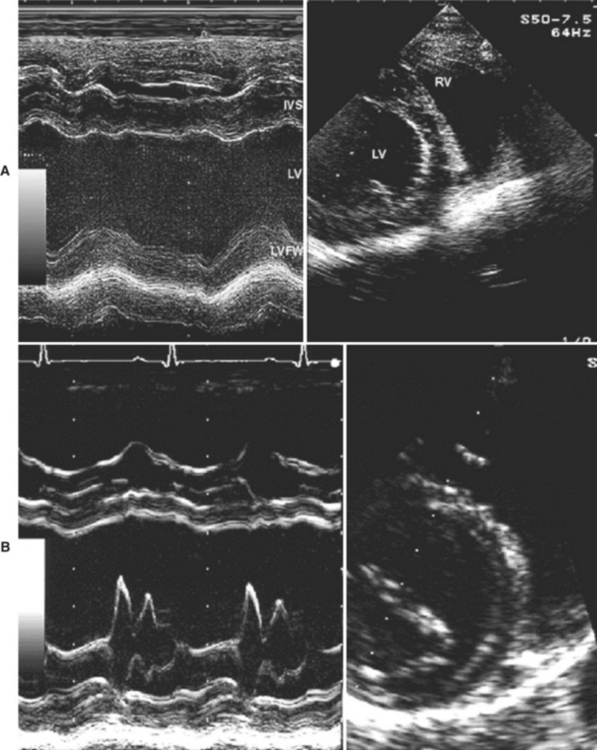
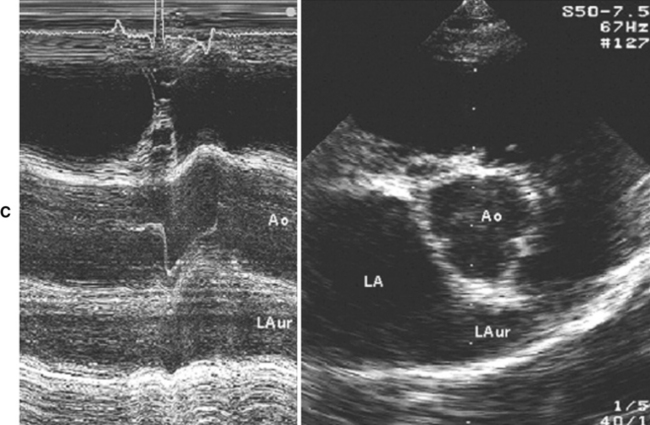
Figure 4-2 M-mode echocardiograms of the left heart at the mitral valve chordal level (note that the 2D image is moved to the left of the screen to allow correct placement of the cursor) (A); mitral valve leaflet level (B); aortic valve level. (C). IVS, Interventricular septum; LV, left ventricle; LVFW, left ventricular free wall; RV, right ventricle; Ao, aorta; LA, left atrium; LAur, left auricle.
Doppler Echocardiography
There are several modes of Doppler echocardiography:
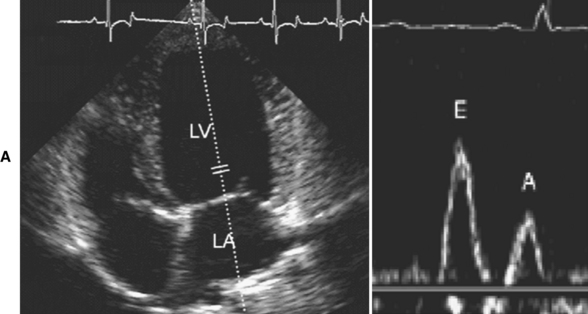
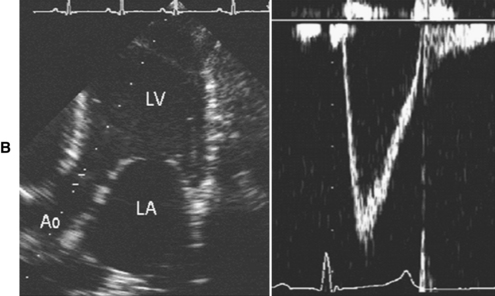
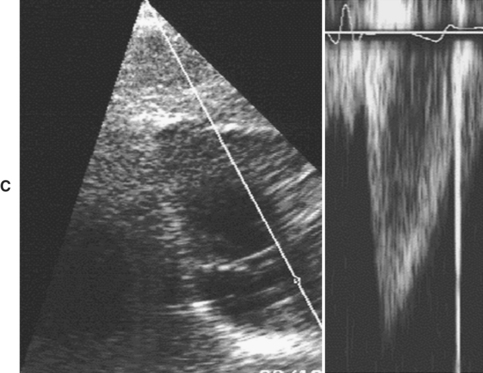
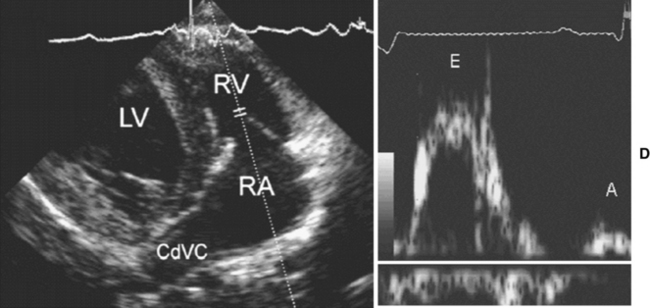
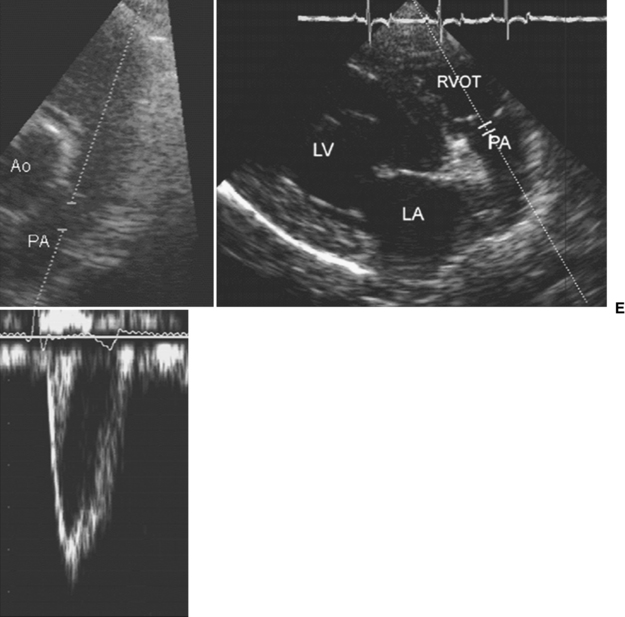
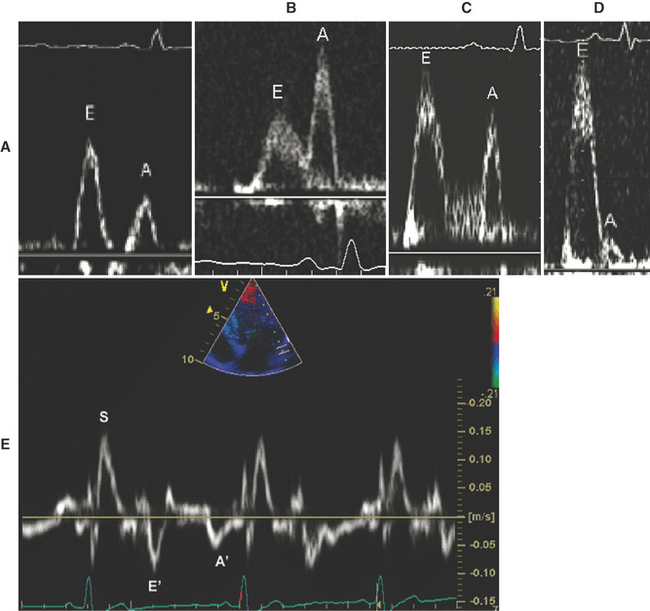
Figure 4-3 Doppler echocardiographic studies. A, Mitral inflow obtained from the left caudal parasternal (apical) four-chamber view, with the cursor placed parallel with mitral inflow, and a small sample volume placed at the tips of the mitral valve leaflets when the mitral valve is open. The typical spectral Doppler waveform of mitral inflow displays an early diastolic (E) wave and an atrial contraction (A) wave of filling. B, Aortic flow obtained from the left caudal parasternal (apical) “five–chamber” view, showing left ventricular outflow tract and placement of pulsed wave sample volume in ascending aorta. The typical spectral Doppler waveform of aortic flow is displayed. C, Aortic flow obtained from the subcostal view, showing continuous wave cursor positioned in ascending aorta. The typical spectral Doppler waveform of aortic flow is displayed. D, Tricuspid valve flow obtained the left cranial parasternal view optimized for right ventricular inflow. The pulsed wave sample volume is placed at the tricuspid leaflets tips, with the probe in a cranial position. The spectral waveform is similar to that of mitral inflow, although sometimes an additional systolic forward flow wave is recorded. E, Pulmonary artery flow from the right parasternal short-axis view optimized for right ventricular outflow (left panel) with the pulsed wave sample volume positioned in the main pulmonary artery, and from the right cranial parasternal view optimized for the pulmonary artery (middle panel). The typical spectral Doppler waveform of pulmonary artery flow is displayed. LA, Left atrium; LV, left ventricle; RA, right atrium; RV, right ventricle; CdCV, caudal vena cava; Ao, aorta; RVOT, right ventricular outflow tract; PA, pulmonary artery.
Spectral Doppler Echocardiography
High-Pulse Repetition Frequency Doppler
Applications
Stay updated, free articles. Join our Telegram channel

Full access? Get Clinical Tree


