Fig. 14.1
A flow chart of different experimental procedures, including perfusion -fixation (a), immersion-fixation (b), quick-freezing (c), and in vivo cryotechnique (d) for living mouse heart s
Fig. 14.2
A schematic drawing shows how to perform “in vivo cryotechnique ” (IVCT) for living mouse heart with monitoring electrocardiogram (ECG) (a). Beating heart of an anesthetized mouse on a small animal respirator is exposed after opening the thoracic cavity, which is cryofixed by pouring isopentane -propane cryogen (−193 °C) precooled in liquid nitrogen (b). An example of ECG shows typical P, Q, R, S, and T points, and the exact time of stopping with IVCT is indicated by an arrow
14.3 Immunohistochemistry of Serum Proteins
Paraffin sections of about 3 μm thick were routinely deparaffinized and stained with hematoxylin-eosin (HE). The other deparaffinized sections were stained with immunoperoxidase-DAB methods for each antibody . The primary antibodies were goat or rabbit anti-mouse albumin , goat anti-mouse immunoglobulin G 1 (IgG1 ), sheep anti-BSA, and rabbit anticonnexin 43 antibodies. The secondary antibodies were biotinylated anti-goat IgG , biotinylated anti-rabbit IgG, and biotinylated donkey anti-sheep IgG antibodies [3]. For immunofluorescence staining of the albumin , IgG1, and connexin 43 , the secondary antibodies were Alexa Fluor 488-conjugated donkey anti-goat IgG and Alexa Fluor 594-conjugated donkey anti-rabbit IgG antibodies, which were incubated together with TOPRO-3. For the immunofluorescence staining of BSA, the tissue sections were visualized using Alexa Fluor 546-conjugated streptavidin after incubation with primary sheep anti-BSA antibody and biotinylated donkey anti-sheep IgG antibody.
All the immunostained sections were embedded in glycerol or VECTASHIELD, and their light micrographs were taken using either a light microscope or a confocal laser scanning microscope .
14.4 Semiquantitative Analyses of Immunoreaction Intensity
For the semiquantitative analyses of IgG1 immunoreactivity as reported previously [12], 20 micrographs of heart tissue immunostained for IgG1 were randomly selected from the 4-h BSA injection group and the normal group or four different preparation method groups. The immunoreactivity in their blood vessel s , interstitial matrices, and cardiomyocyte s was classified into five categories, which were negative (−), unclear (±), immunopositive (+), moderately immunopositive (2+), and strongly immunopositive (3+), by three investigators under a light microscope. Such semiquantitative data of IgG1 immunoreactivity were statistically analyzed by the nonparametric Kruskal-Wallis H-test using SPSS 11.5 software for Windows. A score of P < 0.05 was considered to constitute a significant difference between the control and different experimental groups.
14.5 Morphological Analyses of Heart Specimens
As shown in Fig. 14.3a with IVCT, the blood vessel s are clearly open and contain flowing erythrocyte s . However, with FQF (Fig. 14.3b), erythrocytes are aggregated in the blood vessels of the resected heart tissue owing to loss of blood pressure. With PF-DH, no erythrocytes are seen in the widely opened blood vessels (Fig. 14.3c), although, with IM-DH, erythrocytes are seen in the collapsed blood vessels (Fig. 14.3d).
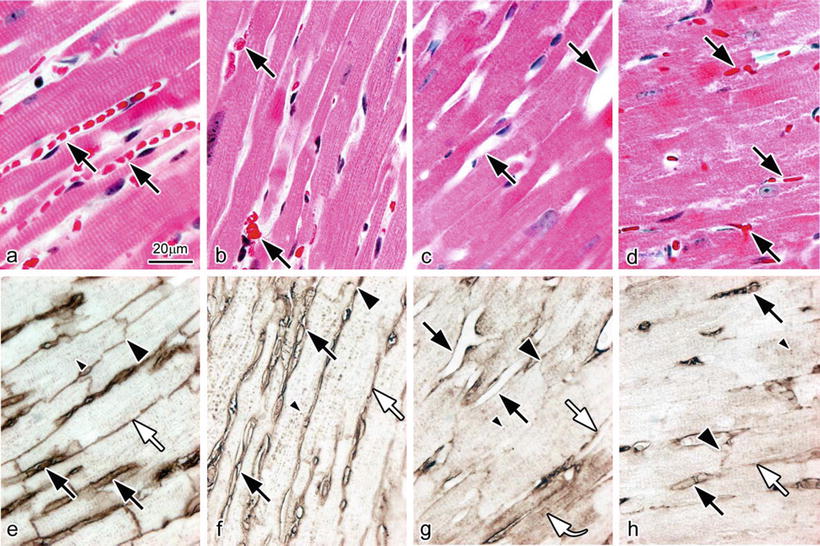
Fig. 14.3
Light micrographs of hematoxylin-eosin staining (HE; a–d) and immunostaining for serum albumin (Albumin; e–h) on serial sections prepared by IVCT (a, e), FQF (b, f), and PF-DH (c, g) or IM-DH (d, h). Bar = 20 μm
In specimens prepared with IVCT, immunoreactivity of albumin was detected not only in the blood vessel s but also on the lateral side among the cardiomyocyte s representing the interstitial matrices. It was also detected in the intercalated disks and T tubules of cardiomyocytes (Fig. 14.3e). The immunolocalization of albumin observed with FQF was similar to that with IVCT (Fig. 14.3f), showing that it was detected in the intercalated disks and T tubules of cardiomyocytes in addition to the blood vessels and interstitial matrices. In contrast, in specimens prepared with PF-DH (Fig. 14.3g), the immunoreactivity of albumin became obscure in all parts. Some albumin was washed out from the blood vessels or the interstitium and some got into the cytoplasm of some cardiomyocytes, showing diffusion artifact s because of perfusion pressure (Fig. 14.3g, curved arrow). In specimens prepared with IM-DH (Fig. 14.3h), less albumin was seen in the intercalated disks and T tubules of cardiomyocytes. Semiquantitative analyses of serum albumin immunoreactivity among the four different preparation methods were carried out for the immunostained heart tissue of normal mice (Table 14.1).
Table 14.1
Semiquantitative comparison among immunoreactivities of serum albumin in mouse heart tissues with different preparation methods
IVCT | FQF | PF-DH | IM-DH | |
|---|---|---|---|---|
Blood vessel | 2+ | + | ± | + |
Interstitium | 2+ | + | − ~+ | ± |
Intercalated disk | 2+ | + | − ~+ | − ~+ |
T tubule | + | + | − ~+ | − ~+ |
Cytoplasm of cardiomyocyte | − | − | − ~+ | ± |
14.6 Immunolocalization of Serum Proteins in Living Mouse Heart Tissue
With IVCT, the exact stopping time of a beating heart was accurately recorded by ECG (Fig. 14.4a), reflecting the living heart morphology at the time of freezing. In the present study, albumin passed across the vascular endothelium into the interstitium (Fig. 14.4c), and IgG1 also passed across the vascular endothelium and immunolocalized in the interstitium in addition to the blood vessel s (Fig. 14.4d). Furthermore, serum albumin also got into the intercalated dis ks and T tubules of cardiomyocyte s (Fig. 14.4c). In addition, connexin 43 was clearly immunolocalized at gap junction s distributed in the intercalated disks (Fig. 14.4e).
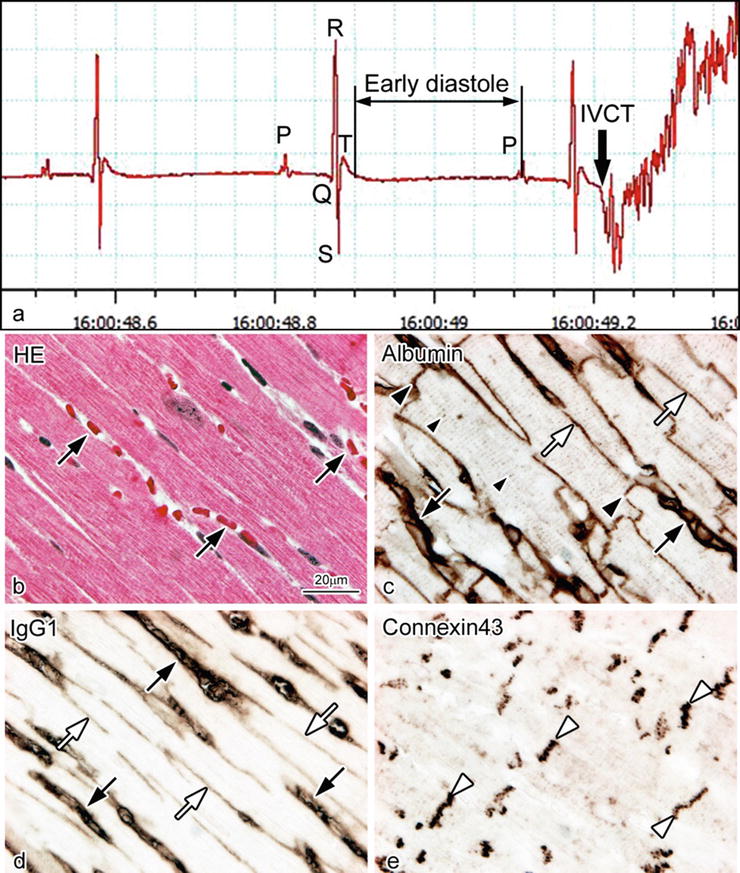
Fig. 14.4
Light micrographs of serial sections of mouse heart tissues prepared by IVCT. They were stained with hematoxylin-eosin (HE; b) or immunostained for albumin (c), immunoglobulin G 1 (IgG1 ; d), and connexin 43 (e). By electrocardiogram (a), the exact stopping time of a diastolic heart is accurately recorded, reflecting its living morphology (b). Bar = 20 μm
Double immunofluorescence staining for albumin and IgG1 revealed that albumin was immunolocalized in the intercalated disks and T tubules (Fig. 14.5a–d) and that both albumin and IgG1 were also immunolocalized in both the blood vessel s and interstitium . Double immunofluorescence staining for albumin and connexin 43 (Fig. 14.5e–h) revealed that the albumin was detected close to connexin 43, without overlapping with it, which represents the intercalated disk at the longitudinal terminal of the cardiomyocyte s [11]. Double immunofluorescence staining for connexin 43 and IgG1 revealed that IgG1 was not immunolocalized in the intercalated disk (Fig. 14.5i–l). They were more clearly shown at higher magnification (Fig. 14.5d, h, l).
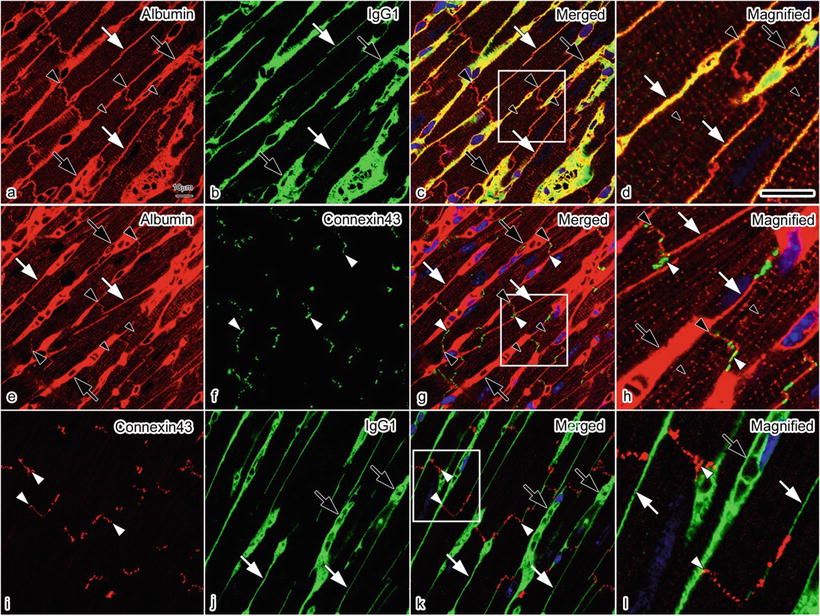
Fig. 14.5
Confocal laser scanning micrographs of double immunofluorescence staining for albumin (red) and IgG1 (green) (a–d), albumin (red) and connexin 43 (green) (e–h), and connexin 43 (red) and IgG1 (green) (i–l) in living mouse heart tissues with IVCT. Bars = 10 μm
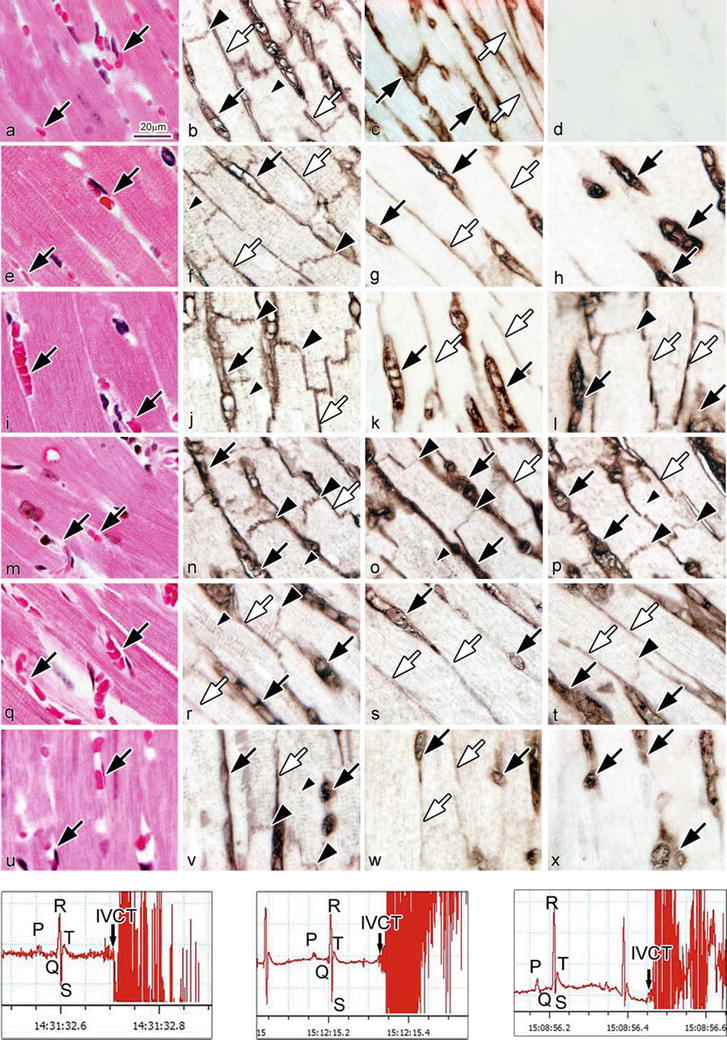
14.7 Time-Dependent Immunolocalizations of Albumin and IgG1 After BSA Injection
With the saline injection, BSA immunoreactivity was not detected in living mouse heart tissue (Fig. 14.6d). At 5 min after BSA injection, BSA was immunolocalized only in the blood vessel s (Fig. 14.6h). At 30 min, it was immunolocalized both in the blood vessels and interstitium and in intercalated disks and T tubules of cardiomyocyte s (Fig. 14.6l), in a pattern similar to that of albumin (Fig. 14.6j). At 48 h, it disappeared from the intercalated disks, T tubules, and also the interstitium and was only immunolocalized in the blood vessels (Fig. 14.6x). IgG1 was also slightly immunolocalized in the intercalated disks at 4 h after the BSA injection (Fig. 14.6o) and recovered to its normal immunolocalization of mouse heart tissue at 8 h (Fig. 14.6s). Semiquantitative comparison among relative immunoreactivities of albumin, BSA, and IgG1 in different areas of the heart tissue was performed for normal mice and the mice with different BSA injections (Table 14.2). Semiquantitative analyses of IgG1 immunoreactivity in different areas of the heart tissue were also performed in normal mice and the 4 h BSA injection mice (Table 14.3). The recorded ECGs were first compared between the experimental and control groups to check whether there were any changes of electrical impulses after the BSA injection. As shown in Fig. 14.6y–aa, there were no significant differences between BSA injection samples.