CHAPTER 125 Diagnostic Value of Magnetic Resonance Imaging in Horses with Foot Pain
Magnetic resonance imaging (MRI) has become the benchmark for diagnostic imaging in veterinary medicine, and its usefulness in human medicine is undisputed. Unlike all other forms of imaging, MRI provides exceptional images of normal and abnormal conditions in soft tissue and osseous structures. Because MRI can reveal abnormal accumulations of fluid, it provides a dynamic indication of the significance of abnormal findings in all tissue types.
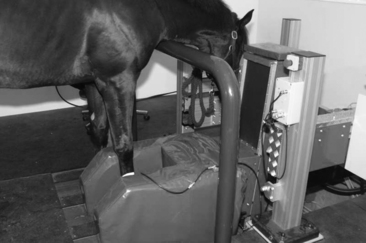
Motion is one of the greatest challenges of MRI, and limiting movement is integral to producing a diagnostic image. For most musculoskeletal applications, motion is a result of patient discomfort. For studies performed with the horse standing (Figure 125-1), detomidine hydrochloride (0.005 mg/kg) and butorphanol tartrate (0.005 mg/kg) are administered through an intravenous (IV) catheter. The horse is positioned in the magnet after several minutes, and a continuous IV infusion of detomidine hydrochloride (40 mg in 1 L lactated Ringer’s solution) is administered at a rate of 1 drip every 2 seconds to effect.
BRIEF OVERVIEW OF MRI PHYSICS
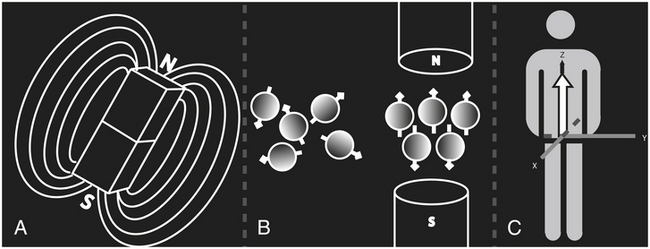
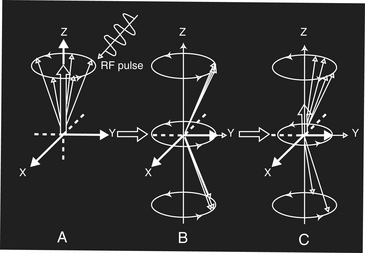
Tissues contain many hydrogen nuclei (protons), including those found in water. The presence of hydrogen nuclei in water and the central role of edema in the inflammatory process enable use of MRI as a powerful means of mapping tissue damage. When an animal is placed in a strong magnetic field, the hydrogen nuclei line up parallel to the main magnetic field (Figure 125-2). When a radiofrequency coil transmits a radiofrequency pulse (see Figure 125-3, A), the parallel alignment of hydrogen nuclei (protons) is changed (Figure 125-3, B). When the radiofrequency pulse is turned off (Figure 125-3, C), hydrogen nuclei release the added energy and return to an orientation parallel to the main magnetic field (see Figure 125-3, C). This released energy (signal) is measured by the radiofrequency coil (now acting as an antenna) to produce the image.
Typically, three scanning sequences are used during all MRI studies: T1 weighted (T1W), T2 weighted (T2W), and short Tau inversion recovery (STIR). Tissues such as fat that release energy quickly are highlighted on T1W images (Figure 125-4), and tissues containing water that release energy slowly are highlighted on T2W and STIR sequences. A T1W image is produced when the radiofrequency coil collects image information immediately, and a T2W image is produced when image information is collected after a short delay (Figure 125-5). The signal produced by fat can be pronounced and overwhelm the remainder of the image. A STIR image is produced by a protocol that minimizes the signal produced by fat.
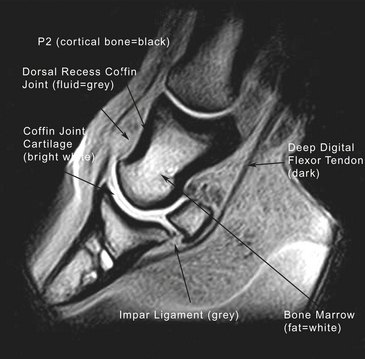
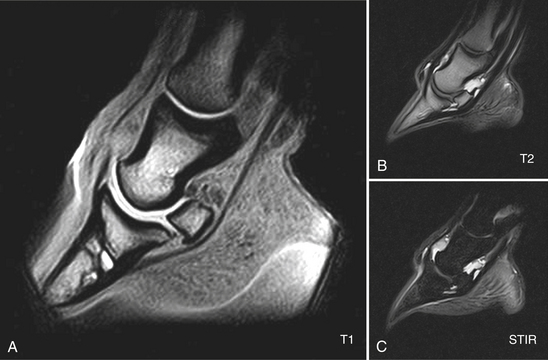
Figure 125-5 Same image as in Fig. 125-4. Notice the signal change by tissue in the same sagittal section of the digit with the T1-weighted (T1), T2-weighted (T2), and short Tau inversion recovery (STIR) images. The high signal from fat (for example, within the bone marrow) in the T1 image becomes black in the STIR image, and the gray line in the coffin joint in the T1 image becomes white in the STIR image.
(Courtesy Hallmarq Veterinary Imaging, Ltd.)
Fat in bone marrow and water in edematous tissues are the contrast extremes in MRI. In a T1W image, fat produces a white signal and water produces a black (dark) signal (see Figure 125-5). In a T2W image, fat produces a darker (less white) signal and water produces a white (lighter) signal.
It is less important to commit to memory, for example, the fact that tendon is dark in a T1W image and more important to recognize that high signal (white) in T1W, T2W, and STIR images allows aging of a lesion. The hydrogen in water (edema) from an acute lesion is best seen in STIR and then in T2W images; T2W and STIR images reveal tissue fluid from acute injuries. The presence of a signal increase (white) in T1W but not T2W and STIR suggests chronic or degenerative injury. Whereas nuclear scintigraphy indexes the metabolic state of bone structures, MR images represent the metabolic state of both hard and soft tissues in the context of the chronicity of disease.
Typically, images are collected in three planes (Figure 125-6
Stay updated, free articles. Join our Telegram channel

Full access? Get Clinical Tree


