Fig. 52.1
(a–l) Expression of mitochondria-targeted Dendra2 (mitoDen2, green) and mCherry (red) in cultured B16-BL6 cells shows that the fluorescence signals are significantly reduced with immersion fixation with ethanol (EtOH, a–c, insets) and quick-freezing followed by FS with only acetone (FS-Ace, d–f). Immersion fixation with 2 % paraformaldehyde (PFA, a–c) or quick-freezing followed by FS with acetone containing 2 % paraformaldehyde (FS-PFA, g–i) well maintains the fluorescence, although quick-freezing followed by FS with acetone containing both paraformaldehyde and glutaraldehyde (FS-GA) does not (j–l). (m–p) In cultured B16-BL6 cells, fluorescence signals of mitochondria-targeted Dendra2 (mitoDen2, green) and mCherry (red) are well preserved by quick-freezing followed by FS with acetone containing 2 % paraformaldehyde (FS-PFA). (i–t) The fluorescence signals of EGFP and mitochondria-targeted DsRed2 (mitoDsRed) are also well maintained by FS-PFA. Some tumor cells are positive for EGFP along with mitoDsRed (arrows), but mitoDsRed is not clearly observed in other cells (arrowheads), presumably due to varying degrees of transfection efficiency. Nuclei are stained with DAPI (blue). Bars, 100 μm (a, d, g, j) or 20 μm (m, q) (The figure was adapted from Lei et al. [18])
The constant maintenance of fluorescence probes prepared by quick-freezing and subsequent FS depended on the chemicals used for the fixation of tissues. Insufficient maintenance of fluorescent probes following ethanol fixation as well as FS with only acetone indicates that coagulation fixation fails to retain the probes within cells and tissues [13, 18]. On the other hand, diminished fluorescence intensities with glutaraldehyde in the FS solution suggest that glutaraldehyde fixation perturbs the molecular conformation of chromophores [19]. Cryofixation followed by FS with uranyl acetate was shown to preserve the fluorescence signals of GFP [20]. Collectively, chemical fixative s with an appropriate strength are critical to maintain maximal fluorescence emission in cryofixed tissues.
Restricted population of organelles and subcellular regions can be labeled with fluorescent protein s with specific targeting sequences [21]. Other fluorescent dye s are also available in specimens prepared with quick-freezing and FS with such fluorescent proteins, since the fluorescence spectra of the proteins appeared to be unchanged after the tissue preparation. Therefore, combination of live imaging with fluorescent protein expression and cryofixation methods including IVCT will be a useful approach to study living cells and animal tissues/organs.
52.3 IVCT for Tumor Tissues with Fluorescent Protein Expression
Morphology and immunodistribution of serum protein s are well maintained with IVCT, as has been shown in xenografted subcutaneous human lung tumor tissues [17]. Indeed, the morphology of B16-BL6 cancer cells, expressing mitoDsRed and subcutaneously injected to form tumors, was well maintained when tissues were prepared with IVCT [18]. As shown previously [17], open blood vessel s containing many flowing red blood cells were not artificially modified with IVCT. Immunoreactivity of IgM , which is a serum macromolecule mostly localized in functional blood vessels, was observed within blood vessels containing flowing red blood cells [17, 18]. The IgM-positive blood vessels were surrounded by basement membrane s with type IV collagen , and abundant immunoreactivity of type IV collagen was found in the tumor interstitium [17, 18]. With IVCT, blood vessel diameters were correlated with distances to necrotic tissue areas from the blood vessels [18].
Hypoxic tumor cells around blood vessel s could be visualized with two hypoxia markers, hypoxia-inducible factor-1α (HIF1α) and carbonic anhydrase IX (CAIX) with IVCT [5, 22–24]. Immunoreactivity of HIF1α in tumor cell nuclei and that of CAIX on the plasma membranes of tumor cells were well maintained with IVCT (Fig. 52.2) [18]. Immunoreactivity of CAIX and HIF1α observed with IVCT was highest in areas between necrotic regions and CAIX- or HIF1α-immunonegative regions around blood vessels [18], as reported previously [24].
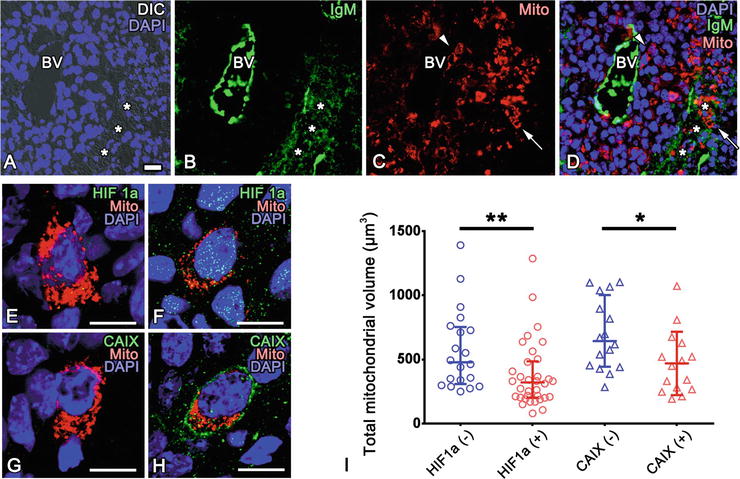
Fig. 52.2
(a–d) Tumor cells positive for mitochondria-targeted DsRed2 (Mito, red in c) are scattered in tumor tissues, and they are sometimes around blood vessel s (arrowheads in c and d) or in IgM-immunopositive (green in b and d) necrotic tissue regions (arrows in c and d). *: necrotic regions. DIC: differential interference contrast. (e–h) MitoDsRed-positive tumor cells with (f) or without (e) HIF1α immunoreactivity and with (h) or without (g) CAIX immunoreactivity are observed. (i) Total mitochondrial volume in individual tumor cells is significantly smaller in tumor cells with immunoreactivity of hypoxia markers compared with those without detectable level of hypoxia markers (**p < 0.01, *p < 0.05, U-tests). Each dot represents a single cell. Nuclei are labeled with DAPI (blue). Bars, 20 μm (a), or 10 μm (e–h) (The figure was adapted from Lei et al. [18])
The tumor microenvironment appears to modulate localization of mitochondria in the tumor cells. Fluorescence signals of mitoDsRed were well maintained in cryosections of tumor tissues after IVCT and FS, and the total sizes and distribution of mitochondrial networks could be three dimensionally observed around each DAPI-positive nuclei (Fig. 52.2) [18]. Random selection of cells negative or positive for either HIF1α or CAIX showed that hypoxic cell s positive for HIF1α or CAIX have significantly less volume of DsRed-labeled mitochondria (Fig. 52.2). It was also observed that fluorescent mitochondria were aligned in processes extending from cell bodies with DAPI-positive nuclei (Fig. 52.3). These processes were often extended along the basement membrane s , which are immunopositive for type IV collagen (Fig. 52.3).
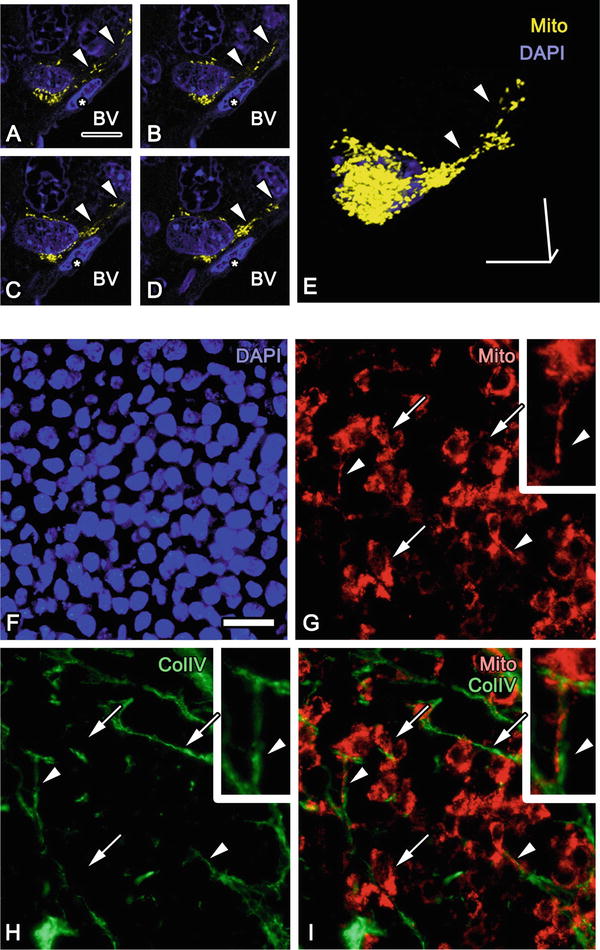
Fig. 52.3
(a–e) Serial confocal light microscopic images (a–d) and three-dimensional reconstruction (e) of mitochondria-targeted DsRed2 (Mito, yellow) of a tumor cell near a blood vessel (BV) demonstrate that relatively small mitochondria are aligned in a cytoplasmic process extending along BV (arrowheads). Asterisks: an endothelial cell . (f–i) Immunostaining for type IV collagen (Col IV) shows that Col IV-immunopositive extracellular matrices are adjacent to the Mito of many tumor cells (arrows), and these tumor cells have Mito-containing processes distributed in the tumor tissues (arrowheads). Nuclei are labeled with DAPI (blue). Bars, 10 μm (a, e) or 20 μm (f) (The figure was adapted from Lei et al. [18])
With IVCT, mitoDsRed-labeled mitochondria in tumor cells appeared as small spherical or cylindrical profiles in the tumor cell cytoplasm [18]. The Warburg effect decreases mitochondria-dependent energy production and is considered to involve the activation of hypoxia -related signaling [5, 25]. The decrease of mitochondria-dependent energy production may include reduced biogenesis and increased degradation of mitochondria [26, 27]. The significantly decreased volume of tumor mitochondria when the hypoxia markers are highly expressed supports such a hypothesis. Thus, to modulate the tumor cell metabolism and behaviors under different microenvironments, biogenesis and degradation of mitochondria may be controlled by hypoxia.
Stay updated, free articles. Join our Telegram channel

Full access? Get Clinical Tree


