Measurements of ADLs are sometimes difficult. The timed get up and go (TUG) test is a measure of mobility that has been studied and used extensively in human rehabilitation.1 The person is asked to stand up from a standard chair and walk a distance of 3 meters, turn around, and walk back to the chair and sit down again. This test involves a number of tasks, such as standing from a seating position, walking, turning, stopping, and sitting down, which are all important tasks needed for a person to be independently mobile. Normal time required to finish the test is between 7 and 10 seconds. Similar tests could be developed for dogs, but because the TUG depends on a person’s mental ability and understanding of what is expected, it must be modified for dogs. (Dogs competing in some sporting events such as fly-ball may be an exception because of their training and understanding of what is expected.) Nevertheless a dog can be timed during a test of rising from a sitting position, walking on leash for a distance, turning, and then sitting. For the average house pet other objective activities that could be measured include how far a dog can walk or trot on a leash before needing to sit or lay down. These can all be compared over time to assess function and mobility. An inexpensive method of acquiring more quantitative information regarding weight bearing at a stance is to have a dog stand with each limb on common household scales. It is important to be certain that the dog is standing squarely in a standard position, with each limb on a scale. Dogs should also undergo a period of acclimation to the scales so that data collection is valid. Scales should be calibrated periodically to standard weights to be certain that accurate weights are recorded. One study found that bathroom scales were a reliable, simple, and cost-effective objective method for measuring static weight bearing in dogs with osteoarthritis in the hindlimbs.2 Computerized devices are available that simultaneously measure static weight bearing of all four limbs (Figure 13-1). As with any test, proper data collection is crucial to obtaining reliable information. One study of various conditions during data collection concluded that to achieve consistent results, one standard method of conditions during data collection should be used.3 Factors to consider include the position of the handler, proximity to walls, and local environment. We recommend having the dog in a quiet environment with minimal noise or distractions, with the dog facing either the center of the room or directly toward, but some distance away from, a wall. Any other walls should be at least 3 to 6 feet from the dog. It is critical that the dog stand squarely and symmetrically, with each foot in the middle of pressure pad. In most cases, lifting the dog’s back or front limbs off the ground temporarily and then placing them back on the ground will result in square limb placement. The head and neck should be relaxed in a neutral position and facing straight ahead. We have found that dogs respond well to having the handler facing forward and straddling the dog over its back. Another option is for the handler to squat or kneel directly in front of the dog. The handler’s hands can then help to guide the dog’s head in a straight position, being careful to avoid touching the dog; the hands merely act as blinders to help keep the head in a straight position. Following these guidelines results in very consistent data collection and has very good correlation with ground reaction forces measured with a force plate.4,5 Lameness scores are a vital clinical outcome assessment tool. The walk and trot are the gaits most commonly evaluated because the speed of the limbs during movement is easier to assess without specialized equipment, and these gaits are symmetric, making identification of a lame limb easier. The reader is referred to the chapter on orthopedic and neurologic evaluation for information regarding identification of lameness. It is important to separate the walk from the trot when scoring lameness. Dogs are generally less lame at a walk because less force is placed on the limb at this less strenuous gait. Trotting may accentuate a lameness that is mild to moderate at a walk because of the greater forces placed on the limb with increased velocity. Having separate lameness scores for the walk and trot allows finer discrimination of gait analysis and may be more sensitive for detecting subtle improvements during rehabilitation (Box 13-1). Although lameness scales are simple, commonly used, and inexpensive, they may not be accurate in evaluating subtle or mild lameness. One study compared a numerical scale and visual analog scale (VAS) with ground reaction forces and concluded that subjective scoring scales do not replace force plate gait analysis in dogs with surgically induced lameness.6 Agreement of experienced evaluators with ground reaction forces was low unless lameness was severe. In addition each observer had his or her own individually unique scale. Therefore observers must stay the same during the evaluation of a patient for accurate analyses. Another study of induced hind limb lameness of dogs found that subjective evaluation of lameness varied greatly between different observers, and there was poor agreement with objective ground reaction force measurements.7 Similar results regarding estimating the severity of lameness using a VAS have been found in dogs with fragmented coronoid processes.8 However, owners may not be able to assign a valid VAS score.9 Therefore, this form of evaluation is better performed by people experienced in evaluating lameness and pain. An alternative approach may be to use a questionnaire to assess pain and lameness in dogs. One study evaluated a variety of questions using a VAS and found significant correlation with peak vertical force and vertical impulse.10 Responses to questions recorded on a standard 10-cm VAS that had significant correlation with ground reaction forces included: • Overall owner assessment for preceding month • Mood of dog during preceding month • Attitude of dog during preceding month • Frequency of postures of a happy dog • Change in amount of daily activity • Willingness to play voluntarily • Stiffness when arising for the day • Stiffness at end of the day (after activities) • Indicates lameness when walking The Helsinki Chronic Pain Index also found mood, play, locomotion while walking and trotting, getting up, difficulty moving after rest, and difficulty moving after major activity to be valuable in helping to identify dysfunction with osteoarthritis.11 Vocalization, galloping, jumping, and laying down are other activities that help identify dogs with osteoarthritis. A Canine Brief Pain Index (CBPI) has also been developed to evaluate chronic pain in dogs with osteoarthritis, and consists of 11 questions related to pain, function, and overall impression of quality of life; a 10-point scale is used to indicate the severity of the condition for each of the 11 questions.12 While the CBPI is able to detect improvement in pain scores of dogs with osteoarthritis after treatment with an NSAID,13 there is not significant correlation of CBPI scores with ground reaction forces as measured with a force platform, suggesting that owners evaluate things other than lameness in assessing improvement with treatment.14 Kinetic evaluation of gait involves the measurement of ground reaction forces with a force plate or platform (Figure 13-2). It is an objective, repeatable measure of weight bearing on limbs when proper technique is used for data collection. Lameness can be compared over a period of time without relying on memory of previous assessments because data may be stored on a computer. Although measurement of ground reaction forces is a reliable and well-accepted method of determining the degree of weight bearing on the limbs, it is an artificial situation, and some dogs may display different clinical signs in a home environment. Force platform systems are available at many veterinary colleges and some private practices. It is important that appropriate software be used for quadruped animals. The most useful forces measured are the peak vertical force (ZPeak) and vertical impulse (ZImpulse) (Figure 13-3). Other forces that may be useful are the peak braking (YA Peak) and propulsion (YB Peak) forces and braking (YA Impulse) and propulsion (YB Impulse) impulses (Figure 13-4). Medial-lateral forces (XPeak) and impulse (XImpulse) are likely too small and variable to be clinically useful. Forces may be measured during stance, walking, or trotting. Attention to detail is critical for kinematic gait analysis. Most systems use a number of reflective devices that are attached to the dogs at very specific anatomic points to allow repeatable data collection at different times (Figure 13-5). Motion of the markers in relation to the joints is determined with a series of cameras interfaced with a computer. Software for quadruped animals allows reconstruction of a walking “stick figure” on the computer screen. The software is then used to calculate a number of measurements, including flexion and extension angles of joints during gait, angular velocity and acceleration of joints, and stride length and frequency. Noninvasive, computer-assisted, three-dimensional kinematic gait analysis has been used to study lameness associated with cranial cruciate ligament rupture in dogs.15 Dynamic flexion and extension angles and angular velocities were calculated for the hip, stifle, and hock joints. Distance and temporal variables were also determined. Mean flexion and extension curves were developed for all joints, and the changes in movement that occurred over time after cruciate rupture were compared. Each joint had a characteristic pattern of flexion and extension movement that changed with cruciate rupture. The stifle joint angle was more flexed throughout stance and early swing phase of stride and failed to extend in late stance. Angular velocity of the stifle joint was damped throughout stance phase, with extension velocity almost negligible. The hip and hock joint angles, in contrast with the stifle joint angle, were extended more during stance phase. Stride length and frequency also varied significantly after cruciate rupture. A change in the pattern of joint movement appeared to occur in which the hip and hock joints compensated for the dysfunction of the stifle joint. Knowledge of kinematic parameters may allow more effective rehabilitation of patients following surgery or those with chronic conditions. In particular, changes that are noted during the course of treatment may allow for stepping up the level of activity, or more important, may signal changes that occur in other joints as a result of fatigue or overuse. Knowledge of these data may help prevent injuries to other joints or limbs. Recently, studies have been conducted to evaluate joint motion during therapeutic exercises.16–21 The kinematics of various therapeutic exercises are discussed in the biomechanics of rehabilitation chapter. Kinetic and kinematic gait analysis techniques have been combined using an inverse dynamics technique to estimate net joint moments and power. This technique has been used to evaluate tibial plateau leveling osteotomy and a lateral fabella-tibial technique to stabilize stifle joints in a cranial cruciate ligament transection model,22 Labrador retrievers with and without cranial cruciate ligament disease,23 and forelimb joints.24 This form of gait evaluation is time-consuming and requires specialized software, but it can provide valuable information. Most outcome assessment measurements are performed in a clinic in which equipment and personnel are located. However, in many cases, the animal temporarily becomes more active in the clinical environment as a result of traveling, exposure to other animals, and being in a strange environment. In these situations the dog often appears to be better than has been reported in the home environment. A pedometer may give some indication of a dog’s activity level in its home environment. Most pedometers have a pendulum that swings back and forth with the normal gait cycle and indicates the number of steps taken. In our experience pedometers may be up to 85% to 90% accurate with regard to counting the number of steps taken by a dog. One study confirmed that pedometers are reasonably accurate, with the exceptions that at a walk, pedometers overestimated the number of steps by approximately 17% in large and medium dogs and underestimated actual number of steps by approximately 7% in small dogs.25 Although these researchers found that no significant differences between pedometer-recorded and actual number of steps were detected when dogs trotted or ran, our experience has been that the step count is artificially increased when dogs run or climb stairs. Proper placement of the pedometer is crucial. We have found that placing the pedometer just proximal to the elbow most accurately indicates the number of steps taken (Figure 13-6). In the study by Chan et al., however, pedometers were worn around the dog’s neck by means of an adjustable lightweight chain.25 However, we have found that when dogs shake their head or scratch their neck, the step count on the pedometer is artificially increased. Because pedometers may not be not accurate in all dogs, it is recommended that the dog be walked 100 steps; the number of steps indicated by the pedometer is compared to see if the pedometer is reasonably accurate to record a dog’s activity level. An additional test to determine accuracy is to place the pedometer and then allow the dog to have free activity while 100 steps are counted. Because the pedometer may double-count when the dog is trotting, running, or going up and down stairs, it is used only as a semiquantitative indicator of home activity. Environmental conditions are another major factor in the activity of dogs. Dogs that spend some time outdoors may not be as active if it is raining or cold, or the weather is otherwise inclement. Therefore comparative assessments should be made on days when the weather is as similar as possible. Recently, accelerometers have been used to estimate activity in dogs. Because of the differences in technology between pedometers and accelerometers, placement at various sites on dogs can give acceptable results. One study found that placement on a collar in the ventral neck region gives acceptable results for home activity monitoring.26 In addition, accelerometers were able to distinguish the intensity of activity in dogs.27 Another group found that the use of accelerometers was able to detect an increase of 20% in home activity after treatment for osteoarthritis, while placebo-treated animals had no increase in activity.28 Activity and location may also be monitored relatively inexpensively using GPS technology for pets.29 Joint motion may be evaluated using both objective and subjective assessments. The primary motion of a joint is the movement of bones as a whole, such as occurs with stifle flexion, and is termed physiologic or osteokinematic motion. The quantity of joint flexion and extension motion is measured using a goniometer (Figure 13-7). Unlike human range-of-motion measurements, the actual geometric angles are measured in dogs because the many different body types and conformation in individual dogs make estimation of the neutral or “0-degree” position difficult. Measuring the actual angle eliminates the need to estimate the “normal” standing angle; therefore there are no negative angles. The maximum angles of extension and flexion are those angles of greatest joint excursion. Normal angles of maximum flexion and extension have been reported for the Labrador retriever and cat (see Appendix 1).30,31 Excellent inter-tester and intra-tester reliability was reported in those studies. In addition, measurements made in dogs and cats had very good correlation with measurements made from radiographs.30,31 Stifle joint laxity is clinically assessed by palpating for cranial drawer motion. There should be no drawer motion in normal dogs, with the exception of puppies, which have some drawer motion that comes to an abrupt stop at the end of drawer. Methods to quantify drawer motion, which are not commonly used in dogs, include measurement of direct cranial drawer, quantitative cranial tibial thrust, and use of instrumented devices.32 Direct cranial drawer is determined by simply marking the position of the tibial tuberosity with the stifle in reduction on a piece of graph paper, and then remarking the position of the tibial tuberosity with full cranial drawer. Caution must be used to prevent motion of the femur and to keep the marking device perpendicular to the graph paper. Quantitative cranial tibial thrust is measured in a similar fashion, except that the stifle is kept in a fixed position (usually standing angle) while the hock is flexed. This results in cranial displacement of the tibial tuberosity if the cranial cruciate ligament is ruptured. Marks are made on graph paper with the tibia in a reduced position and with the tibia in full cranial tibial thrust. Care is taken to keep the caudal aspect of the femur in contact with a solid surface so the only motion that occurs is the cranial displacement of the tibia. Instrumented devices for knee-drawer tests have been used in humans to measure shifts of the tibial tuberosity relative to the patella.33–35 The total anterior and posterior displacement produced by anterior and posterior loads of 20 lb is measured from a reference position. Studies have evaluated the effects of variables on the accuracy and reproducibility of anterior-posterior drawer measurements. Reproducibility is principally affected by deviations in subject positioning. In addition to drawer motion, inadvertent knee flexion and tibial rotation may occur and result in incorrect measurements, despite attempts to prevent these. The effects of different observers, time sequences, different days, and muscle relaxation have been studied and contribute to error rates of 5% to 15%. Stress radiography, a relatively sensitive method of measuring drawer motion, has been used to compare instrumented systems in humans with tears of the anterior cruciate ligament (ACL). In one study stress radiography was superior to instrumented arthrometer testing for determining cruciate ligament status.36 Similar studies have not been performed in dogs, but instrumented knee-drawer devices are difficult to use in dogs and require practice to obtain reproducible results. Pediatric devices may be easier to use because the smaller size may allow a better fit of the instrument to the dog’s limb. Measurement of limb circumference is an indirect method of assessing changes in muscle mass and is inexpensive, quick, and easily performed on clinical patients. Acceptable results depend on using standard, repeatable methods of measuring limb circumference. A measuring tape with a spring tension device is useful in measuring limb circumference to improve consistent tension on the tape when making measurements (Figure 13-8). One study evaluated the effect of limb position, clipping hair, sedation, and different evaluators on thigh circumference measurements at two different locations before and after stifle stabilization surgery.37 Thigh length was determined by measuring from the tip of the greater trochanter to the distal aspect of the lateral fabella. Circumference was determined at points equal to 50% and 70% of thigh length, measuring from the greater trochanter distally. Measurements were technically easier when made at the 70% location because the skin of the flank did not impede measurements (Figure 13-9). Clipping had little effect on thigh circumference measurements, but dogs with short hair coats were used (Figure 13-10). Measurements may be affected to a greater extent in dogs with long hair. Limb position is important. Full flexion of the stifle results in greater thigh circumference measurements as compared with measurements made with the limb placed at a functional standing angle or with the stifle fully extended (Figure 13-11). Extension of the joint causes the muscle bellies to elongate, whereas flexion results in shortening and bunching of muscle bellies, creating greater thigh circumference. Measurements made in awake dogs with the stifle extended are not significantly different from those made following heavy sedation, as long as the dogs are not overly tense, probably because the muscles are in an elongated position when the stifle is extended (Figure 13-12). Thigh circumference measurements are sensitive enough to detect muscle atrophy 2 weeks after stifle surgery (Figure 13-13). Similar measurements may be obtained by independent evaluators as long as standard technique is used and the evaluators practice before obtaining actual measurements. The association of limb circumference with actual muscle mass is important if it is to be useful in the evaluation of rehabilitation patients. Human male cadavers were subjected to comprehensive anthropometry and weighing of all skeletal muscle.38 Limb circumference had good correlation with total skeletal muscle mass for the forearm (r = .96), mid-thigh (r = .94), calf (r = .84), and midarm (r = .82). Thigh circumference also has significant correlation with actual muscle mass in dogs (Figure 13-14). Even greater correlation may be obtained when thigh length is also considered and the volume of a cylinder is calculated. Although this method is simplistic because the thigh is not a true cylinder, the volume of a cylinder is easy to calculate and this estimate of muscle mass may be more clinically useful. Similar principles likely exist for circumference measurements of other limbs. Currently we prefer performing thigh circumference measurements with the hair short or clipped, the limb held in an extended position, at 70% of the length of the thigh, and with the animal relaxed, but not necessarily sedated. In the forelimb the length is measured from the proximal aspect of the olecranon to the distal aspect of the lateral styloid process; the limb circumference is measured at a point that is 20% of the limb length as measured from the proximal aspect of the lateral epicondyle of the humerus.
Assessing and Measuring Outcomes
Activities of Daily Living
Gait Analysis
Weight Bearing at a Stance
Figure 13-1 Measure of static weight-bearing forces using a computerized stance analyzer (Petsafe, Knoxville, TN).
Lameness Scores
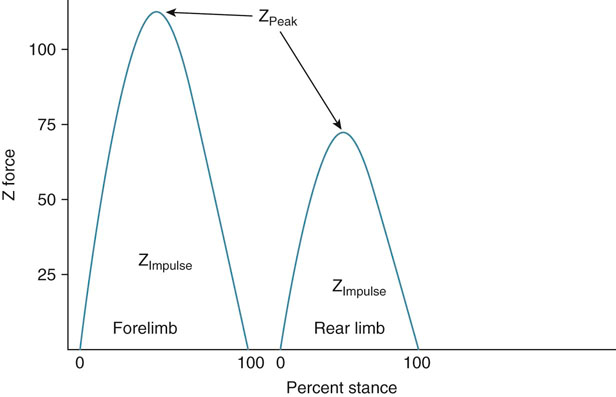
Kinetic (Force Plate) Analysis of Gait
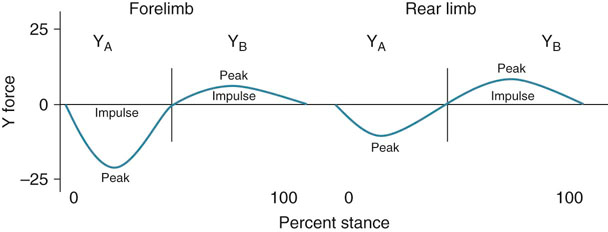
Figure 13-4 Graphic depiction of peak braking (YA Peak) and propulsion (YB Peak) forces and braking (YA Impulse) and propulsion (YB Impulse) impulses.
Kinematic (Motion) Analysis of Gait
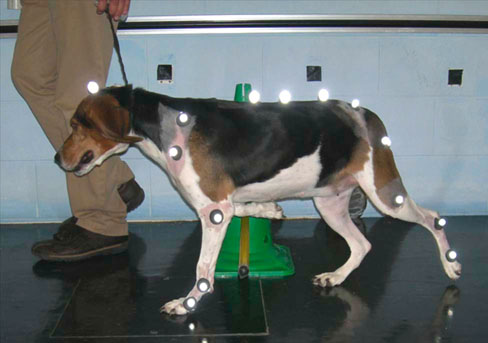
Figure 13-5 The dog is instrumented for kinematic assessment of joint motion and stride characteristics.
Pedometers
Figure 13-6 Proper placement of a pedometer is crucial. Placing the pedometer just proximal to the elbow is one method that has been used to count the number of steps taken.
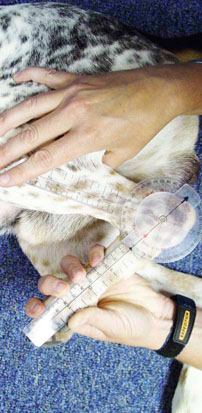
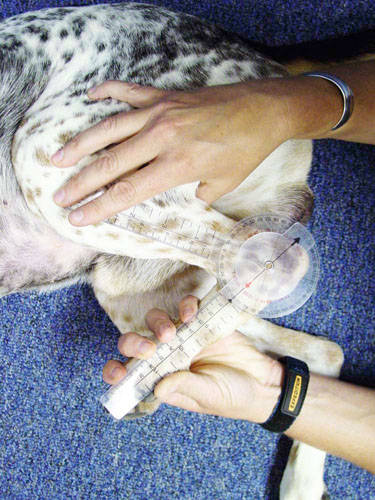
Joint Function
Joint Laxity
Muscle Mass and Strength
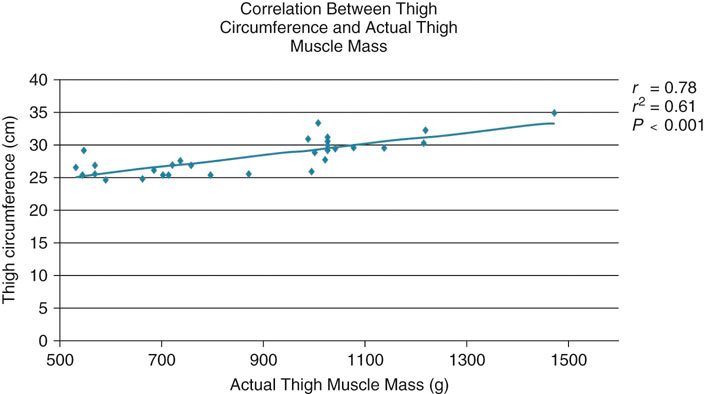
Muscle Mass
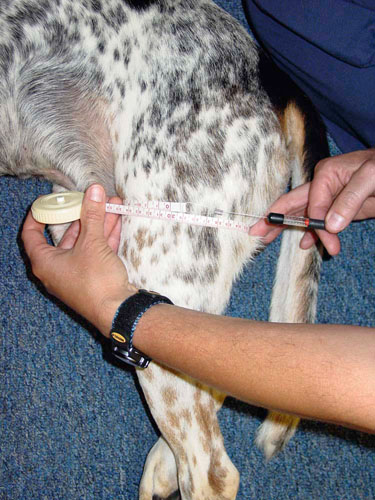
Figure 13-8 A measuring tape with a spring tension device is used to measure limb circumference. Use of this instrument allows the consistent placement of tension on the tape when making measurements.
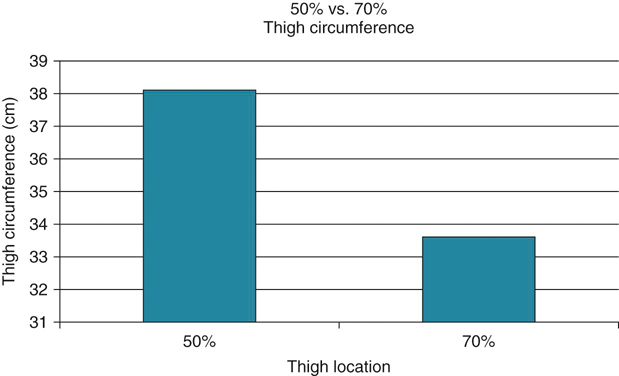
Figure 13-9 Thigh circumference measurements at the 50% and 70% thigh length. Although the 50% leg has greater thigh circumference because of greater muscle mass in that location, the measurements are technically more difficult at that location in some dogs because of the presence of the skin of the flank.
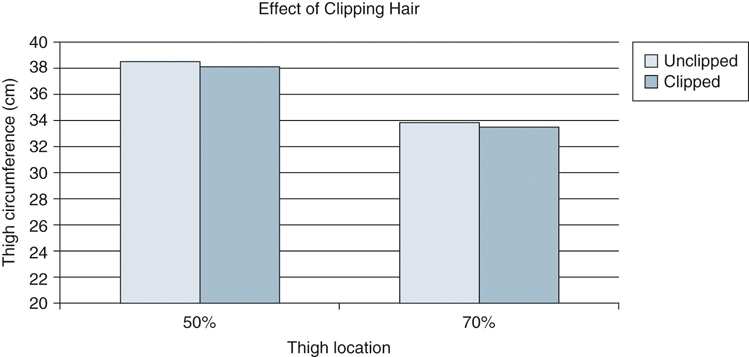
Figure 13-10 Clipping the hair has little effect on thigh circumference measurements in dogs with short hair coats. The effect of clipping would likely be greater in dogs with long hair.
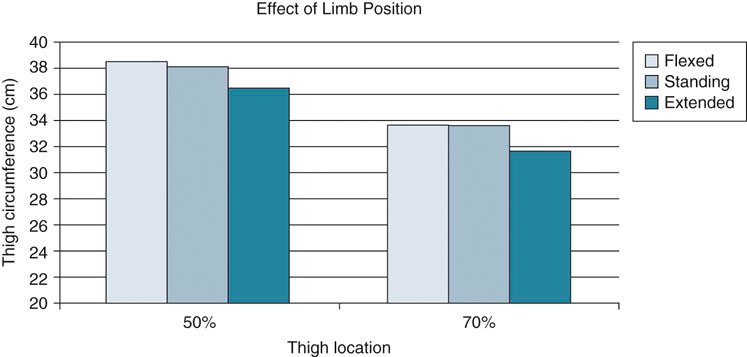
Figure 13-11 Thigh circumference is less with extension of the stifle because the muscles are elongated. Flexion of the limb results in greater thigh circumference, but the measurements are more difficult because of shortening of the hamstring muscles and difficulty in applying the tape measure.
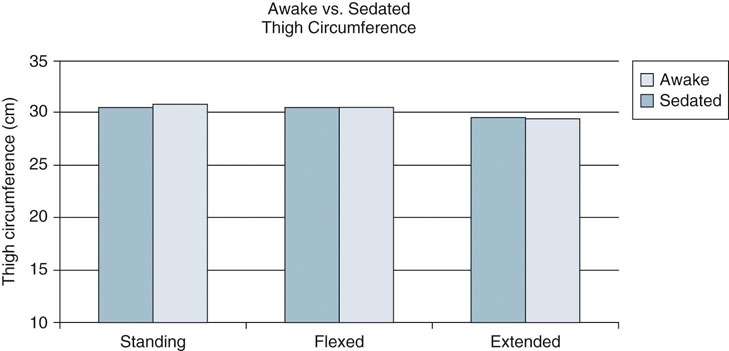
Figure 13-12 Measurements made in awake dogs with the stifle extended are not significantly different from those made following heavy sedation if the patient is not very tense, probably because the muscles are in an elongated position when the stifle is extended.
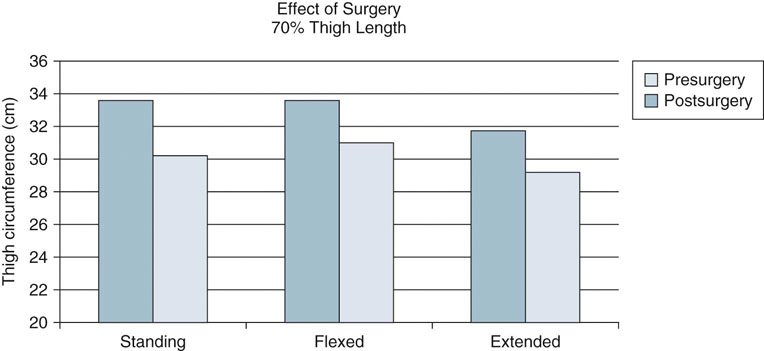
Figure 13-13 Thigh circumference measurements are sensitive enough to detect muscle atrophy 2 weeks after stifle surgery, indicating that this technique may be useful as a simple, cost-effective method of assessing limb mass.
< div class='tao-gold-member'>
![]()
Stay updated, free articles. Join our Telegram channel

Full access? Get Clinical Tree


Assessing and Measuring Outcomes
Only gold members can continue reading. Log In or Register to continue
