CHAPTER 77 Understanding Population Dynamics Models
Implications for Veterinarians
BACKGROUND OF POPULATION DYNAMICS MODELS
Population dynamics models have long been used in ecology and agriculture to examine and predict animal population growth or decline.1,2 This could be in the context of maximizing animal production yields or examining possible extinction or management for different wildlife species. More recently these models have been generalized to dog and cat populations in order to evaluate the percentage of animals that must be sterilized or removed to halt population growth. For example, models can be used to explore the widely cited assertion that 70 per cent of a population must be sterilized to stabilize cat or dog population growth (owned or free-roaming). This 70 per cent goal has been popularized extensively by Merritt Clifton and later by Marvin Mackie.3–5 Both Clifton and Mackie have pointed out that spay/neuter programs of owned animals in North America seemed to stabilize the population size when the percentage of animals sterilized neared 70 per cent.6–8 In addition, a few overseas programs seem to have been successful at about 65 per cent sterilization.9,10
The impact of free-roaming populations of dogs and cats on the number of animals in the owned population, as well as in shelters, also has been recognized.11 In recent years the need to target a specific population of dogs or cats so that a high enough percentage can be sterilized quickly has been stated explicitly. However, few studies have been performed specifically on dogs and cats. In addition, the percentage of the population that must be sterilized to halt population growth appears to depend on animal density, social structures, diseases, reproduction, and survival. Therefore a blanket statement for the percentage of the population that must be sterilized probably is unreasonable. Studies in the early 1980s on owned cat populations illustrated the complex interrelationship of different population subgroups (e.g., owned, sheltered, free-roaming).11 More recent work has used the diagrams generated from these studies to help visualize the subpopulations and demonstrate where additional data are needed.12–14
Changes in populations are based on births, deaths, immigration, and emigration.1 Programs that focus on sterilization of cats try to decrease birth rates. Programs that focus on euthanasia increase death rates. This distinction will be important when comparing different types of population control methods in cats.
DEFINITIONS
Models, in their most basic forms, are simplified representations of a complex ecological system.1 The population of animals is dynamic (or constantly changing): animals find and defend their territory, choose mates, reproduce and raise their young, find food and shelter, and avoid predators, all during certain time periods (e.g., seasonally) and in certain areas. For cats, “ecology” may involve local ordinances and policies, cultural beliefs, local cat breeders, or hunting.11 Our conceptual models of cat populations, based on verbal, written, or diagrammatic descriptions, become mathematical models when represented with mathematical equations.2
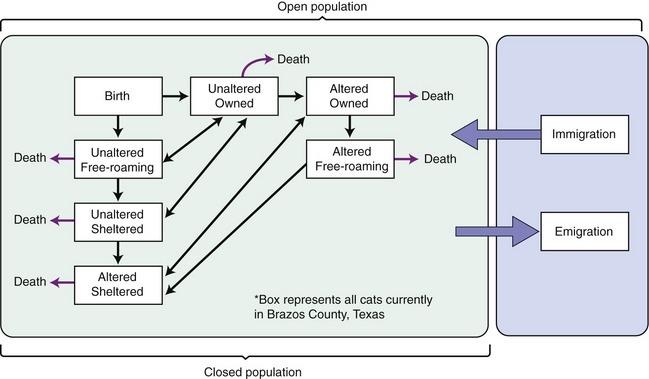
Changes in populations are based on four “vital statistics.” Birth (fertility, fecundity) and death (mortality, survival) depend on the size and success of the current population. Immigration and emigration depend on the movement of animals in or out of the population (because of the animals’ own movements or the intervention of human beings). For example, the owned cat population of Brazos County, Texas, is increased by the birth of kittens from owned cats, cats or kittens adopted as strays, and owned cats moving in from other counties or states. In this example, owned cats brought in from other counties or states are immigrants, and cats whose owners move out of Brazos County with their cats are emigrants (Figure 77-1). Births and immigration increase the population, and deaths and emigration decrease the population. If there are more births or immigrants than deaths and emigrants, then the population will increase, and vice versa. In a closed population, immigration and emigration are zero and only birth and death rates influence population size. In Figure 77-1 the closed population model would not allow for cats to enter or leave the county through shelter transfers of cats, owner movements, cats roaming into or out of neighboring counties, and so forth. For most cat populations, except in rare cases on islands or extremely isolated geographical locations, the populations in which we are interested are not closed, but instead are considered open populations. As one can imagine, the constant influx and outflow of animals in an open population complicates the modeling process.
In general in population dynamics modeling, the focus is on female reproduction. This is because there are usually enough males in the population of interest to inseminate all of the females. If this is not true, then male reproductive rates also must be calculated. It also is assumed that the other vital rates for males are the same as for females.15 Reproductive rate (R0) is an overall measure of female reproduction: the average number of female kittens produced by each queen over her lifetime. There are many external factors that influence reproduction: (1) limited food and resources may drain the queen; (2) there may be less time for finding food during kitten rearing; and (3) there may be poorer growth of the adults or kittens if resources are limited. If R0 is greater than 1, then there is a net increase in kittens in each generation. Conversely, if R0 is lower than 1, the population is tending toward extinction. If R0 is 1, the population is in equilibrium and the kittens produced balance the deaths in each generation.
APPROACHES TO POPULATION DYNAMICS MODELING
Box 77-1 outlines the questions that will help a reader become oriented to a publication on population dynamics. The population of animals evaluated should be defined clearly so it is readily apparent which subgroups are included. The objective should be stated clearly and may include (1) simple descriptions of a biological process or situation; (2) synthesis of current knowledge and understanding to see where the gaps are; (3) guidance for future experimental work; (4) evaluation of different interventions and their effects; (5) risk analysis or decision support; and (6) predictions of future changes in the population.2 In veterinary medicine we are interested most often in (2) and (4). For example, the effect of an intervention on rabies and population control in dogs can be illustrated by a project that vaccinated and sterilized neighborhood dogs in India.9 In 8 years 65 per cent of females were sterilized and vaccinated, and the total population of dogs decreased by 28 per cent. Local human cases of rabies subsequently dropped to zero. Most commonly the authors measure numbers of animals or growth rate; sometimes both estimates are included.
Box 77-1 Information to Orient the Reader to a Population Dynamics Project
A somewhat more complicated model uses a formula for logistic growth, which accounts for the influence of the density of the animals living in the area on births and deaths.2 Typically, increasing population densities will increase competition for food, mates, and territory, resulting in slower or level population growth. The carrying capacity (K) is the maximum number of animals that can be supported in that population at that time and location. The calculation of carrying capacity is sometimes an objective of a model. Basic logistic models otherwise have similar assumptions to the exponential models, except for taking density into account. Variations on the logistic growth models are possible and can account for the influence that time lags may have on reproduction or death as well as different types of density dependence (linear or variable). Density dependence is the regulation of the size of the population by mechanisms that themselves are controlled by the size of the population (e.g., the availability of resources like shelter). The effectiveness of these mechanisms increases as population size increases. For example, a variation on the logistic model is the Ricker or exponential logistic model. This model focuses on growth rate and carrying capacity. However, unlike the basic logistic model, increasing population density results in a linear, density-dependent decrease in the growth rate and prevents the population size from ever being calculated as a negative number.
A major assumption thus far is that the population is closed. This may be the case on uninhabited islands and there are studies of cat population dynamics that assume an island population.16 However, few real-life cat populations are closed and this can be a major limitation for models. For example, abandonment of cats is a common way of increasing cat immigration to the unowned, free-roaming cat population, whereas adoption of strays would be a form of emigration. It is possible to include various rates of immigration and emigration in the models. However, estimating the immigration and emigration rates is very difficult and may introduce more error than assuming a closed population. Movement of animals in and out of populations is often density-dependent. In addition, it is influenced by the biology of the species, local resources, and, of course, people. This issue should be addressed by the authors of the publication and their choices explained and defended.
There are many other types of population dynamics models. However, those described above have been used most commonly for companion animals.15,17,18
The models discussed to this point are all deterministic: we use our one best estimate for the included vital statistics and the model gives us a single answer in terms of population change. However, there is variability in everything. Stochastic models incorporate variability into the data that are used in the model.2 For example, we can include data that incorporate a range of litter size in queens. Stochastic models also allow us to include the role of chance and environment in influencing populations. There are four types of stochasticity to consider: (1) environmental; (2) demographic; (3) genetic; and (4) catastrophic. Environmental stochasticity is the variability in good and bad years for population growth because of factors like climate and food sources. Human intervention and garbage sources also could be considered in this type. Demographic stochasticity is the variation in births and deaths from the normal variability in seasonal and individual patterns. A run of extra litters could influence birth rates for a couple of years and might not be balanced out by extra deaths. Variation in the sex ratios of litters also could have an effect because models often are based solely on female members of the population. Genetic stochasticity is the amount of genetic variation in the population and how that affects the vital statistics. For example, inbreeding may decrease genetic diversity and change survival rates. On the other hand, some genetic homogeneity likely will make estimates of vital statistics more stable in the short term. Catastrophic stochasticity is variability caused by unpredictable and often substantial influences on populations. Catastrophes may be considered a subtype of environmental influences because natural disasters like floods, droughts, and hurricanes all would fall into this category. However, localized catastrophes such as dog attacks on cat populations, poisonings, or changes to the habitat, like construction, also could influence cat populations strongly.
Metapopulation is a term used in wildlife biology and conservation to refer to groups of interlinked populations where there is immigration and/or emigration between the populations.1 Usually the context for these analyses is to determine extinction or specific types of population interactions like predation. Other types of models are used to study competition between species for food, shelter, and so forth and are particularly important with limited resources. Lotka-Volterra models allow for the kinds of competition between populations that occur in these situations.1,2 Although no work has been published on cats using this approach, predator-prey models seeking to understand or control predation have been published.19,20
The Allee effect occurs when the per capita birth rate declines at low population densities.2 This effect can be important in small or decreasing populations. This may be caused by the inability to hunt as effectively compared with a larger group, difficulties in finding mates, or increased vulnerability to predation. In contrast, some small populations actually may experience improved survival. One project evaluating feline immunodeficiency virus spread in cats included the Allee effect in the modeling.21 The Allee effect (or its absence) might become worth studying in areas where the numbers of cats have been reduced successfully.
Stay updated, free articles. Join our Telegram channel

Full access? Get Clinical Tree


