Mean
S.D.
Minimum
Maximum
July journey
Temperature inside the vehicle (°C)
26.32
3.79
21.5
35.5
Skin temperature (°C)
35.97
1.12
33.3
38.7
September journey
Temperature inside the vehicle (°C)
22.27
3.31
16.0
27.7
Skin temperature (°C)
38.13
0.87
36.0
39.9
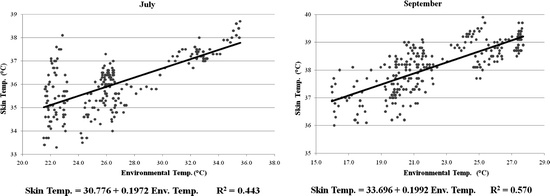
Figure 32.1 shows the results of regression analysis. In both journeys, the relationship between skin temperatures and the temperatures inside the vehicle was linear (P < 0.001). The R 2 values were 0.44 and 0.57 in July and September, respectively. Data from both the months were tested up to a 5° polynomial regression, which did not increase the R 2 value obtained by the simple regression. It is interesting that the angular coefficients of the two equations were very similar (+0.1972 and +0.1992). Thus, in the range of temperatures recorded during the two transports, an increase of 1°C inside the vehicle resulted in an increase of the maximum skin temperature of 0.2°C. Figure 32.2 illustrates the trends of the maximum skin and internal vehicle temperatures during the two journeys. There was a comparable trend between skin and vehicle temperatures when the vehicle temperatures exceeded 25°C and 20°C during the journeys of July and September, respectively.


