Chapter 16. Nutrient Content of Pet Foods
METHODS FOR DETERMINING NUTRIENT CONTENT
Laboratory Analysis
When pet food manufacturers formulate and produce pet foods, there are two ways they can determine the level of nutrients present in the food. The first and most accurate way is to conduct a laboratory analysis of the finished product. Proximate analysis is a commonly used panel of tests that provides information about a select group of nutrients. The laboratory procedures involved in proximate analysis provide the percentages of moisture, crude protein, crude fat, ash (minerals), and fiber that are contained in the food. Nitrogen-free extract (NFE), which represents a rough estimate of the soluble carbohydrate fraction of the food, can be calculated by subtraction. The guaranteed analysis panel of the pet food label is generated from the proximate analysis results. Association of American Feed Control Officials (AAFCO) regulations require that this panel reports only maximum or minimum levels of a select group of nutrients. 1
Pet food companies that are producing high-quality products and are interested in the education of pet owners will provide consumers with additional information about the exact nutrient content of their foods. Because regulations do not currently allow the inclusion of these details on the pet food package itself, they are usually supplied to consumers in the form of informational brochures and through company websites. Such additional information may include the essential vitamin and mineral content and the energy density of the food.
Tip: Additional information about the nutrient content and energy density of high-quality pet foods can be found in pamphlets obtained from the pet supply store or veterinarian where the food was purchased, or it can be obtained directly from the manufacturer via websites or telephone. Reputable manufacturers will readily supply information, and many have toll-free telephone numbers listed on the package.
Calculation
The second method that manufacturers may use to determine nutrient content is calculation of the average nutrient content of the food’s ingredients using values reported in standard tables. The amount of essential nutrients contributed by each ingredient in the food are then summed. Standard tables contain average levels of essential nutrients in common feed ingredients. Although this method of nutrient determination is certainly less costly and time-consuming than laboratory analysis, there are several significant problems with using calculation alone to determine the nutrient content of pet foods.
First, there is a lack of complete and accurate data for the nutrient content of many ingredients included in commercial pet foods. As a result, manufacturers must rely upon tables that contain approximations of the types of ingredients they are using. These tables may contain information that is outdated or misleading. For example, as grain yields have increased in the United States, the average percentage of protein in corn and soybeans has decreased. 2 Standard tables do not always reflect these changes. A study conducted by the Office of the Texas State Chemist measured the protein content of corn, oats, and grain sorghum samples taken from different locations within the state. 3 The average crude protein content in 200 samples of yellow corn was 7.87%, with a range of 5.97% to 10.25%. Protein values were less than 8% in 62% of the samples, and 31.5% of the samples had protein contents below 7.5%. The National Research Council’s (NRC’s) 2006 standard value for corn used in the formulation of dog and cat foods is 9.1%. 4 If this value is used when formulating a pet food using the calculation method, the pet food might contain less corn protein than predicted. A similar trend of decreasing protein content was observed in oats and grain sorghum, which could lead to miscalculations with these grains. These discrepancies illustrate the need for pet food companies to directly analyze the nutrient content of their pet foods after formulation and not rely exclusively upon table values for the nutrient content of ingredients.
A second problem with the calculation method is that the quality of ingredients cannot be determined. Ingredient quality affects the level and availability of nutrients in finished pet foods. Standard tables represent averages and cannot reflect differences in ingredient quality among raw ingredients. The processing of a pet food further affects ingredient quality. Nutrient losses can occur during processing or storage, and studies have shown that the digestibility and nutrient availability of plant-based and animal-based ingredients may be significantly affected by processing methods. 5.6. and 7. For example, dogs digest soybean flour more efficiently than soybean grits when incorporated into a canned diet. 5 This difference is probably related to the smaller particle size of the flour. Subsequent work showed that dogs fed different forms of rice assimilate blended rice more efficiently than whole rice. 6 This difference was attributed to reduced food particle size and possibly to increased damage to starch granules in the blended product. In either case, it is apparent that the processing method used for plant ingredients significantly affects digestion and nutrient availability. Differences in the type of processing system and the cooking temperature for animal-based ingredients are also important. When the effects of cooking temperatures and processing systems on 46 sources of meat and bone meal or poultry byproduct meal were examined, it was found that higher processing temperatures caused decreases in the true digestibility values of amino acids in the finished product. 7 Again, if table values alone are used to predict protein content, these effects cannot be predicted. Laboratory analysis of finished products, followed by feeding trials with animals, are the only methods for obtaining reliable information about nutrient availability after pet food processing.
Determination of Digestibility
Current AAFCO regulations do not require that companies determine the digestibility of their foods (see Chapter 18, p. 182). However, the digestibility of a pet food must always be considered. Digestibility provides a measure of a food’s quality because it directly determines the proportion of nutrients in the food that are available for absorption into the body. Pet food companies evaluate the digestibility of their products through feeding studies (in vivo methodology). Digestibility estimates may also be obtained through the use of in vitro methods that have been developed or refined in recent years. 8.9. and 10. Feeding trials are the most accurate method and measure the disappearance of nutrients as they pass through the gastrointestinal tract and are absorbed into the body. The test diet is fed to a group of animals for a pretest period of 5 to 7 days to allow acclimation to the diet. Following this period, the amount of food consumed and the amount of fecal matter excreted are recorded for 3 to 5 days. The fecal matter that is collected represents the undigested residue of the food that was consumed. Laboratory analyses of both feed and fecal matter are conducted to provide the levels of nutrients in each, and amounts of digested nutrients are calculated by subtraction. These figures, expressed as percentages, are called digestibility coefficients. In this type of study, the figures that are derived are called “apparent” digestibility coefficients because the fecal matter also contains metabolic waste products that originated from the animal and not from the food (Table 16-1).
| ∗Based on a 1 to 5 rating: 1 = loose and watery; 5 = firm. Scores of 4 to 5 are considered normal. | |||
| Data provided by Iams Technical Center, Lewisburg, Ohio, 1993. | |||
| D iet | |||
|---|---|---|---|
| A | B | C | |
| Protein digestibility (%) | 70.25 | 80.99 | 85.86 |
| Fat digestibility (%) | 82.70 | 90.42 | 90.72 |
| Fiber digestibility (%) | 17.44 | 48.53 | 61.48 |
| Fecal score∗ | 3.95 | 4.47 | 4.48 |
| Fecal volume | 162.38 | 89.18 | 46.48 |
True digestibility can be determined by estimating the normal metabolic loss of the nutrient and deducting that value from the amount of the nutrient measured in the fecal matter. True digestibility trials are most commonly conducted for protein. The animals are fed a protein-free or very–low-protein diet for a short period, and a baseline level of protein excretion is measured. This figure can then be used to account for the endogenous metabolic loss of protein in the feces when the digestibility trial is conducted. It can be argued that apparent digestibility is actually a better indication of a diet’s ability to supply nutrients than is true digestibility. The endogenous losses that occur in the fecal matter represent cellular and enzymatic losses that are the result of the cost of digesting and absorbing food. Therefore apparent digestibility represents the actual net gain to the animal from the digestion of the food.
Information about the nutrient content of a food means little if the product’s digestibility is not known. For example, laboratory analyses of two different dry dog foods reveal that they each contain 28% protein. If the protein digestibility of diet A is 70.25%, this means that the food actually provides less than 20% digestible protein. On the other hand, if the digestibility of diet B is 85.8%, it provides about 24% digestible protein (Box 16-1; also see Table 16-1). The amount of protein available to the animal is higher in diet B than in diet A, even though laboratory analyses indicate that they have similar total protein contents. Digestibility also affects fecal volume and form and defecation frequency (see Table 16-1). As a diet’s digestibility increases, fecal volume decreases significantly. In addition, a highly digestible pet food produces firm and well-formed feces (see Chapter 18, p. 182 for a complete discussion of factors that affect nutrient digestibility in pet foods). Although manufacturers are not required to conduct digestibility trials on their feeds, reputable companies that produce quality products conduct these trials to ensure that their foods contain levels of nutrients that will meet animals’ daily requirements for absorption into the body.
BOX 16-1
DIET A
28% protein
70.25% of the protein is digestible
Therefore 70.25% of 28% protein = 0.7025 × 28 = 19.67% digestible protein
DIET B
28% protein
85.9% of the protein is digestible
Therefore 85.9% of 28% protein = 0.859 × 28 = 24.05% digestible protein
Determination of Metabolizable Energy
The metabolizable energy (ME) of a pet food is another important consideration when selecting a diet (see Chapter 1, pp. 4-6). ME indicates the amount of energy in a pet food that is available to the animal for use. Although digestible energy (DE) measures the amount of energy that is absorbed across the intestinal wall, ME accounts for digestibility and for losses of energy in the urine and through expired gases (flatus). Although expired gases account for a significant proportion of energy in most farm animals, it is an insignificant energy loss in dogs and cats. Therefore the analysis of the ME of foods for dogs and cats includes only urinary losses of energy.
ME is the preferred unit for analyzing the energy content of pet foods because unlike gross energy (GE), which is a measure of the total energy in the diet, ME provides an accurate representation of the amount of energy that is actually available to the animal. ME is determined most accurately through feeding trials with the target species. Studies in recent years have also provided in vitro methods for ME estimation and factorial equations for the calculation of ME using standard energy values for protein, carbohydrate and fat, and in some cases, dietary fiber. 11. and 12. Finally, a rough estimate of the ME of a pet food can be calculated using the values that are provided in the guaranteed analysis panel on the label (see Chapter 1, pp. 7-8).
The AAFCO allows (and may soon require) the inclusion of caloric claims on pet food labels (see Chapter 15, pp. 135-136). If an ME statement is included, it must be separate and distinct from the guaranteed analysis panel and must be identified as “calorie content.” A pet food’s ME must be expressed as kilocalories (kcal) per kilogram (kg) of product. Additional units such as kcal per measuring cup or pound (lb) may also be listed on the label. Like the “complete and balanced” statement on the pet food label, the ME statement must be accompanied by a substantiation claim. AAFCO regulations allow manufacturers to determine ME content using one of three possible methods:
1. Calculation using modified Atwater factors and values for crude protein, crude fat, and NFE obtained from proximate analysis. (Samples must be taken from at least four production batches of the product.)
2. Calculation from digestible nutrients or DE. (Data are obtained from digestibility trials without urine collection.)
3. Direct determination from digestibility trials (including urine collection).
EXPRESSION OF NUTRIENT CONTENT
The guaranteed analysis panel of a pet food usually reports nutrient levels on an “as-fed” (AF) basis. This means that the nutrient content in the diet is measured directly, without accounting for the amount of water in the product. This type of measurement is considered AF because it represents the level of nutrients in the food as they are consumed by the animal. For example, if 10 ounces (oz) of a semimoist cat food contains 2.5 oz of protein, it contains 25% ([2.5 ÷ 10] × 100) protein on an AF basis. Similarly, if 10 oz of a dry cat food also contains 2.5 oz of protein, it too has a protein content of 25% on an AF basis. Comparing these two foods on an AF basis would indicate that they contribute similar levels of protein to the cat. However, because of the large range in moisture content between different types of pet foods, the diluting effect of water makes comparisons between pet foods on an AF basis difficult to interpret.
Animals eat and are fed to meet their caloric needs. Therefore a food with high water content has its nutrients essentially “diluted” when compared with a food containing less water. Regardless of the amount of moisture in the diet, an animal still needs to eat a certain amount of dry matter (DM) to meet its daily caloric requirement. Conversion of nutrient data to a dry-matter basis (DMB) allows more accurate comparisons to be made between different types of pet foods. For example, the semimoist cat food discussed previously contains 25% water and 75% DM; the dry food contains 10% water and 90% DM. The percentage of protein on a DMB can be calculated by dividing the percentage of the nutrient on an AF basis by the proportion of DM in the diet. The protein content of the semimoist food on a DMB is approximately 33%, but the protein content of the dry diet is 28% (Box 16-2). Therefore, although their label guarantees indicate similar protein contents, the semimoist food actually contains a higher level of protein than does the dry food on a DMB.
BOX 16-2

FORMULA:
EXAMPLE:
Semimoist food contains: 25% protein
75% DM
Dry food contains: 25% protein
90% DM
For semimoist food: (25 ÷ 75) × 100 = 33% protein on a DMB
For dry food: (25 ÷ 90) × 100 = 28% protein on a DMB
One of the most accurate ways to compare foods is by calculating the levels of nutrients as a proportion of ME. This is called nutrient density and is the most accurate way to express a food’s nutrient content because it allows an accurate comparison of nutrient content between all types of pet foods. Although the DM method eliminates differences in nutrient expression due to differences in water content, it does not account for differences in energy content. Nutrient density accounts for differences in both water content and caloric content, and it expresses nutrient levels in pet foods based upon the energy that is available for the animal to use (the ME). Because all animals eat or are fed to meet their energy needs, the amount of food consumed and thus the amount of nutrients taken in depends directly on the caloric content of the food. Nutrient density expresses the energy-containing nutrients such as protein, fat, and carbohydrate as a percentage of ME or as grams (g) per 1000 kcal of ME. The nutritional standard for nutrients that do not contain energy (vitamins and minerals) is units per 1000 kcal of ME.
For example, diets A and B contain the same amount of protein (26%) on a DMB. However, the two foods have different energy densities. Diet A contains 4000 kcal/kg and diet B contains 3500 kcal/kg. Because diet B is lower in calories, a greater quantity (volume of food) needs to be consumed to meet a particular animal’s caloric needs. A dog that requires 2000 kcal/day would consume 500 g of diet A or approximately 570 g of diet B. If the two diets contain the same percentage of protein on a weight basis, the dog would consume more total protein when he was fed diet B than when he was fed diet A (Table 16-2). If the protein level is sufficiently high, excess protein will be consumed when the dog is fed diet B. Excess protein is invariably used directly for energy or converted to fat for the storage of energy. On the other hand, if the diets contain marginal levels of protein, the dog may be deficient in protein when consuming diet A, which had a higher caloric density. This example illustrates the need to increase nutrient density as the caloric density of a diet increases. Although protein is a commonly used example, this concept applies to all of the essential nutrients. Because an animal will be fed less of a calorically dense food, the percentage of nutrients by weight in these foods must be higher so that the animal can still meet its needs for all essential nutrients while eating a lower quantity of food. The nutrient level in pet foods must be carefully balanced so that when caloric requirements are satisfied, the requirements for all other nutrients are met at the same time.
| E nergy requirement ( kcal) | E nergy density ( kcal/ g) | F ood intake ( g) | P rotein in diet (%) | P rotein consumed ( g) | |||||||
|---|---|---|---|---|---|---|---|---|---|---|---|
| Diet A | 2000 | ÷ | 4.0 | = | 500 | × | 26 | ÷ | 100 | = | 130.0 |
| Diet B | 2000 | ÷ | 3.5 | = | 571 | × | 26 | ÷ | 100 | = | 148.5 |
The simplest way to solve the confusion of differences in caloric densities is to express nutrients as a percentage of ME or as units per 1000 kcal of ME, rather than as a percentage of weight. This is certainly the most accurate way to present nutrient content data and compare different foods. Nutrient densities of foods with different moisture contents can be compared because water does not contribute any calories to the distribution. In addition, foods with differing caloric contents are equalized using this method, allowing for accurate representation of nutrient levels. Although using DM calculations eliminates distortions that are the result of differences in moisture content, such comparisons do not take into consideration the calories of the foods or the amounts that must be consumed by the animal to meet energy needs. Comparisons using nutrient densities calculated on a caloric basis can be used with foods of different DM and energy content and with different weights or volumes.
Comparisons of caloric distribution are also important. The three nutrient groups that contribute energy to the diet are protein, carbohydrate, and fat. The relative contribution that each of these groups makes to a diet’s energy content is an important consideration in choosing a suitable pet food for a particular animal. For example, a hard-working dog requires sufficient protein to supply needs for muscle development and maintenance and increased calories to supply the necessary energy for work. Diets for working dogs should contain slightly increased protein and a fairly high proportion of fat. Recommended caloric distribution ranges for performance, expressed as a percentage of ME calories, are 25% to 30% protein, 40% to 45% fat, and 25% to 30% carbohydrate. In contrast, a diet formulated for normally active adult dogs during maintenance should have a lower proportion of fat and an increased proportion of digestible carbohydrates. A suggested distribution range for adult maintenance is 20% to 25% protein, 35% to 40% fat, and 35% to 45% carbohydrate, expressed as percentage of ME. A maintenance diet with this caloric distribution has an energy balance that is shifted from fat to digestible carbohydrate. This profile better meets the reduced energy needs of a less-active dog and makes weight gain less likely. The profile of ME distribution for growing dogs is 25% to 30% protein, 40% to 45% fat, and 30% to 35% carbohydrate, and a profile for growing cats is 30% to 35% protein, 45% to 50% fat, and 20% to 25% carbohydrate (Figure 16-1).
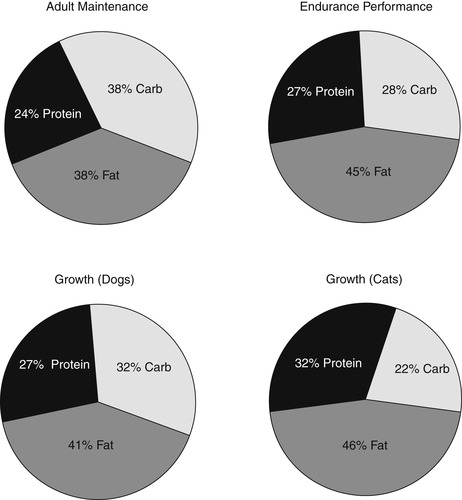 |
| Figure 16-1 |
Pet food companies that provide nutritional information about their products to consumers through brochures and websites often include caloric distribution and nutrient density information. If the information is not available, pet owners can calculate a rough estimate of the food’s ME and caloric distribution of protein, fat, and carbohydrate from the food’s proximate analysis. If the proximate analysis is not known, the guaranteed analysis panel on the label can be used, although it is much less accurate. Calculations that can be used to estimate total ME per kg are provided in Section 1, pp. 4-6. The example used is a dry dog food that contains the following guaranteed analysis:
▸ Crude protein: not less than 26%
▸ Crude fat: not less than 15%
▸ Crude fiber: not more than 5%
▸ Moisture: not more than 10%
Mineral content is estimated to be about 7%, and carbohydrate content is determined by subtraction: 100% − 26% − 15% − 5% − 10% − 7% = 37%. Modified Atwater factors can be used to calculate the number of calories contributed by each nutrient in 100 g of food (see Chapter 1, Table 1-3, p. 8). The total calories in 100 g of food equals 348. The total calories of ME per kg of this food is 3480, or 1582 kcal/lb of food. The percentage of ME calories contributed by protein is approximately 26%. The proportions of calories contributed by fat and carbohydrate are 37% (Box 16-3). This pet food has a distribution that would be appropriate for an adult dog during maintenance.
BOX 16-3
TOTAL CALORIES IN 100 G OF FOOD
Protein = 3.5 kcal/g × 26 g = 91 kcal
Fat = 8.5 kcal/g × 15 g = 127.5 kcal
Carbohydrate = 3.5 kcal/g × 37g = 129.5 kcal
Total kilocalories = 91 + 127.5 + 129.5 = 348 kcal/100 g of food
PERCENTAGE OF ME CONTRIBUTED BY EACH NUTRIENT (CALORIC DISTRIBUTION)
Protein = (91 kcal/348 kcal) × 100 = 26%
Fat = (127.5 kcal/348 kcal) × 100 = 37%
Carbohydrate = (129.5 kcal/348 kcal) × 100 = 37%
If a pet food’s caloric distribution is calculated from the guaranteed analysis panel, it is important to recognize that the calculated numbers represent only a rough estimate and not the actual caloric distribution of the food. Companies that produce quality products and are aware of the importance of nutrient density will make available the ME and caloric distribution information for companion animal professionals and consumers.
PET FOOD INGREDIENTS
The ingredient list on a pet food label contains all of the food sources included in the formulation of the diet. Pet food regulations require the actual ingredients in each food to conform to the label, and the ingredient list cannot contain any reference to the quality of the ingredients that were used. Every ingredient that is part of a commercial pet food is included for a specific purpose. A few of the major ingredients may contain only one major nutrient or nutrient group, and others may contribute several essential nutrients to the diet. For example, corn is an excellent source of starch and is a principal source of digestible carbohydrate in many dry pet foods. Although corn contains a small percentage of protein, the amount of protein that is contributed to the total diet is very low. Therefore corn is considered to be primarily a source of digestible carbohydrate when included in pet foods, rather than an important source of protein. Conversely, chicken contains high levels of protein and fat and is considered to be a source of both of these nutrients. A good rule for determining whether or not an ingredient in a pet food is a protein source is to compare the level of protein in the ingredient with the level of the ingredient in the food. Anything that has a protein content that is greater than its percentage in the diet is considered to be a source of protein for that ration. For example, if a pet food contains 20% chicken byproduct meal that has a protein content of 65%, chicken byproduct meal constitutes a protein source for that food.
To determine if an ingredient on the label is a protein source for the food, compare the level of protein in the ingredient with the level of the ingredient in the food. If the ingredient’s protein content is greater than its percentage in the food, it is considered to be a source of protein for that ration.
When the ingredient list of a pet food is examined, the nutrient or nutrients contributed by each ingredient should be a primary concern. Both the amount and quality of the ingredient in the product determine how efficiently the ingredient can provide nutrition to animals consuming the complete diet. It is also important to consider that a pet food is made up of a number of ingredients, not just the first three or four provided at the start of the list. Nutrients that are contributed by all ingredients must be considered when evaluating a pet food. The following discussion reviews common pet food ingredients and the major nutrients that they contribute to pet foods (Box 16-4).
Box 16-4


| P rimary nutrient contribution | |||
|---|---|---|---|
| Protein | Carbohydrate | Fat | Dietary Fiber |
| Beef | Alfalfa meal | Animal fat | Apple pomace |
| Brewer’s dried yeast | Barley | Chicken fat | Barley |
| Chicken meal | Brewer’s rice | Corn oil | Beet pulp |
| Chicken liver meal | Brown rice | Fish oil | Cellulose |
| Chicken byproduct meal | Carrots | Flax seed (full fat) | Citrus pulp |
| Chicken | Dried kelp | Poultry fat | Oat bran |
| Chicken byproducts | Dried whey | Safflower oil | Peanut hulls |
| Corn gluten meal | Flax seed | Soybean oil | Pearled barley |
| Dried egg product | Flax seed meal | Sunflower oil | Peas |
| Duck | Grain sorghum | Vegetable oil | Rice bran |
| Fish | Ground corn | Soybean hulls | |
| Fish meal | Ground rice | Soybean mill run | |
| Flax seed meal | Ground wheat | Tomato pomace | |
| Lamb | Molasses | ||
| Lamb meal | Oat meal | ||
| Meat byproducts | Pearled barley | ||
| Meat meal | Peas | ||
| Meat and bone meal | Potatoes | ||
| Poultry byproduct meal | Rice flour | ||
| Rabbit | Wheat (ground) | ||
| Salmon | Wheat flour | ||
| Soy flour or grits | |||
| Soybean meal | |||
| Turkey | |||
Protein Sources
The protein in dog and cat foods can be supplied by animal sources, plant sources (grains), or a combination of the two. In general, high-quality animal source proteins provide superior amino acid balances for companion animals when compared with the amino acid balances supplied by grain proteins. However, animal protein sources can range from excellent quality to poor quality. 13 In contrast, grain protein sources are comparatively consistent in their quality and ability to supply amino acids. The protein in grains is not as balanced or available as the protein in high-quality animal sources, but it is superior in these characteristics compared with poor-quality animal protein sources.
ANIMAL-SOURCE PROTEINS
Animal protein sources that are commonly included in pet foods include beef, chicken, chicken meal, lamb, lamb meal, dried egg, fish, fish meal, meat and bone meal, meat byproducts, and meat meal. In recent years, novel protein sources such as rabbit, salmon, duck, turkey, and venison have also been included in some dog and cat foods (see Chapter 31, pp. 399-400). The term meat, as defined by AAFCO, can represent any species of slaughtered mammal. Most commonly, this includes the striated muscle of pork, beef, or sheep. The term poultry includes the flesh and skin of domestic poultry, most typically chicken, turkey, or duck. When a specific species is used, such as chicken, this must be identified as such. When the term byproduct is included in the ingredient name, this means that secondary products are included with the ingredient in addition to the principal product. Byproducts of meat and poultry products are the parts of these animals that are not typically used as human foods in the United States. 14 This includes organ meats, blood, fat tissue, stomach and intestines, but may not include hair, horns, teeth, hoofs, feathers, or fecal matter. 1 For example, when an ingredient is listed as “poultry,” this means that it includes the clean combination of flesh and skin with or without bone derived from part or whole carcasses of poultry, exclusive of feathers, heads, feet, and entrails. On the other hand, “poultry byproduct” refers to the clean parts of carcasses of slaughtered poultry (flesh and skin), which may also contain bone, heads, feet, and intestines. If it includes heads and feet, poultry byproduct meal may be lower in nutritional value than fresh poultry; however, the inclusion of nutrient-rich internal organs may offset this. Another common term that is often part of an ingredient’s name is meal. This term simply refers to any ingredient that has been ground or otherwise reduced in particle size. For example, “chicken meal” is the dry, ground, whole chicken, exclusive of heads, feet, viscera, or feathers, and “chicken byproduct meal” is the same processing method, but may include byproducts.
Depending on the supplier and the type of refining process that the pet food manufacturer uses, animal protein sources can vary greatly in quality and digestibility. Several factors influence this. Meat protein sources can contain varying amounts of bone. If meat and bone meal is included as an ingredient, the amount of bone contained in the product affects its quality as a protein source as well as the mineral balance of the entire diet. The matrix of bone is composed of the protein collagen. Collagen is very poorly digested by dogs and cats, yet it will be analyzed as protein in the pet food. All muscle meats are very low in calcium content and have calcium:phosphorus ratios between 1:15 and 1:26. When bone is included with a meat ingredient, the calcium level of the product is increased, and the calcium:phosphorus ratio may be normalized. However, inexpensive meat and bone meals often contain excess levels of minerals. In this case, the problem becomes one of supplying too much calcium, phosphorus, and magnesium, rather than an insufficient amount of these nutrients. An excessively high calcium level in a pet food that contains meat and bone meal, poultry meal, or fish meal is an indication that the meal included in the product may be of poor quality and contains excessively high amounts of bone.
< div class='tao-gold-member'>
Only gold members can continue reading. Log In or Register to continue
Stay updated, free articles. Join our Telegram channel
Full access? Get Clinical Tree
