Introduction to Veterinary Hematology

Chapter 1 Introduction to Veterinary Hematology


Laboratory tests are done for a variety of reasons. Screening tests, such as a complete blood count (CBC), may be done on clinically normal animals when they are acquired to avoid a financial and/or emotional commitment to a diseased animal, to examine geriatric patients for subclinical disease, or to identify a condition that might make an animal an anesthetic or surgical risk. Screening tests are often done when an ill animal is first examined, especially if systemic signs of illness are present and a specific diagnosis is not apparent from the history and physical examination. Tests are also done to confirm a presumptive diagnosis. A test may be repeated or a different test may be done to confirm a test result that was previously reported to be abnormal. Tests may be done to assist in the determination of the severity of a disease, to help formulate a prognosis, and to monitor the response to therapy or progression of disease.


Decisions to request hematology tests in animals are largely based on the cost of the test versus the potential benefit of the result to the animal. A CBC is routinely done to establish a database for patient evaluation, while other hematology tests may be done in an attempt to evaluate a specific problem. Examples of more specific hematologic tests that focus on a problem identified during the diagnostic evaluation of an animal include coagulation tests, such as prothrombin time; bone marrow biopsy and interpretation; and immunologic tests, such as the direct Coombs’ test. Although single tests may be done to address a specific problem (e.g., an erythrocyte phosphofructokinase assay), multiple tests are often utilized to provide a more comprehensive answer to a broader problem (e.g., a hemostasis panel is generally requested to evaluate a bleeding animal).


Stat is an abbreviation for statim (Latin meaning “immediately”). Stat tests are tests that are given high priority and begun immediately in situations where rapid results are needed for the medical management of critically ill patients. Additional fees may be charged for stat tests because they disrupt the flow of work in the laboratory and result in inefficiency.


Internal Versus External Laboratories


A variety of factors should influence the decision of whether a test will be done in an in-house laboratory or be sent to an external laboratory. A major concern is whether the necessary personnel, equipment, and supplies are available to perform the test accurately. Considerations include personnel knowledge of species differences and a willingness to conduct quality-control tests to verify that the procedure is working properly. The costs per test (technician time, reagent costs, equipment costs) must be compared to determine which option is more economical. The stability of the test may determine whether it will be done internally. The time it takes to obtain results may be important, especially with critically ill patients. The hours of operation of the laboratories are important for test results that are needed at night or on the weekend. Commercial laboratories generally have better quality control than laboratories within private practices.


Commercial veterinary laboratories are preferred to commercial human laboratories because errors can occur if tests designed to evaluate human samples are used without modification to test samples from animals. Hematology analyzers must be calibrated for species differences to obtain accurate results. Technologists must be aware that blood cell morphology and blood parasites are different in various animal species. Antibody-dependent immunology tests designed for humans are generally not valid in animals. Veterinary laboratories are more likely to have established their own reference intervals for various animal species (as opposed to extracting them from the literature) than are human laboratories. A knowledge of specific animal diseases and training in veterinary laboratory medicine is essential for the evaluation of hematologic specimens and interpretation of laboratory data; consequently a veterinary clinical pathologist should be available to perform certain subjective tests and provide consultation concerning all test results.


Reference Intervals


In order to be able to interpret laboratory data from ill animals, it is essential that appropriate reference intervals be established from apparently healthy animals drawn from the same general population as the ill animals to be examined. The term reference interval is preferred to the commonly used normal range. The latter term implies that it is the range of test results from all “normal” animals. In reality, a low percentage of apparently healthy “normal” animals will have test values outside the normal range, and, depending on the test, many abnormal (diseased) animals may have values within the normal range. Healthy animals may have transient increases or decreases in laboratory test results based on changes in environment, emotional status, diet, and so on, and a low percentage of healthy animals simply have values above or below the general population of healthy animals. Apparently healthy animals may also have occult disease that causes one or more abnormal laboratory test results, and sample collection, handling, and laboratory errors can result in artifactually high or low values from healthy animals. Consequently it is not appropriate simply to use the actual range of values from all apparently healthy animals assayed. To develop useful reference intervals, one must decide which animals will be assayed, how many animals need to be analyzed, and what method or methods will be used to remove high or low outliers that would otherwise render the interval of limited value as a reference.


Selection of Reference Animals


Specific reference intervals are needed for each species of animal being tested. Less often, a different reference interval is needed for an analyte from a specific breed of animal (e.g., hematocrit values in greyhound dogs are higher than those in most other dog breeds). Values may vary with the age of the animal, with major changes occurring prior to puberty (e.g., 3-week-old pups have lower hematocrits than adults). Consequently some analytes need different reference intervals for different age groups. Some analytes also vary with sex, pregnancy, emotional state, and activity level. The types of animals sampled and environmental conditions present during the establishment of a reference interval should be defined, along with the methods and equipment used, so that the user can make appropriate evaluations. Ideally, a reference interval should be established using a population of healthy animals with a composition (age, breed, sex, diet, etc.) like the population of ill animals being evaluated. Homogeneous populations generally have more narrow reference intervals than heterogenous populations. Establishing a reference interval for a blood analyte using a group of male foxhound dogs housed in a research colony, fed the same diet, and conditioned to phlebotomies would likely result in reference intervals too narrow for the population of dogs examined in a typical small-animal practice. Reference intervals are generally established for a species by utilizing samples from apparently healthy adult animals of both sexes and various breeds. Monogastric animals should have been fasted overnight prior to blood sample collection.


Determination of Reference Intervals


Specific reference intervals should be established for each instrument and each test evaluated. Ideally, each animal would have its own reference intervals established by multiple assays done over time when the animal was healthy. In some instances, limited numbers of baseline values are available for an animal that can be helpful, but rarely are analytes measured often enough to establish an accurate reference interval for an individual animal. Consequently population-based reference intervals are used.


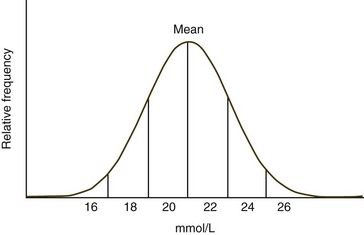
When the frequency diagram of test results from a healthy population is examined, many analytes exhibit a Gaussian or bell-shaped distribution (Fig. 1-1). When a Gaussian distribution is present, a minimum of 40 individuals (100 or more is preferred) should be assayed for statistical validity.2 In this case, the reference interval is calculated using the mean ±2 standard deviations (SD). This interval approximates the 95% confidence interval. In other words, about 95% of healthy animals have test values within this reference interval, with about 2.5% of healthy animals having values above and about 2.5% of healthy animals values below the reference interval. A common mistake made by novices is to calculate the reference interval from the mean ±1 SD. When this is done, about 32% of healthy animals will have values outside the calculated interval. If less than 40 healthy animals are available, the upper and lower values measured should be used to create an estimated reference interval.5


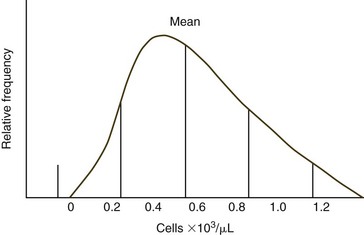
Some analytes do not exhibit a Gaussian distribution. Most commonly there is a skew toward the higher values. The use of mean ±2 SD to calculate reference intervals results in inappropriate reference intervals for skewed populations, as shown in Figure 1-2. Data may be manipulated (e.g., log or square root transformation) so that the frequency distribution of the transformed data approximates a Gaussian distribution. The boundaries are determined as before and results are retransformed to determine the reference interval. Alternatively, one can use percentiles to determine upper and lower limits, especially if large numbers of healthy animals are evaluated. Values are listed in ascending order. The lower limit is determined by the formula (n + 1) × 0.025, and the upper limit is determined by the formula (n + 1) × 0.975, where n = the number of normal animals assayed.2 If 119 animals were used, the value for the 3rd lowest animal would be used as the lower limit and the value from the 117th animal (3rd from the top) would be used as the upper limit.


Use of Published Reference Intervals


Routine hematology test results are usually similar between laboratories; consequently published reference intervals for values such as total leukocyte counts and hematocrits are often used to interpret results from a species (e.g., wallaby) when reference values have not been established in the laboratory conducting the test. Hematology indices such as the red cell distribution width (RDW) vary more between laboratories, making the use of published reference intervals less acceptable.


The units used in reporting values can vary by laboratory and a conversion factor may be needed to compare a measured value to a published reference interval. For example, blood iron might be reported as 100 µg/dL or 18 µmol/L. Most U.S. laboratories continue to use conventional units, such as mg/dL; Canadian and European laboratories use the International System of Units (SI units), such as mmol/L. Where possible, moles are used rather than weight (e.g., mg) for SI units. This cannot be done for analytes, such as serum protein concentration, where the molecular weight is variable and/or unknown. For enzymes, an SI enzyme unit is defined as 1 µmol/min of substrate utilized or product formed. SI units are reported per liter.


For many wild animal species, reference intervals may not be published for some or all tests. The simultaneous measurement of a healthy “control” animal from the same species, preferably a cohort, can be used as a rough guideline reference value and therefore can aid interpretation of the patient’s results.


Sensitivity and Specificity of Tests


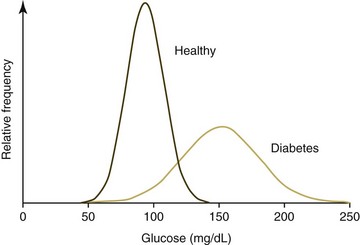
Ideally analyte values obtained from a healthy animal population would not overlap with values obtained form a diseased animal population. Unfortunately there is almost always some overlap in the distribution of individual analyte test results between the two groups (Fig. 1-3). When the disease being considered has a major impact on an analyte, little overlap in values will occur; however, extensive overlap occurs if the analyte concentration is minimally altered by the disease being considered. True positives (TPs) are positive test results from animals with the disease for which they are being tested, false positives (FPs) are positive test results for animals without the disease for which they are being tested (Fig. 1-4), true negatives (TNs) are negative test results from animals without the disease for which they are being tested, and false negatives (FNs) are negative test results from animals with the disease for which they are being tested. As can be seen in Figure 1-4, if one increases the reference interval of the healthy population in order to minimize the FPs, the number of FNs increases.


Stay updated, free articles. Join our Telegram channel

Aug 26, 2016 | Posted by in INTERNAL MEDICINE | Comments Off on Introduction to Veterinary Hematology

Full access? Get Clinical Tree

Get Clinical Tree app for offline access