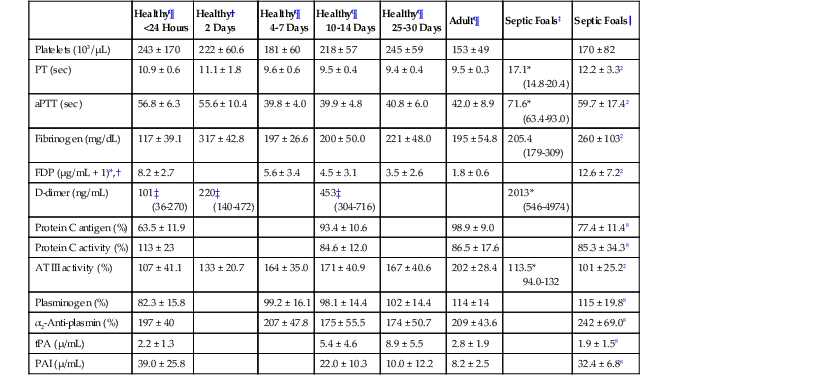
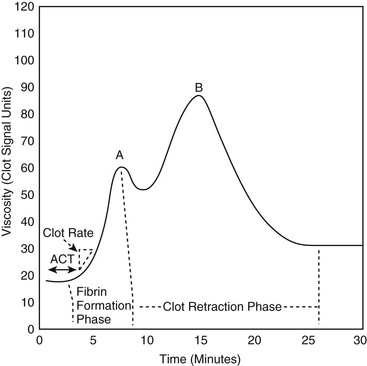
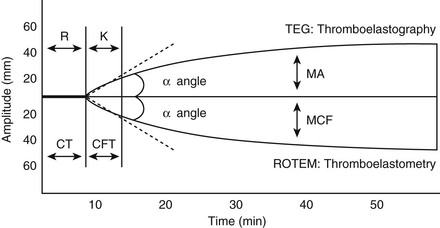
David M. Wong, Charles W. Brockus Knowledge of the various diagnostic tests useful in assessing the hematopoietic system is essential in the evaluation of hematopoietic disorders in foals. Reference intervals for numerous coagulation parameters are different from adult horse values; these differences are important to remember in evaluating clinicopathologic data in foals. In general, the foal’s platelet count tends to be higher, prothrombin time (PT) and activated partial thromboplastin time (aPTT) are slightly longer, and the concentration of fibrin degradation products (FDP) and plasminogen activator inhibitor (PAI) activity are also higher than in adult horses. Additionally, lower values for concentrations of fibrinogen, protein C, and antithrombin (AT) have been observed in foals, compared with adults. Ideally, individual clinical pathology laboratories should establish age-specific reference intervals, but published reference intervals for various coagulation parameters in foals at different ages have been summarized (Table 174-1). In more recent years, novel diagnostic tests for evaluating the coagulation system have been investigated in foals, including the mean platelet component (MPC) and whole-blood viscoelastic coagulation analysis such as thromboelastography, thromboelastometry, Sonoclot coagulation, and platelet function analysis. A brief review of these newer diagnostic tests is provided in this chapter. TABLE 174-1 Reported Reference Intervals for Various Coagulation Parameters in Adult Horses and Healthy and Septic Foals * Significantly different from control group (control group 2-7 days of age); median, 25th-75th percentile range. † From Bentz AI, Palmer JE, Dallap BL, et al. Prospective evaluation of coagulation in critically ill neonatal foals. J Vet Intern Med 2009;23:161-167. ‡ From Armengou L, Monreal L, Tarancon I, et al. Plasma D-dimer concentration in sick newborn foals. J Vet Intern Med 2008;22:411-417. ║ From Barton MH, Morris DD, Norton N, et al. Hemostatic and fibrinolytic indices in neonatal foals with presumed septicemia. J Vet Intern Med 1998;12:26-35. ¶ From Barton MH, Morris DD, Crowe N, et al. Hemostatic indices in healthy foals from birth to one month of age. J Vet Diagn Invest 1995;7:380-385. 2 Significantly different from age-matched control group at 2-7 days of age. 8 Significantly different from age-matched control group at 8-14 days of age. Mean platelet component is a variable that is evaluated on modern complete blood count analyzers. The MPC represents the mean refractive index of platelets and is linearly related to platelet density (i.e., granularity). When platelets are activated, they degranulate, which decreases refractive index and, as a result, MPC. Determination of MPC has been used in numerous species, including horses and foals, as an indicator of platelet activation in various disease processes, such as equine neonatal septicemia and colic. Few studies have evaluated use of MPC in horses, but in one study MPC was the lowest in foals with evidence of disseminated intravascular coagulation (DIC; MPC, 23.8 ± 6.3 g/dL), compared with healthy neonatal foals (28.1 ± 1.7 g/dL), but was also significantly lower in septic foals (24.0 ± 3.5 g/dL) and nonseptic ill foals (26.6 ± 2.6 g/dL). Thromboelastography (TEG) is a temperature-dependent test that evaluates the coagulation system and is performed with a point-of-care (POC) analyzer and whole blood. Traditional coagulation testing in horses consists of numerous tests run on large, expensive analyzers, including PTT, PT, fibrinogen, D-dimers, FDP, AT, and platelet count; these parameters can be described as short, separated snippets of the coagulation cascade at different timepoints. In contrast, TEG involves a small volume of whole blood that can be evaluated on a POC analyzer and provides a more continuous method of analysis in a manner that is comparable to a continuous movie of the coagulation cascade from start to finish (i.e., from clot formation, clot development, and clot retraction to clot lysis) with one method of testing. Because TEG uses whole blood, testing evaluates the roles of platelets, microparticles, tissue factor–bearing cells, enzyme systems, and endothelial cells. The resulting schematic acquired through TEG analysis provides more complete information on the activities of both clot formation and clot strength. This test necessitates specialized instrumentation that records the kinetic changes of clot formation, retraction, and clot lysis and records test results in the form of a small schematic (Figure 174-1). Thromboelastography measures the time to clot formation by means of the tensile strength of the clot (fibrin–polymer–platelet complex) using values from the schematic, including R-time (R = clot formation), K-time (K = clot strength), angle (α = rate of clot formation), and maximum amplitude (MA = greatest clot strength). Other calculated values include G-time, which is an indicator of clot firmness. G-time represents “global” coagulation in a single output number derived from the following formula: G = 5000 × MA/(100 − MA); because G is dependent only on MA, like MA it is a function of fibrinogen concentration, platelet count and function, thrombin concentration, factor XIII activity, and hematocrit. In a 2001 study by Mendez-Angulo and colleagues involving healthy, sick nonseptic, and septic foals, a significant increase in α angle (representing rapidity of fibrin buildup and cross-linking), MA (strength of clot), and G-value was observed in the septic group, compared with the other two groups, suggesting a hypercoagulable state. The MA value of the schematic appeared to be the most consistent and applicable evaluator of hemostasis in equine neonates. However, also reported in that study was high variability in TEG values in normal foals during the first week of life, indicating that normal physiologic variability must be taken into account in the monitoring of neonatal foals. Rotational thromboelastography (ROTEM), termed thromboelastometry, also provides global information on hemostatic function (i.e., clot formation, retraction, and fibrinolysis). Despite having slight technical differences from TEG, ROTEM produces a graphic tracing somewhat similar to that yielded by TEG (see Figure 174-1). Variables displayed on the ROTEM tracing include initial fibrin formation, representing plasma coagulation factor activity (clotting time; CT), the activation of platelets and fibrin formation (clot formation time; CFT), the kinetics of clot formation (α), maximum strength of fibrin clot (maximum clot firmness; MCF), and variables reflecting fibrinolysis at various time points (clot lysis; LY). The Sonoclot analyzer is another POC method of evaluating hemostasis, and uses whole blood or plasma specimens and yields qualitative and quantitative information. Results from this method of analysis also provide a more complete look at hemostasis with a much smaller blood sample, compared with traditional methods. Results are reported as a generated Sonoclot Signature (SS) graph that provides information about initial clot formation (activated clotting time, ACT), clot rate (CR), time to peak (how fast platelets are activated), and clot retraction (Figure 174-2). Evaluating the time to clot retraction and degree of retraction also permits an important assessment of platelet function. In a small 2009 study by Dallap-Schaer and colleagues, SS measurements were performed in critically ill foals and a significantly decreased median CR and prolonged ACT were seen in septic foals, compared with healthy foals. A clear association between abnormal coagulation parameters and outcome was not documented, but a slow CR (i.e., slow clot formation) was associated with an increased risk for death.
Hemopoietic Disorders in Foals
Diagnostic Testing of the Hematopoietic System in Foals
Healthy¶
<24 Hours
Healthy†
2 Days
Healthy¶
4-7 Days
Healthy¶
10-14 Days
Healthy¶
25-30 Days
Adult¶
Septic Foals‡
Septic Foals║
Platelets (103/µL)
243 ± 170
222 ± 60.6
181 ± 60
218 ± 57
245 ± 59
153 ± 49
170 ± 82
PT (sec)
10.9 ± 0.6
11.1 ± 1.8
9.6 ± 0.6
9.5 ± 0.4
9.4 ± 0.4
9.5 ± 0.3
17.1*
(14.8-20.4)
12.2 ± 3.32
aPTT (sec)
56.8 ± 6.3
55.6 ± 10.4
39.8 ± 4.0
39.9 ± 4.8
40.8 ± 6.0
42.0 ± 8.9
71.6*
(63.4-93.0)
59.7 ± 17.42
Fibrinogen (mg/dL)
117 ± 39.1
317 ± 42.8
197 ± 26.6
200 ± 50.0
221 ± 48.0
195 ± 54.8
205.4
(179-309)
260 ± 1032
FDP (µg/mL + 1)*,†
8.2 ± 2.7
5.6 ± 3.4
4.5 ± 3.1
3.5 ± 2.6
1.8 ± 0.6
12.6 ± 7.22
D-dimer (ng/mL)
101‡
(36-270)
220‡
(140-472)
453‡
(304-716)
2013*
(546-4974)
Protein C antigen (%)
63.5 ± 11.9
93.4 ± 10.6
98.9 ± 9.0
77.4 ± 11.48
Protein C activity (%)
113 ± 23
84.6 ± 12.0
86.5 ± 17.6
85.3 ± 34.38
AT III activity (%)
107 ± 41.1
133 ± 20.7
164 ± 35.0
171 ± 40.9
167 ± 40.6
202 ± 28.4
113.5*
94.0-132
101 ± 25.22
Plasminogen (%)
82.3 ± 15.8
99.2 ± 16.1
98.1 ± 14.4
102 ± 14.4
114 ± 14
115 ± 19.88
α2-Anti-plasmin (%)
197 ± 40
207 ± 47.8
175 ± 55.5
174 ± 50.7
209 ± 43.6
242 ± 69.08
tPA (µ/mL)
2.2 ± 1.3
5.4 ± 4.6
8.9 ± 5.5
2.8 ± 1.9
1.9 ± 1.58
PAI (µ/mL)
39.0 ± 25.8
22.0 ± 10.3
10.0 ± 12.2
8.2 ± 2.5
32.4 ± 6.88
< div class='tao-gold-member'>
![]()
Stay updated, free articles. Join our Telegram channel

Full access? Get Clinical Tree


Hemopoietic Disorders in Foals
Chapter 174
Only gold members can continue reading. Log In or Register to continue
