Chapter 19 Depth of Anesthesia Monitoring by Bispectral Analysis in Zoo Animals
In human medicine, DoA measurement is of special importance to avoid occurrence of awareness—that is, the postoperative recollection of events occurring during general anesthesia. In a recent review, incidences of awareness up to 0.2% in adults and up to 0.8% in children were reported.3
For safety reasons, often a lower than necessary DoA will be chosen, which only prolongs recovery but increases the dose-dependent cardiopulmonary impairment, resulting in an increase of postanesthetic morbidity and mortality. This is reflected by the high anesthetic- and sedative-related risk of death, which ranges in small mammals from 1.4% to 3.6%, in birds from 1.8% to 16.3%, and in reptiles it is 1.5%, compared with dogs and cats (0.1% to 0.2%) and humans (0.02% to 0.01%2). In wildlife anesthesia, mortalities up to 3% have been reported and it was proposed that mortalities above 2% should not be acceptable.1
These monitors process the level of corticocerebral activation measured by analog EEGs into a signal that reflects the DoA. The most widely used monitor is the BIS, which in 2004 was used in approximately 34% of all hospital operating rooms in the United States and 78% of teaching institutions, and had a worldwide installation base of over 25,000 units.8 Numerous studies have investigated the BIS. An Internet search on the term bispectral index anesthesia in August 2010 produced over 138,000 results, including a report on the use of the BIS in animals, including the dog, cat, horse, and goat.9
Bispectral Analysis Methodology
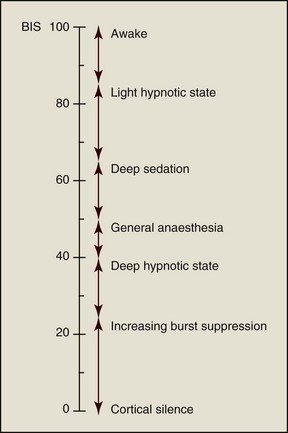
Bispectral analysis is based on a complex statistical evaluation of human electroencephalographic data that was developed to obtain an index of the level of hypnosis. It uses a Fourier transform, an operation that transforms one complex-valued function of a real variable into another, such as time into frequency. The BIS value is represented as a dimensionless value from 0 (cortical silence) to 100 (awake) (Fig. 19-1). In humans, an optimal degree of general anesthesia is defined as that associated with a BIS within the range of 40 to 60.
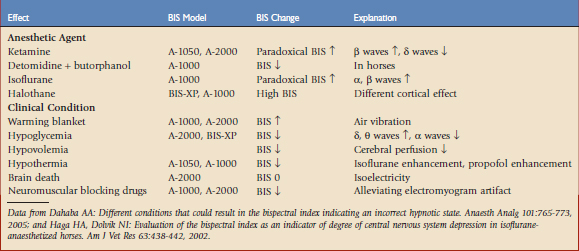
In 1996, the U.S. Food and Drug Administration approved the BIS monitor as an accepted measure of the hypnotic effect of anesthetics and sedative drugs in humans. Since its introduction, BIS monitoring has gained increasing popularity in daily anesthesia practice. However, the current evidence indicates various cases of paradoxical BIS changes and inaccurate readings, which also need to be to be taken into consideration when applying the BIS in veterinary medicine (Table 19-1).4,6
Technique and Optimum Setting
The monitor is available as stand-alone system or as an add-on module for most comprehensive patient monitoring systems. Our studies were performed with an A-2000-XP Platform Bispectral Index Monitoring System (Aspect Medical Systems). The sensors were fitted with 24-gauge needles to allow subcutaneous placement instead of the need to shave or pluck the areas, even in small animals. The impedances for sensors 1 and 3 and for sensor 2 were always <7.5 kΩ and <30 kΩ, respectively. Figure 19-2 graphically displays the location of the sensors.
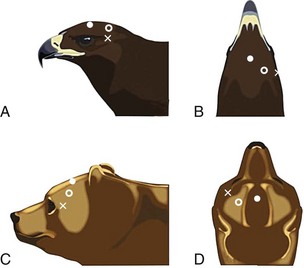
(Courtesy Jeanne Peter, Institute of Veterinary Anatomy, University of Zurich, Zurich, Switzerland.)
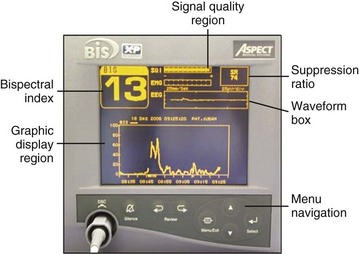
Based on the system we used, the different results are displayed in Figure 19-3. The main value is the BIS value, ranging from 0 (flatline or isoelectric EEG) to 100 (awake), which is displayed every 5 seconds. This represents the mean of the maximum and minimum indices of the last 15 or 30 seconds. This smoothing rate needs to be selected in the main menu. In cases of high interference, a longer smoothing rate (30 seconds) is chosen.
Stay updated, free articles. Join our Telegram channel

Full access? Get Clinical Tree


